
Key Takeaways
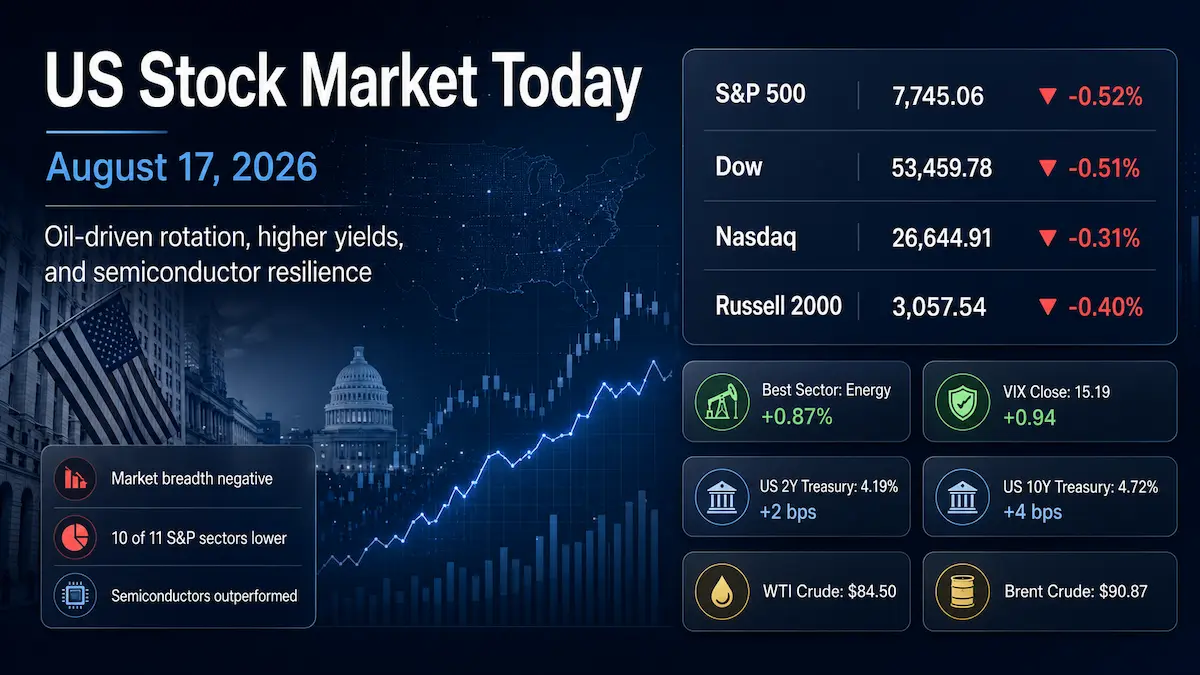
- The S&P 500 fell 0.52% to 7,745.06, the Dow Jones Industrial Average lost 0.51% to 53,459.78, and the Nasdaq Composite declined 0.31% to 26,644.91. The Russell 2000 slipped 0.4% to 3,057.54, modestly outperforming large caps on a relative basis.
- Energy was the only S&P 500 sector to finish higher, gaining 0.87% as Brent crude settled at $90.87 a barrel and WTI at $84.50 amid renewed U.S.-Iran supply concerns. Communication Services was the weakest sector, down roughly 1.5%, while Consumer Staples also fell about 1.5%.
- The headline index decline understated a sharp internal split in technology: the PHLX Semiconductor Index rose 1.6%, while the S&P 500 Software & Services Index fell 2.8%. Microsoft and Meta each dropped more than 3%, while Applied Materials rose 5.55%.
- Risk pricing firmed without signaling panic. The Cboe VIX closed at 15.19, up 0.94 points or 6.60%, while official U.S. Treasury data showed the 2-year yield at 4.19% and the 10-year yield at 4.72%, up 2 and 4 basis points, respectively, from Friday.
1. Market Capital Flows and Sector Rotation
Monday’s tape was a broad but relatively orderly de-risking session rather than a simple megacap selloff. Energy gained 0.87% and was the only positive S&P 500 sector, directly benefiting from higher crude prices. Communication Services was the worst performer at roughly -1.5%, with Consumer Staples also down about 1.5%. Financials and Consumer Discretionary each lost a little more than 1%, while Information Technology declined nearly 0.2% because semiconductor strength offset a much steeper software drawdown.
Relative performance across style buckets was unusually mixed. Small caps declined 0.4%, slightly less than the S&P 500’s 0.52% loss, so the session did not show a clean flight from smaller companies into large-cap defensives. Cyclicals also diverged: Energy rallied on the oil shock, but Financials and Consumer Discretionary fell more than 1%. Defensive positioning did not work uniformly either, with Consumer Staples among the weakest sectors. The growth-versus-value signal was similarly non-binary: high-duration software sold off sharply, yet semiconductors rallied, while commodity-linked Energy provided the clearest value-oriented leadership. The better description is an industry-level barbell rather than a textbook factor rotation.
Market breadth confirmed that weakness extended beyond a handful of index heavyweights. Decliners outnumbered advancers by 1.76-to-1 on the NYSE and 1.68-to-1 on Nasdaq. At the same time, total U.S. exchange volume was 14.74 billion shares, below the 20-session average of 16.95 billion. That combination points to broad participation in the decline but not to unusually heavy liquidation.
Institutional Flow Insight: The most plausible allocation logic is a combination of inflation sensitivity, earnings visibility and risk-budget discipline rather than a wholesale risk-off pivot. Higher oil prices improve near-term cash-flow leverage for Energy while increasing the inflation and margin risk faced by rate-sensitive and consumer-exposed assets. Within technology, investors appeared willing to pay for semiconductor companies tied to visible AI infrastructure spending while reducing exposure to software names facing greater duration and monetization scrutiny. The rise in VIX alongside below-average turnover is consistent with selective hedging and modest de-risking, not forced deleveraging. Because this was mid-month rather than a month- or quarter-start window, there is no clear reason to attribute the rotation to calendar rebalancing.
2. Decoding the Biggest Market Movers
Applied Materials (AMAT)
Applied Materials closed at $535.31, up 5.55%, making it one of the strongest contributors to the S&P 500 as semiconductor shares outperformed. The move came in a session when the PHLX Semiconductor Index rose 1.6%, contrasting sharply with the 2.8% decline in the S&P 500 Software & Services Index. Importantly, Monday did not bring a new earnings release; the stock was rebounding within a broader chip rally after the market had already digested Applied’s August 13 fiscal third-quarter report.
The company’s official Investor Relations release showed fiscal Q3 revenue of $9.12 billion, up 25% year over year. GAAP gross margin was 50.3%, non-GAAP gross margin was 50.4%, GAAP EPS was $3.17, and non-GAAP EPS was $3.50. Applied guided fiscal Q4 revenue to $10.25 billion, plus or minus $500 million, and non-GAAP EPS to $4.02, plus or minus $0.20. Its published earnings-call script added that DRAM revenue, including HBM packaging, grew 52% year over year in Q3 and that management expected a significant increase in DRAM revenue in the second half of the calendar year.
The sector read-through matters more than the one-day price move. Applied’s reported margin expansion and demand visibility in DRAM, leading-edge foundry-logic and advanced packaging support the market’s willingness to distinguish semiconductor capital-equipment exposure from software duration risk. That does not eliminate valuation risk across AI-linked equities, but it helps explain why capital rotated within technology instead of exiting the sector uniformly.
L3Harris Technologies (LHX)
L3Harris fell 4.6% after announcing an immediate leadership transition. In an August 17 Form 8-K, the company said Sam Mehta was appointed President and Chief Executive Officer and joined the board, while Christopher Kubasik stepped down as Chairman and CEO. The filing said the change followed an investigation by independent board members with independent counsel into conduct the board found inconsistent with the company’s Code of Conduct.
The distinction between governance risk and operating risk is important. L3Harris stated that the conduct did not involve, and had no impact on, financial reporting, controls, customer relationships or operational performance. Its accompanying press release also reaffirmed 2026 consolidated revenue, organic growth, segment operating margin, GAAP EPS and free-cash-flow guidance. The selloff therefore appears more consistent with a higher governance and leadership-transition risk premium than with a newly disclosed deterioration in defense demand or earnings. Unless subsequent disclosures change the operating assessment, the direct read-through to defense-sector peers should remain more limited than the stock’s own reaction.
3. Macro Indicators and Market Outlook
The Cboe VIX closed at 15.19, rising 0.94 points, or 6.60%, from 14.25. That move was directionally consistent with the S&P 500 decline and with increased demand for near-term equity protection. However, a VIX level in the mid-teens remains far from a disorderly-volatility regime. The signal is better read as a moderate increase in hedging and event-risk pricing than as evidence of market stress approaching capitulation.
U.S. Treasury’s official daily par yield curve showed the 2-year yield at 4.19% and the 10-year yield at 4.72% on August 17, versus 4.17% and 4.68% on August 14. The 2-year yield therefore rose 2 basis points and the 10-year yield rose 4 basis points, steepening the 2s10s spread to about 53 basis points from 51 basis points. Because the long end moved more than the front end, the session should not be reduced to a single-message Fed repricing. Persistent inflation risk, fiscal and issuance concerns, and a higher term premium can pressure longer maturities even while investors remain uncertain about the next policy move. The Federal Reserve’s July 29 statement kept the federal-funds target range at 3.50%-3.75% and said inflation remained elevated, reinforcing why upcoming policy communication remains market-sensitive.
Oil was the cross-asset variable with the clearest equity-sector impact. Brent settled at $90.87 a barrel and WTI at $84.50 as stalled U.S.-Iran diplomacy renewed concern about supply and shipping through the Strait of Hormuz. Higher crude directly supported Energy equities, but it also reintroduced an inflation and consumer-margin headwind for the broader market. That helps explain why Energy could rally even as Consumer Discretionary and Consumer Staples weakened.
Upcoming Economic Data & Catalysts:
- New Residential Construction — Building Permits, Housing Starts and Housing Completions (Release date: August 18, 2026): The U.S. Census Bureau is scheduled to release July housing data at 8:30 a.m. ET. Investors will watch permits and starts for evidence on rate-sensitive demand, construction activity and the transmission of elevated borrowing costs.
- FOMC Minutes for the July 28-29 Meeting (Release date: August 19, 2026): The Federal Reserve is scheduled to publish the minutes at 2:00 p.m. ET. Markets will focus on the balance between inflation concerns and growth risks, especially after the committee held rates at 3.50%-3.75% while three voters preferred a 25-basis-point increase.
Market Insights:
The August 17 decline was broader than a megacap-only pullback: 10 of 11 S&P 500 sectors fell and breadth was negative on both major exchanges. Yet the low trading volume, mid-teens VIX and strong semiconductor tape argue against labeling the session a broad liquidation event. The most important reversal risks are a further oil shock, another sharp rise in long-term Treasury yields, deteriorating breadth combined with heavier volume, downward earnings revisions, unexpected policy developments, or a sustained volatility breakout from the current low regime. Conversely, stabilization in oil and long-end yields would reduce two of the day’s clearest valuation and margin pressures.
Trading & Investment Strategy:
Risk management should take priority over chasing the day’s strongest theme. Investors can keep position sizes aligned with portfolio volatility budgets, add to high-conviction exposures in stages rather than at gap-up prices, and favor sectors where earnings visibility can justify valuation. Energy exposure should be sized with the recognition that geopolitical oil premiums can reverse quickly, while semiconductor exposure still carries concentration and valuation risk despite strong current fundamentals. Use predefined exit or review levels, avoid adding leverage simply because VIX remains low, and distinguish between company-specific governance shocks and sector-wide fundamental changes before making relative-value trades.
4. Key FAQs About the US Stock Market Today
Why did the US stock market move on August 17, 2026?
U.S. stocks fell as higher oil prices revived inflation and margin concerns, Treasury yields moved higher, and investors stayed cautious ahead of important retail earnings and Federal Reserve minutes. The decline was broad, but semiconductor strength limited the Nasdaq’s loss and prevented technology from weakening uniformly.
Which sectors performed best and worst in the US stock market on August 17, 2026?
Energy was the best S&P 500 sector, gaining 0.87% as crude prices rose. Communication Services was the weakest, falling roughly 1.5%, while Consumer Staples also lost about 1.5%. The pattern reflected an oil-driven sector bid rather than a classic defensive rotation.
What should investors watch after the US stock market close on August 17, 2026?
The immediate macro checkpoints are the August 18 U.S. housing release and the August 19 FOMC minutes. Investors should also monitor whether the 10-year Treasury yield extends above its August 17 level, whether oil remains elevated, whether negative market breadth begins to occur on heavier volume, and whether semiconductor leadership broadens or narrows. Those signals can help distinguish a temporary rotation from a more durable tightening in financial conditions.
Disclaimer: This article is intended solely for the exchange of investment ideas and does not constitute investment advice of any kind.