


Key Takeaways
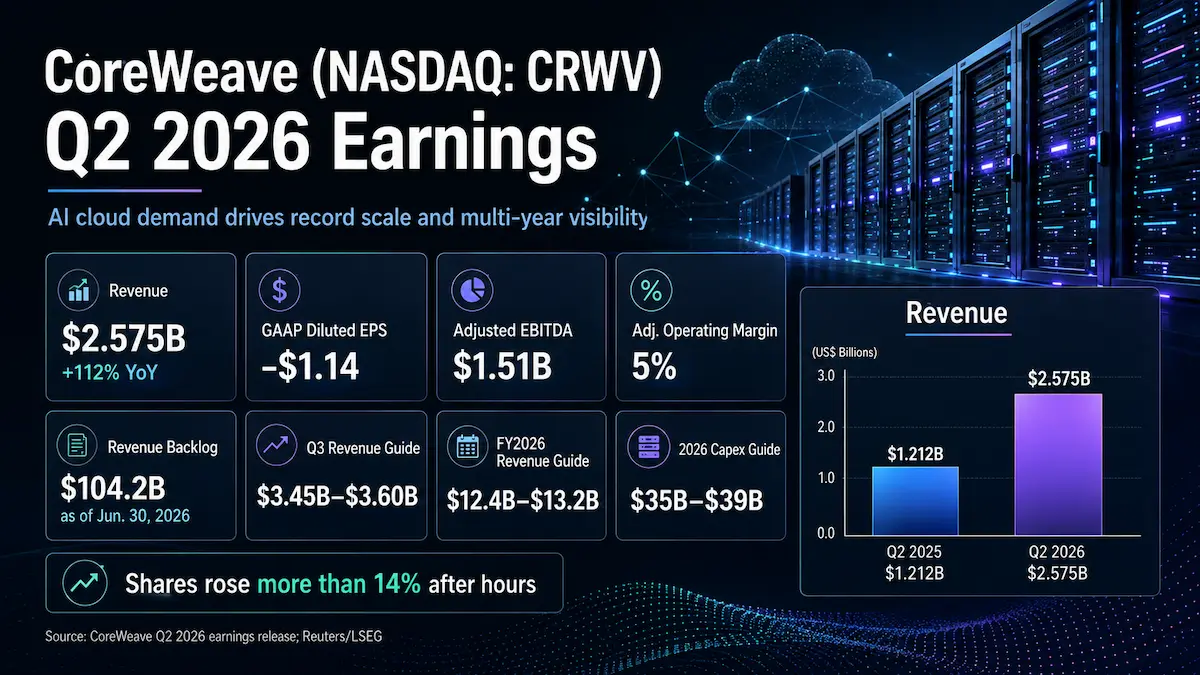
- CoreWeave reported Q2 2026 revenue of $2.575 billion, up 112.5% year over year and 23.9% sequentially, modestly above the $2.56 billion LSEG consensus and near the top of management’s prior $2.45–$2.60 billion range.
- The more important beat was profitability: adjusted operating income reached $128 million, versus a roughly $66 million consensus, while adjusted operating margin rose to 5% from 1% in Q1. GAAP operating margin remained negative at approximately 2% below zero.
- Revenue backlog ended Q2 at $104.2 billion, up 246% year over year, and excludes more than $25 billion of net new customer commitments added in early Q3. More than half of Q2 backlog was already attached to contracts where delivery had begun.
- Management raised FY2026 revenue guidance to $12.4–$13.2 billion and adjusted operating income guidance to $960 million–$1.15 billion, but also lifted capex to $35–$39 billion. The investment case is therefore increasingly about converting exceptional demand visibility into returns on a very large capital base.
- The product mix is beginning to broaden beyond raw GPU capacity: storage, CPU, networking and software exceeded $400 million of ARR, while managed inference booked ARR rose from roughly $1 million to more than $100 million in a matter of months. These are not disclosed GAAP segment revenues and should not be added together as separate revenue buckets.
1. Core Earnings Breakdown
Revenue and Profitability Analysis
CoreWeave’s Q2 2026 revenue was $2.575 billion, compared with $1.212 billion in Q2 2025. That is reported growth of 112.5% year over year, calculated as $2.575 billion divided by $1.212 billion minus one. Revenue also increased 23.9% sequentially from $2.078 billion in Q1 2026. CoreWeave does not disclose an organic, constant-currency or “operational revenue growth” measure, so investors should not manufacture one. The better way to judge operational growth is through deployed power, backlog conversion, pricing, customer expansion and higher-margin service adoption.
- Core AI cloud infrastructure: CoreWeave does not disclose a GAAP revenue split for GPU infrastructure versus software and ancillary services, so an exact segment share cannot be stated responsibly. Operationally, active power reached 1.5 GW after the company added nearly 500 MW in the quarter, and management said near-term capacity remains effectively sold out. Investment judgment: this remains the primary economic engine, but the key question is no longer demand discovery; it is whether deployment speed and financing costs allow CoreWeave to monetize scarce capacity at attractive lifetime returns.
- AI products and services beyond GPUs: management said storage, CPU, networking and software collectively exceeded $400 million of ARR as of Q2. This is an ARR disclosure, not GAAP quarterly revenue, and the company did not provide a year-over-year growth rate for this bucket. Investment judgment: higher-margin attach revenue is strategically important because it can raise wallet share and make CoreWeave less comparable to a commodity GPU lessor.
- Managed inference: booked ARR increased from about $1 million to more than $100 million within a few months of launch, with management targeting at least $250 million of managed inference ARR by year-end 2026. This metric may overlap with the broader non-GPU products and services figure, so the two should not be summed. Investment judgment: inference gives CoreWeave a potential path to monetize both leading-edge GPUs and older fleets through shorter-duration, usage-oriented workloads, which could improve lifetime asset economics if pricing remains firm.
Profitability showed a meaningful split between GAAP and adjusted measures. GAAP operating loss was $49 million, equal to a roughly negative 2% operating margin, versus $19 million of operating income and a positive 2% margin a year ago. GAAP net loss widened to $626 million from $290 million, while diluted net loss per share was $1.14. The main economic drag below the operating line was interest expense of $640 million, more than double the prior-year level.
Adjusted EBITDA was $1.510 billion, up 101% year over year, although adjusted EBITDA margin declined to 59% from 62%. Adjusted operating income was $128 million, down from $200 million a year ago but up sharply from $21 million in Q1 2026. The sequential improvement matters more than the year-over-year decline because Q1 represented the heavy-ramp phase of the current deployment cycle. Adjusted operating margin improved to 5% from 1% sequentially, an approximately 400-basis-point increase calculated from company-reported figures. Adjusted net loss was $567 million, or a negative 22% margin.
The earnings-quality conclusion is therefore mixed but improving. The company is demonstrating real operating leverage before the July pricing changes, yet the gap between adjusted EBITDA and GAAP earnings remains unusually large because depreciation, amortization and interest are economically central to an infrastructure-heavy model rather than peripheral accounting noise.
Expectations vs. Actual Results
- Revenue: $2.575 billion actual versus $2.56 billion LSEG consensus — ✅ Beat by approximately 0.6%.
- Adjusted EPS on the LSEG/Reuters comparison basis: loss of $1.03 versus a loss of $1.20 expected — ✅ Beat by $0.17 per share. CoreWeave’s official release separately reported GAAP diluted net loss per share of $1.14; investors should not treat the adjusted and GAAP EPS figures as interchangeable.
- Adjusted operating income: $128 million actual versus roughly $66 million consensus — ✅ Beat by about 94%. On the same consensus inputs, the implied expected adjusted operating margin was about 2.6% ($66 million divided by $2.56 billion), versus 5.0% actual — ✅ approximately 240 basis points better than the implied expectation. GAAP operating margin was approximately negative 2% and is a different measure.
The real source of the beat was not the top line. Revenue only edged consensus, and it landed inside management’s previous $2.45–$2.60 billion guidance range. The larger surprise came from adjusted operating leverage. Actual adjusted operating income of $128 million exceeded the prior management range of $30–$90 million and was about 42% above the high end. Management attributed the improvement to scale, better contract economics and utilization of a larger installed base, rather than to an unusually large revenue upside.
The market also received a materially stronger forward setup. Q3 revenue guidance is $3.45–$3.60 billion, adjusted operating income is $200–$260 million, interest expense is $860–$940 million and capex is $11.5–$13.5 billion. At the midpoint, Q3 adjusted operating margin would be approximately 6.5%, calculated as $230 million divided by $3.525 billion. Management also said it expects adjusted operating margin to reach the low teens in Q4.
For FY2026, CoreWeave raised revenue guidance to $12.4–$13.2 billion from $12–$13 billion, raised adjusted operating income guidance to $960 million–$1.15 billion from $900 million–$1.10 billion, increased capex guidance to $35–$39 billion from $31–$35 billion, and lifted exiting 2026 annualized run-rate revenue to $18.5–$19.5 billion from $18–$19 billion. The higher capex number would normally pressure a capital-intensive stock, but in this case it arrived alongside higher revenue, higher adjusted operating income, more active power and over $25 billion of incremental early-Q3 customer commitments.
That explains why the market focused more heavily on margin inflection, backlog conversion, pricing and guidance than on the modest revenue beat itself. Reuters reported that CRWV rose more than 14% in after-hours trading after the release. At approximately 11:28 a.m. ET on August 12, 2026, CRWV was trading at about $106.43, up roughly 17.8% from the prior close. The reaction is consistent with investors reading the higher spending plan as demand-backed deployment rather than undisciplined speculative capacity.
Earnings Call Highlights
Management said Q2 customer contracts are expected to carry contribution margins 5–10 percentage points above deals added in recent quarters.
💡 Reading Between the Lines: The most important change in the call was pricing power, not just volume. If those contract-level economics survive component inflation and execution costs, the market can begin underwriting a structurally higher mature return on each new cluster rather than assuming scale merely produces more low-margin revenue.
Management said the non-GPU product stack — storage, CPU, networking and software — already exceeded $400 million of ARR, while July pricing changes increased prices by roughly 25% across SKUs.
💡 Reading Between the Lines: CoreWeave is trying to move from a scarce-compute supplier toward a fuller AI cloud wallet. The July price increase was not embedded in Q2’s margin inflection, which creates potential forward margin support, although some of the increase is also intended to pass through higher component costs.
Management said managed inference booked ARR rose from roughly $1 million to more than $100 million within a few months, with at least $250 million targeted by year-end 2026.
💡 Reading Between the Lines: Inference could become both a growth product and an asset-recycling mechanism. It creates an internal destination for GPUs rolling off long-term contracts, potentially extending useful economic life and reducing the residual-value risk that normally weighs on GPU infrastructure models.
Management said pricing for Blackwell and Vera Rubin SKUs is reaching new highs, while prior-generation GPU pricing remains at or above levels seen years ago and near-term capacity is effectively sold out.
💡 Reading Between the Lines: The current supply-demand imbalance is giving CoreWeave unusual negotiating leverage across multiple GPU generations. The risk is that investors capitalize today’s scarcity pricing too far into the future; the upside is that older GPU fleets may retain value for longer than conventional depreciation assumptions imply.
Management said contracted power had increased to about 4.2 GW after quarter-end, with more than 1.5 GW of additional potential power from powered land, expansion options and letters of intent.
💡 Reading Between the Lines: Power procurement is becoming a strategic moat as much as a capacity metric. CoreWeave’s vertical-integration strategy and self-build program are designed to improve control and long-term margins, but they also deepen capital intensity and expose equity value to permitting, construction and financing execution.
2. Deep Business Insights
Hidden Metrics That Matter
First, the backlog is not only large; a substantial portion sits inside a relatively visible recognition window. The Q2 presentation showed 40% of the $104.2 billion backlog expected within 24 months, 39% in months 25–48 and 21% beyond 48 months. That means approximately $82.3 billion, or 79% of backlog, sits within the first 48 months: $104.2 billion × 79% = $82.3 billion. This is calculated from company-reported figures. More than 50% of Q2 backlog was already attached to contracts where customer delivery had commenced, and management expects that figure to exceed two-thirds by year-end. This matters because a signed backlog that has started converting carries less execution uncertainty than an equivalent headline backlog waiting for power, sites or hardware.
Second, the economic burden beneath adjusted EBITDA is unusually large. Q2 depreciation and amortization was $1.393 billion and net interest expense was $640 million. Combined, that is $2.033 billion, equal to approximately 79.0% of Q2 revenue: ($1.393 billion + $0.640 billion) ÷ $2.575 billion = 79.0%. This is calculated from company-reported figures. The implication is not that adjusted EBITDA is useless; it is that a 59% adjusted EBITDA margin cannot be read like a software-company EBITDA margin. CoreWeave must continuously earn adequate returns on rapidly depreciating infrastructure financed with substantial debt.
Capital intensity reinforces the point. Company-defined Q2 capex was $9.352 billion, or about 363% of quarterly revenue: $9.352 billion ÷ $2.575 billion = 3.63×, calculated from company-reported figures. Operating cash flow was positive $679 million, but cash purchases of property and equipment were $6.422 billion, implying a simple cash expansion proxy of negative $5.743 billion before other investing activity. That proxy is not company-reported free cash flow and should not be confused with company-defined capex, which also captures financed assets and construction-in-progress adjustments.
Why are customers willing to commit at this scale? The answer appears to be a combination of access, performance and integration. CoreWeave has repeatedly been early with new NVIDIA architectures, runs an AI-specific orchestration stack, offers storage, networking, CPU and software around the GPU layer, and increasingly supports the full training-to-inference loop. Management also cited third-party work estimating materially lower total cost of ownership than the average hyperscaler, although investors should treat vendor-cited TCO studies as supporting evidence rather than audited economics. The stronger evidence is customer behavior: sold-out near-term capacity, higher-priced new contracts, repeat expansions and a backlog that continued growing despite the company’s already large base.
Industry Chain Reactions
- ✅ Benefit — NVIDIA (NVDA): CoreWeave’s capex increase, rapid active-power buildout and early Vera Rubin NVL72 validation reinforce the demand signal for high-end AI accelerators and the broader NVIDIA ecosystem. Not every dollar of CoreWeave capex flows to NVIDIA, but a $35–$39 billion annual infrastructure plan from a major AI cloud buyer is directionally supportive for accelerator, networking and related platform demand.
- ❌ Face Pressure — Nebius Group (NBIS): CoreWeave’s scale, improving financing access, large power pipeline and willingness to use shorter-duration contracts raise the competitive bar for other neocloud providers. This does not imply weaker absolute AI demand for Nebius; the pressure is more likely to appear in customer acquisition, speed-to-capacity, financing terms and the premium required to differentiate on software and service quality rather than GPU availability alone.
Valuation Framework and Key Risks
At approximately $106.43 per share on August 12, 2026, CRWV’s equity market capitalization was about $56.1 billion. Using June 30 balance-sheet debt of roughly $35.1 billion and subtracting approximately $5.54 billion of cash and marketable securities while excluding restricted cash, a simplified enterprise-value proxy is about $85.6 billion. This calculation also excludes operating lease liabilities, so it should be viewed as a practical market-value framework rather than a formal accounting EV.
Against the midpoint of FY2026 revenue guidance, $12.8 billion, that enterprise-value proxy implies roughly 6.7× EV/revenue. Against the midpoint of exiting 2026 annualized run-rate revenue, $19.0 billion, it implies about 4.5× EV/exiting ARR. The second multiple should be handled carefully because CoreWeave defines annualized run-rate revenue as the final month of the quarter multiplied by 12; it is not the same as contracted SaaS ARR and does not carry the same margin, churn or cash-conversion characteristics.
The current valuation therefore embeds more than continued triple-digit near-term growth. It also embeds a belief that backlog converts on schedule, recent contribution-margin improvements persist, older GPU fleets retain economic value, inference and software attach become meaningful, and financing costs continue falling relative to the return on new infrastructure. If those conditions hold, today’s revenue multiple can compress rapidly as the denominator expands. If they do not, the large debt load and capex program can magnify downside to equity value.
- Capital intensity and refinancing risk: FY2026 capex guidance of $35–$39 billion is nearly three times the midpoint of revenue guidance. CoreWeave relies on debt, customer prepayments, equity and other capital sources to fund buildouts before contracted revenue arrives.
- Interest burden: Q3 interest expense is guided to $860–$940 million. Even with improving weighted-average funding costs, absolute interest expense can rise because the debt base is expanding faster than the cost of capital is falling.
- GPU residual-value and pricing risk: current data show strong pricing even for older architectures, but a normalization in supply or a rapid workload shift could reduce recontracting economics. Managed inference may mitigate this risk, but it is still early.
- Power, permitting and construction execution: contracted power is a moat only if it can be delivered on time. Delays can create depreciation, lease or financing costs before revenue begins.
- Customer concentration and contract timing: the Q2 release emphasized broader enterprise adoption, but the economics still depend on a limited number of very large AI buyers. The exact latest concentration should be taken from the company’s applicable SEC filing rather than inferred from press-release customer names.
- Adjusted-versus-GAAP interpretation: adjusted operating income removes stock-based compensation, acquisition-related costs and acquired-intangible amortization, while adjusted EBITDA additionally removes depreciation and amortization, interest, taxes and other items. Investors should not use the 59% adjusted EBITDA margin as a direct proxy for free cash flow or economic profit.
The central valuation debate is therefore not whether AI infrastructure demand is strong; Q2 makes that difficult to dispute. The debate is whether CoreWeave can convert scarcity, scale and software attach into returns that remain comfortably above its cost of capital after depreciation, interest and recurring reinvestment. Q2 moved that debate in a positive direction because adjusted operating margin inflected while contract economics improved, but the much larger capex plan ensures that execution risk remains inseparable from the growth thesis.
3. Key FAQs
Did CoreWeave beat Q2 2026 earnings estimates?
Yes, on the main Wall Street comparison metrics. Revenue of $2.575 billion was modestly above the $2.56 billion LSEG consensus. Reuters reported an adjusted per-share loss of $1.03 versus a $1.20 expected loss, while the company’s official GAAP diluted net loss per share was $1.14. The biggest surprise was adjusted operating income of $128 million versus roughly $66 million consensus, which translated into a 5% adjusted operating margin versus an implied expectation near 2.6%.
Why did CRWV stock rise after Q2 2026 earnings?
The stock reaction was driven less by the small revenue beat than by a better combination of margin, backlog, pricing and guidance. Adjusted operating income materially exceeded both consensus and the company’s prior range, more than $25 billion of new commitments were added in early Q3, and management raised full-year revenue and adjusted operating income guidance. The higher capex outlook was interpreted as being tied to contracted demand and accelerated customer deliveries rather than speculative capacity.
What is CoreWeave’s 2026 revenue guidance after Q2 2026?
CoreWeave now expects FY2026 revenue of $12.4–$13.2 billion, up from its prior $12–$13 billion range. It also expects FY2026 adjusted operating income of $960 million–$1.15 billion, capex of $35–$39 billion and exiting 2026 annualized run-rate revenue of $18.5–$19.5 billion. For Q3 2026, revenue guidance is $3.45–$3.60 billion with adjusted operating income of $200–$260 million.
Primary sources: CoreWeave Investor Relations Q2 2026 results, official Q2 2026 earnings call transcript, official Q2 and FY2026 outlook presentation, and Reuters/LSEG consensus and market-reaction coverage. For the company’s current filing archive and future updates, see CoreWeave Investor Relations.
Disclaimer: This article/chart is for educational and informational purposes only and does not constitute investment advice of any kind. Past performance is not indicative of future results. Investors should independently evaluate their own risks.