Key Takeaways
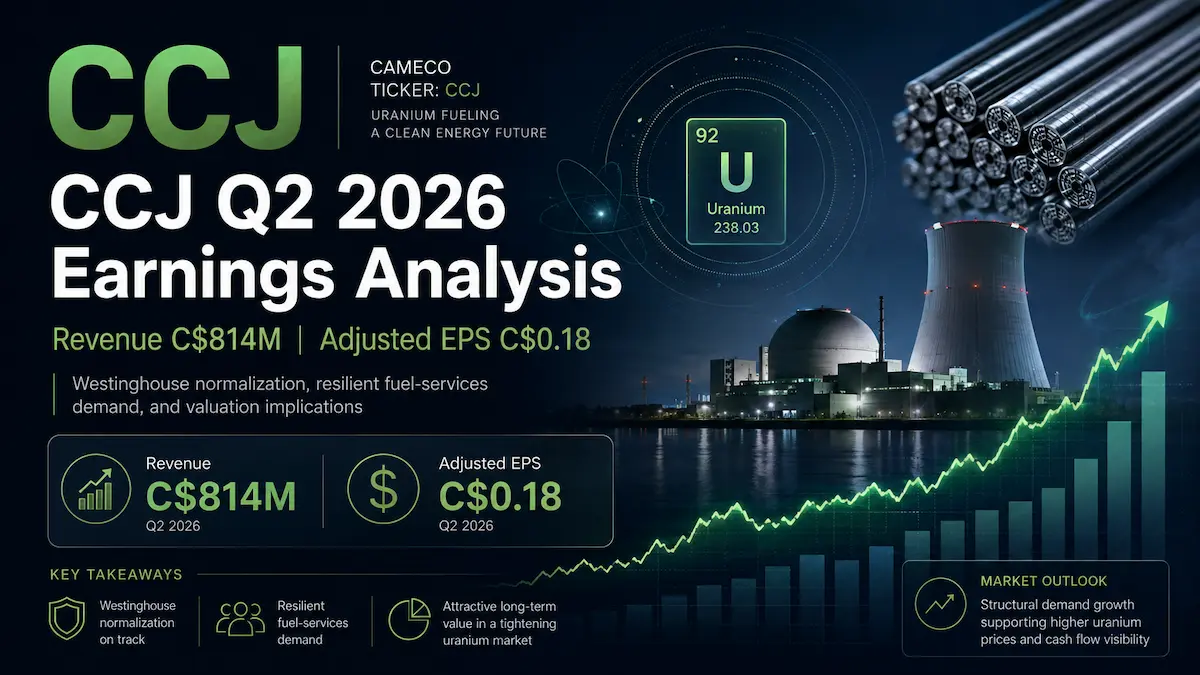
- Cameco reported Q2 2026 revenue of C$814 million and adjusted diluted EPS of C$0.18, modestly missing FactSet revenue consensus and falling well short of adjusted EPS expectations.
- The headline decline was not a clean read on underlying demand: uranium realized pricing rose 15% in Canadian-dollar terms, while lower delivery volumes, higher unit costs and an unusually difficult Westinghouse comparison drove the earnings contraction.
- Management raised 2026 consolidated revenue guidance to C$3.32 billion–C$3.57 billion and lifted the uranium realized-price range to C$91–C$96 per pound, while maintaining uranium production guidance of 19.5–21.5 million pounds.
- Westinghouse’s pipeline of up to 91 AP1000 reactors expands Cameco’s long-duration growth option, but investors should distinguish a commercial pipeline from contracted backlog and discount the timing, financing and execution risk.
- At approximately US$93.09 per share on August 4, 2026, CCJ’s valuation already embeds substantial uranium repricing and Westinghouse execution, leaving less tolerance for project delays or margin slippage.
Data cut: August 5, 2026. Unless otherwise stated, financial figures are in Canadian dollars. Cameco reports under International Financial Reporting Standards, not US GAAP. Accordingly, “reported” figures in this analysis are IFRS figures, while adjusted net earnings, adjusted EPS and adjusted EBITDA are company-defined non-IFRS measures.
Part 1: Core Earnings Breakdown
Revenue and Profitability Analysis
Cameco generated Q2 2026 consolidated revenue of C$814 million, down 7% from C$877 million in Q2 2025. Reported gross profit declined 26% to C$190 million, taking the IFRS gross margin to 23.4% from 29.3%. Reported net earnings fell to C$25 million, or C$0.06 per diluted share, from C$321 million, or C$0.74 per share. Adjusted net earnings were C$77 million, or C$0.18 per diluted share, compared with C$308 million, or C$0.71 per share. Adjusted EBITDA declined to C$391 million from C$673 million.
The magnitude of the year-over-year earnings decline overstates the deterioration in Cameco’s operating franchise. Q2 2025 included approximately US$170 million in Cameco’s share of Westinghouse revenue and adjusted EBITDA from Westinghouse’s participation in the two-reactor Dukovany project. That non-recurring comparison, combined with lower uranium deliveries and higher cost of sales, explains why reported and adjusted earnings fell much faster than consolidated revenue.
- Uranium: Revenue was C$659 million, down 7% year over year, and represented 80.9% of consolidated revenue, calculated from company-reported segment figures. Sales volume declined 18% to 7.1 million pounds, but the Canadian-dollar realized price rose 15% to C$93.13 per pound. Uranium gross profit fell 27% to C$158 million and the segment gross margin compressed to 24% from 31%, as unit cost of sales increased 26% to C$70.81 per pound. Investment judgment: uranium demand and pricing power remained intact, but Q2 exposed the earnings sensitivity created by delivery timing, annual maintenance and purchased material when physical production does not fully cover sales requirements.
- Fuel Services: Revenue was C$152 million, down 6% year over year, and represented 18.7% of consolidated revenue. Production was 3.0 million kgU, while full-year production guidance remained 13–14 million kgU. Investment judgment: Fuel Services is smaller than uranium but strategically important because conversion and fabrication capacity are difficult to replicate; near-term quarterly volatility should not obscure the segment’s value in a security-of-supply market.
- Westinghouse: Cameco’s share of Westinghouse adjusted EBITDA was C$163 million versus C$352 million a year earlier, while its share of reported net income moved to a C$10 million loss from C$126 million of earnings. Westinghouse revenue is not included in Cameco’s consolidated top line because the investment is equity-accounted. Investment judgment: the business is increasingly central to CCJ’s valuation, but its quarterly contribution will remain less linear than a conventional consolidated industrial segment, especially as project milestones and mix shift between Operating Plants, Fuel Services and New Plants.
The cleanest distinction is between reported growth and operational momentum. Reported revenue declined 7%, reported IFRS EPS declined 92%, and adjusted EPS declined 75%. Operationally, however, the uranium realized price rose 15% in Canadian dollars and 18% in US dollars, full-year production guidance was maintained despite temporary disruptions, and management raised its full-year revenue and realized-price outlook. The quarter was therefore weak on delivered earnings but constructive on the forward pricing architecture.
Expectations vs. Actual Results
Metric | Q2 2026 Actual | Verified Expectation or Prior Guide | Result |
|---|---|---|---|
Revenue | C$814.0 million | C$823.3 million FactSet consensus | ❌ Miss by C$9.3 million, or approximately 1.1% |
Adjusted diluted EPS | C$0.18 | C$0.36 FactSet consensus | ❌ Miss by C$0.18, or 50% |
Reported diluted EPS | C$0.06 under IFRS | No verified public consensus on a directly comparable IFRS basis | — |
Reported gross margin | 23.4% | No verified public consensus; 29.3% in Q2 2025 | ❌ Down approximately 5.9 percentage points year over year |
2026 consolidated revenue guidance | C$3.32 billion–C$3.57 billion | Prior: C$3.13 billion–C$3.37 billion | ✅ Raised by C$195 million at the midpoint |
2026 uranium realized-price guidance | C$91–C$96 per pound | Prior: C$85–C$89 per pound | ✅ Raised |
2026 uranium production guidance | 19.5–21.5 million pounds | Prior: 19.5–21.5 million pounds | ✅ Reaffirmed |
2026 uranium unit cost of sales | C$63.00–C$67.50 per pound | Prior: C$61.50–C$65.00 per pound | ❌ Raised cost range, mainly due to foreign exchange on purchases |
Q3 2026 revenue and EPS guidance | Not issued | Cameco provides annual rather than standalone quarterly guidance | — |
The consensus comparison above uses one internally consistent Canadian-dollar FactSet snapshot: C$823.3 million of revenue and C$0.36 of adjusted EPS. Reuters/I/B/E/S separately cited a C$0.38 adjusted EPS estimate. The difference between providers does not change the conclusion: revenue was close to expectations, but adjusted EPS was materially below the Street.
The miss was primarily an earnings-quality and mix issue rather than a top-line demand shock. Uranium volume fell 18%, more than offsetting the 15% increase in Canadian-dollar realized pricing. Unit cost of sales rose 26%, reflecting lower production, annual maintenance, higher purchased volumes and a product-loan revaluation. Westinghouse then added a severe comparison problem because Q2 2025 benefited from the Dukovany project contribution.
For the market, the most important hierarchy was not simply revenue, then EPS. Investors appeared to place more weight on the raised full-year revenue and uranium pricing ranges, unchanged production guidance, disciplined contracting and the expanded disclosure around the Westinghouse reactor pipeline. The stock rose approximately 4.3% in premarket trading to US$92.02 despite the earnings miss. That positive divergence indicates that the market treated Q2 EPS as a low-quality signal of normalized earnings and instead capitalized the forward uranium price deck and Westinghouse optionality.
The reaction was not a conventional “sell the news” setup in reverse. The earnings miss was visible, but management provided evidence that the weaker quarter was driven by delivery timing, a prior-year project milestone and foreign-exchange effects rather than a breakdown in pricing or annual production. The valuation caveat is that a positive reaction to a miss also shows how much of CCJ’s price is now supported by long-duration expectations rather than current-period cash earnings.
Earnings Call Highlights
- “The uranium market has not yet returned to replacement-rate contracting, even with long-term prices in the mid-US$90s.” 💡 Reading Between the Lines: Management believes utilities still need to contract substantially more material to cover future consumption. That supports a patient sales strategy, but it also means the bull case depends on contracting volume eventually converting from market discussion into binding commitments.
- “Newer market-related uranium contracts are carrying floors in the high US$70s and ceilings around US$160, both escalated.” 💡 Reading Between the Lines: Cameco is building downside protection without surrendering exposure to a tighter market. For valuation models, the contract structure matters more than spot-price headlines because it can raise the floor under future realized pricing while preserving convexity.
- “The next milestone for the US Department of Energy’s US$17.5 billion conditional financing program is definitive agreements involving utilities, Westinghouse and the DOE.” 💡 Reading Between the Lines: The government support is meaningful but not equivalent to a final order. Investors should apply probability weights to the 91-reactor pipeline and increase those weights only as projects move into definitive commercial, financing and regulatory agreements.
- “The higher uranium cost guidance is mainly an exchange-rate effect on purchases, not a new inflation shock.” 💡 Reading Between the Lines: This reduces concern that mine-site cost inflation has structurally damaged unit economics. However, it does not remove the margin risk created by reliance on purchased pounds when Cameco’s own production and delivery schedules are mismatched.
- “Westinghouse estimates a 40%–45% share of AP1000 project value and a normalized adjusted EBITDA margin of about 20% on that scope.” 💡 Reading Between the Lines: Management is giving investors enough information to build a probability-weighted reactor deployment model, but the economics are illustrative rather than booked. The valuation impact should be staged by project maturity, not applied to all 91 opportunities as if they were backlog.
Part 2: Deep Business Insights
Hidden Metrics That Matter
1. Market-related revenue exposure increased even as reported revenue declined. Market-related contract revenue was C$518.1 million out of C$813.8 million of consolidated revenue, equal to 63.7%. The calculation is C$518.1 million ÷ C$813.8 million = 63.7%, calculated from company-reported figures. In Q2 2025, the comparable ratio was C$502.4 million ÷ C$877.0 million = 57.3%. The mix therefore increased by approximately 6.4 percentage points.
This is strategically important because Cameco’s customers are not merely buying commodity exposure. Utilities value verified production, conversion capability, inventory, geopolitical reliability and a supplier that can commit across multiple stages of the nuclear fuel cycle. The higher market-related mix suggests that more revenue is participating in the strengthening uranium price environment, while contract floors and ceilings limit the binary risk of relying entirely on spot pricing.
2. Equity accounting hides the scale of Westinghouse from consolidated revenue. Westinghouse generated C$863.2 million of Q2 segment revenue attributable to Cameco’s reporting presentation, but that revenue was eliminated from Cameco’s consolidated top line under equity accounting. As a result, Cameco reported C$813.8 million of consolidated revenue even though the economic exposure represented by the uranium, fuel-services and Westinghouse platforms was much broader.
This accounting structure can lead to two analytical errors. First, a simple price-to-sales multiple overstates CCJ’s valuation because the denominator excludes Westinghouse revenue. Second, dividing consolidated adjusted EBITDA by consolidated revenue produces a misleading 48.0% “margin”: C$391 million ÷ C$813.8 million = 48.0%, calculated from company-reported figures. The numerator includes Cameco’s share of Westinghouse adjusted EBITDA, while the denominator excludes Westinghouse revenue. Investors should value uranium and Fuel Services on their segment economics and Westinghouse separately using its equity-accounted earnings, backlog and probability-weighted growth pipeline.
Customer preference is therefore rooted in system credibility rather than lowest quoted price. Cameco combines tier-one uranium assets in stable jurisdictions, conversion and fuel-service capacity, inventories, long-term contracting expertise and a 49% interest in a reactor technology and services platform. Management’s refusal to discount unproven future supply into long-term contracts is commercially rational because nuclear utilities place a high cost on delivery failure and fuel-cycle disruption.
Industry Chain Reactions
- ✅ Benefit — BWX Technologies (NYSE: BWXT): BWXT Canada and Westinghouse have an agreement to explore supply of major components for AP1000 and AP300 deployments, including reactor and pressure-vessel-related equipment. A higher probability of fleet-scale AP1000 deployment would expand the addressable nuclear component opportunity for BWXT. This is a supply-chain read-through, not direct guidance from Cameco.
- ❌ Face Pressure — GE Vernova (NYSE: GEV): Westinghouse’s AP300 is a 300-MW-class competitor to GE Vernova Hitachi’s BWRX-300 in some future SMR procurements. Cameco’s disclosure that AP300 can leverage AP1000 design and supply-chain work increases competitive intensity. The near-term pressure should not be overstated: the BWRX-300 is already under construction at Darlington and has meaningful regulatory and customer momentum, while AP300 still requires design completion and customer conversion.
The broader chain reaction is favorable for proven nuclear vendors and less favorable for development-stage companies whose economic claims depend on first-of-a-kind execution. Utilities are increasingly differentiating between licensed technology, an operating fleet, an established supply chain and conceptual capacity. Cameco and Westinghouse benefit from that credibility filter, although the same history that establishes credibility also reminds investors that large-reactor schedules and budgets can be difficult to control.
Valuation Framework and Key Risks
CCJ traded at approximately US$93.09 on August 4, 2026, with an equity market value of about US$40.46 billion. Using Cameco’s updated 2026 US-dollar exchange-rate assumption of C$1.35 per US dollar, that is approximately C$54.6 billion of equity value. Cameco had roughly C$1.1 billion of cash and C$1.0 billion of debt at quarter-end, so enterprise value is close to equity value.
A simple trailing adjusted earnings framework illustrates how much growth is already capitalized. Adjusted net earnings for Q3 2025, Q4 2025, Q1 2026 and Q2 2026 were C$32 million, C$217 million, C$204 million and C$77 million, respectively, totaling C$530 million. C$54.6 billion ÷ C$0.53 billion equals approximately 103 times trailing adjusted earnings, calculated from company-reported figures and the current market capitalization. This multiple should not be used mechanically because quarterly Westinghouse earnings are milestone-driven and the uranium contract book is repricing. It nevertheless establishes a demanding starting point.
A more appropriate buy-side framework separates CCJ into three assets:
- Uranium and Fuel Services: Value these businesses on normalized volume, realized contract pricing, owned-production cost and purchased-pound exposure. The major upside driver is the pace at which legacy contracts roll into higher floors, ceilings and escalators. The major risk is that production variability or purchased material absorbs more of the price uplift than the market expects.
- Westinghouse core operations: Apply a multiple to normalized equity-accounted EBITDA from the installed-base, fuel and services businesses. These activities are more recurring than New Plants, but still have maintenance, outage and project timing effects.
- Westinghouse New Plants and IPO optionality: Use a probability-weighted net present value for AP1000, AP300 and eVinci opportunities. The 91-reactor AP1000 figure is a pipeline, not backlog. Separately, Westinghouse’s confidential submission for a proposed IPO can improve price discovery and capital flexibility, but the transaction’s timing, valuation, ownership dilution and proceeds allocation were not yet determined.
The principal valuation risks are execution, duration and expectation risk. AP1000 projects require utility commitments, government financing, regulatory approvals and multi-year construction. Management’s illustrative near-term two-unit capital cost is US$20 billion–US$26 billion, with first-unit delivery in roughly nine to ten years and the second unit in ten to eleven years. Even if Westinghouse captures 40%–45% of project value at a normalized 20% adjusted EBITDA margin, cash flows arrive over long periods and are sensitive to schedule control.
Uranium risk is different but equally important. Cameco purchased 2.8 million pounds in Q2 versus 3.9 million pounds of attributable production. Purchases therefore represented 41.8% of the quarter’s combined produced-and-purchased sourcing volume: 2.8 ÷ (2.8 + 3.9) = 41.8%, calculated from company-reported figures. Purchased uranium averaged C$91.40 per pound, close to the C$93.13 realized selling price, although those pounds are not necessarily matched to the same deliveries. The comparison shows why owned production, inventory accounting and delivery scheduling matter as much as the uranium price.
The investment implication is balanced. Q2 strengthened the case that Cameco has pricing power and strategic scarcity value, but the current share price discounts more than a cyclical recovery in uranium. It also discounts successful contract repricing, reliable production, Westinghouse core growth and a meaningful probability of new-reactor conversion. The stock can still compound if those outcomes materialize, but the valuation offers limited protection against project deferrals, operational disruptions, a slower utility contracting cycle or weaker-than-assumed Westinghouse margins.
Part 3: Key FAQs
Did CCJ beat Q2 2026 earnings estimates?
No. Cameco reported C$814 million of revenue versus a C$823.3 million FactSet estimate and adjusted diluted EPS of C$0.18 versus C$0.36. Reuters/I/B/E/S cited a slightly higher C$0.38 EPS expectation. The revenue miss was modest, but the adjusted EPS miss was material. Reported IFRS EPS was C$0.06; Cameco does not report US-GAAP EPS.
Why did Cameco stock rise after the Q2 2026 earnings miss?
The market looked beyond the weak quarterly EPS comparison. Cameco raised its 2026 consolidated revenue and uranium realized-price guidance, maintained uranium production guidance, described stronger market-related contract economics and provided expanded disclosure for Westinghouse’s AP1000 pipeline. Shares rose approximately 4.3% in premarket trading even though both revenue and adjusted EPS missed the FactSet snapshot.
What is Cameco’s 2026 guidance after Q2 earnings?
Cameco expects 2026 consolidated revenue of C$3.32 billion–C$3.57 billion, uranium revenue of C$2.70 billion–C$2.91 billion and Fuel Services revenue of C$610 million–C$650 million. The company expects a uranium realized price of C$91–C$96 per pound, uranium production of 19.5–21.5 million pounds, uranium sales of 29–32 million pounds and Fuel Services production of 13–14 million kgU. Cameco did not issue standalone Q3 revenue or EPS guidance.
Primary company source: Cameco’s official Q2 2026 quarterly report and Investor Relations materials. Supporting sources include the official Q2 results release, the official Q2 MD&A and financial statements, the official conference-call replay page, and a publicly available Q2 call transcript. Cameco’s IR page had not posted a downloadable official Q2 transcript as of August 5, 2026; management remarks in this article were checked against the official replay and presentation materials and cross-referenced to published transcripts.
Disclaimer: This article/chart is for educational and informational purposes only and does not constitute investment advice of any kind. Past performance is not indicative of future results. Investors should independently evaluate their own risks.