Key Takeaways
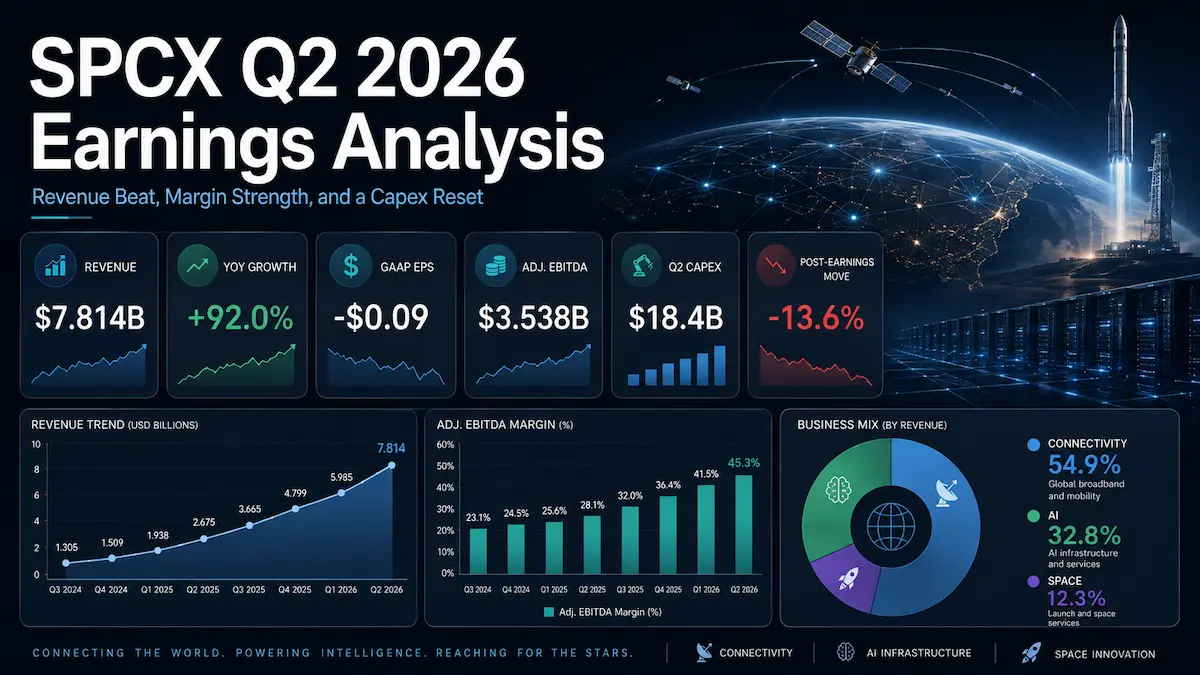
- SpaceX reported Q2 revenue of $7.814 billion, up 92% year over year, and a GAAP loss of $0.09 per share. Revenue beat the Reuters-reported consensus by roughly 15%, while the per-share loss was materially narrower than expected.
- Connectivity remained the economic engine: revenue rose 66% to $4.291 billion and GAAP operating margin expanded to 38.6%. AI supplied nearly half of the company’s incremental revenue, but still produced a $1.257 billion GAAP operating loss.
- Adjusted EBITDA reached $3.538 billion, yet the quality of that figure requires scrutiny because depreciation and amortization plus stock-based compensation equaled 47.1% of revenue, calculated from company-reported figures.
- Q2 capex reached $18.369 billion, 86.2% of which went to AI. Management said Q3 and Q4 capex should be similar, implying approximately $65.2 billion of full-year 2026 capex, calculated from company-reported figures and management’s qualitative outlook.
- The 13.6% post-earnings share-price decline was not a rejection of the revenue beat. It reflected a higher capital-intensity regime, an imminent share unlock, pending Cursor dilution and a valuation that still embeds exceptional execution.
1. Core Earnings Breakdown
Revenue and Profitability Analysis
SpaceX delivered $7.814 billion of Q2 2026 revenue, up 92.0% from $4.071 billion a year earlier and 66.5% from Q1 2026. This is reported growth. The company did not provide an organic, constant-currency or acquisition-adjusted growth bridge, so the 92% figure should not be described as operational or organic growth.
The more important change was the revenue mix. AI increased from 18.1% of company revenue in Q2 2025 to 32.8% in Q2 2026, while Connectivity declined from 63.6% to 54.9% of the mix despite growing rapidly. Of the $3.743 billion year-over-year revenue increase, AI contributed 48.7%, Connectivity contributed 45.5% and Space contributed 5.8%, calculated from company-reported figures. SpaceX is no longer adequately modeled as a launch company with a broadband subsidiary; it is becoming a combined connectivity, compute and infrastructure platform whose capital needs resemble a hyperscaler more than a traditional aerospace contractor.
- Space revenue was $962 million, up 29.0% year over year and representing 12.3% of total revenue. Launch services revenue rose to $648 million, while launch and development revenue reached $314 million. The segment posted a $542 million GAAP operating loss, equivalent to a negative 56.3% operating margin, as Starship research and development alone pushed segment R&D to $1.076 billion. Investment judgment: Space is currently an enabling technology platform and a long-duration real option, not the group’s earnings anchor.
- Connectivity revenue was $4.291 billion, up 65.8% and representing 54.9% of total revenue. Consumer revenue increased 44% to $2.485 billion, while Enterprise & Government revenue more than doubled to $1.806 billion. Starlink subscribers reached 12.0 million, up 101.2%, while blended monthly ARPU fell 22.4% year over year to $66 and remained flat sequentially. GAAP operating income rose 79.4% to $1.656 billion, lifting operating margin to 38.6% from 35.7%. Investment judgment: subscriber scale is absorbing international ARPU dilution, while enterprise and government contracts are improving revenue quality and margin resilience.
- AI revenue was $2.561 billion, up 247.5% and representing 32.8% of total revenue. AI solutions and infrastructure revenue reached $2.194 billion, while advertising revenue declined 13.8% year over year to $367 million. New cloud service agreements generated $1.6 billion of incremental AI infrastructure revenue in the quarter. The segment remained GAAP loss-making, with a $1.257 billion operating loss and a negative 49.1% operating margin, but it produced $1.146 billion of adjusted EBITDA. Investment judgment: SpaceX has rapidly created a compute-leasing business, but the gap between GAAP losses and adjusted profitability makes utilization, depreciation and replacement capex central to the thesis.
At the consolidated level, GAAP gross margin expanded to 55.3% from 43.9%, calculated from company-reported figures. GAAP operating margin improved by roughly 22 percentage points to negative 1.8% from negative 23.8%, while net margin improved to negative 6.9% from negative 24.8%. Adjusted EBITDA margin reached 45.3%, compared with 29.8% a year earlier. The direction is favorable, but GAAP and adjusted outcomes tell materially different stories: the business is approaching consolidated operating breakeven, while the adjusted presentation already resembles a highly profitable infrastructure platform.
Expectations vs. Actual Results
Metric | Q2 2026 Actual | Market Expectation | Result | Investment Read |
|---|---|---|---|---|
Total revenue | $7.814 billion | Approximately $6.82 billion | ✅ Beat by about $994 million, or 14.6% | The upside came primarily from AI cloud revenue and strong Enterprise & Government connectivity revenue. |
GAAP EPS | -$0.09 | Reuters-reported consensus of -$0.26 | ✅ Beat by $0.17 per share | The net loss improved, but a larger weighted-average share count also mechanically reduced the loss per share. |
Consolidated GAAP operating margin | -1.8% | No standardized public consensus was verifiable | Not comparable | The company came close to operating breakeven, but public previews focused more heavily on adjusted EBITDA and segment margins. |
Connectivity GAAP operating margin | 38.6% | Visible Alpha expectation of 35.9% | ✅ Beat by about 2.7 percentage points | This was the highest-quality part of the quarter because the margin expansion was reported on a GAAP segment basis. |
Total capex | $18.369 billion | Approximately $13.09 billion | ❌ About 40% above expectation | This adverse surprise outweighed the income-statement beat because it reset free-cash-flow assumptions. |
Q3 2026 guidance | No formal revenue, EPS or operating-margin range | Not applicable | ⚠️ Mixed outlook | Management indicated Q3 and Q4 capex should be similar to Q2, over 2 GW of compute should be online by year-end, and $6.7 billion of additional cloud contracts should begin ramping in October. |
Consensus estimates vary by provider and timestamp. The comparison above uses the Reuters-reported revenue and EPS consensus, a Visible Alpha operating-margin estimate for Connectivity, and the widely reported pre-earnings capex estimate. No reliable public consensus for consolidated GAAP operating margin was identified, so one is not inferred.
The revenue beat was real rather than accounting noise. AI solutions and infrastructure revenue increased by $1.883 billion year over year, and new cloud arrangements supplied $1.6 billion of incremental quarterly revenue. Connectivity also exceeded a simple consumer-subscriber narrative: Enterprise & Government revenue increased by $939 million year over year, more than the $764 million increase in consumer revenue. That mix matters because enterprise and government contracts can be larger, stickier and less dependent on consumer ARPU.
The EPS beat requires more nuance. GAAP net loss improved 46.3% to $541 million, but weighted-average shares used in the per-share calculation doubled to 5.864 billion from 2.929 billion. In a loss-making quarter, a larger denominator makes the loss per share look smaller. The underlying improvement was still substantial, but the 74% improvement in EPS was stronger than the 46% improvement in net loss.
The market cared more about capex, cash conversion and the durability of the AI contracts than the headline EPS figure. Q2 capex exceeded revenue by more than two times, and management’s indication that the next two quarters should be similar transformed what could have been treated as a one-quarter buildout spike into a sustained capital-allocation commitment. The $14.1 billion of signed cloud contracted sales and the additional $6.7 billion signed in early Q3 support demand visibility, but investors still need evidence that high pricing, utilization and sub-one-year paybacks survive a broader supply response.
SPCX rose 9.4% in the regular session before the report, fell roughly 7% after hours, and then declined 13.6% to $108.27 in the following session. The divergence between the earnings beat and the stock reaction was rational. The report raised the revenue trajectory but also raised the amount of capital required to achieve it. The selloff also occurred immediately before a large post-IPO share unlock, while the pending $60 billion all-stock Cursor acquisition introduces additional dilution. This was not adequately explained by the phrase “sell the news.” It was a repricing of capital intensity, supply of shares and execution risk at a still-premium valuation.
Earnings Call Highlights
- Management said Q3 and Q4 capex should be similar to Q2’s $18.4 billion level, while AI compute deployments are currently generating paybacks of less than one year. 💡 Reading Between the Lines: The qualitative guidance implies approximately $65.2 billion of 2026 capex, calculated from company-reported figures. The payback claim is powerful, but the model must test contract duration, customer concentration, utilization, pricing and the risk that new industry capacity compresses returns.
- SpaceX signed an additional $6.7 billion of cloud-services revenue for a six-month period beginning in October and expects to exceed a $100 billion annualized revenue run rate in December. 💡 Reading Between the Lines: The December figure is a run-rate target, not a GAAP full-year revenue forecast. It implies a steep second-half ramp led by compute contracts and should not be valued like low-capex software ARR without evidence of renewal economics and sustainable margins.
- Management expects Starlink Enterprise & Government revenue eventually to exceed consumer revenue and said the company has never lost an enterprise customer. 💡 Reading Between the Lines: The strategic objective is to move Starlink from a consumer broadband service toward primary infrastructure for airlines, maritime users and governments. That could reduce sensitivity to consumer ARPU, but it also raises procurement-cycle, customer-concentration and geopolitical exposure.
- Starlink V3 is expected to deliver more than ten times the capability of V2, but management said roughly 1,000 V3 satellites may be required before customers see a material service improvement, potentially around Q2 2027. 💡 Reading Between the Lines: The economic step-change is not immediate. The Starlink capacity thesis depends on Starship reaching operational cadence, receiving regulatory approvals and deploying sufficient V3 density before monetization accelerates.
- SpaceX plans to build future AI capacity exclusively on NVIDIA architecture, expects more than 2 GW of compute by year-end 2026, and sees 2027 capacity closer to 10 GW than 5 GW. 💡 Reading Between the Lines: NVIDIA gains a large and rapidly scaling customer, while SpaceX accepts meaningful vendor and supply-allocation concentration. The strategy maximizes deployment speed but reduces architecture diversification and could weaken purchasing leverage.
2. Deep Business Insights
Hidden Metrics That Matter
The first overlooked metric is the size of the bridge from GAAP results to adjusted EBITDA. Depreciation and amortization of $2.848 billion plus stock-based compensation of $831 million equaled $3.679 billion, or 47.1% of revenue: ($2.848 billion + $0.831 billion) ÷ $7.814 billion. This is calculated from company-reported figures. At the AI segment alone, depreciation and amortization plus stock-based compensation equaled $2.401 billion, or 93.8% of AI revenue: ($1.885 billion + $0.516 billion) ÷ $2.561 billion. This is calculated from company-reported figures.
Those expenses are noncash in the current period, but they are not economically irrelevant. Depreciation reflects the consumption of assets created by an extraordinary capex program, while stock-based compensation transfers value to employees and expands the fully diluted share base. AI adjusted EBITDA of $1.146 billion therefore demonstrates strong near-term monetization of installed compute, but it does not establish that AI has reached durable economic profitability.
The second hidden metric is the company’s capital-intensity regime. AI capex was $15.828 billion, or 86.2% of total Q2 capex: $15.828 billion ÷ $18.369 billion. Total capex was 235.1% of quarterly revenue: $18.369 billion ÷ $7.814 billion. Both ratios are calculated from company-reported figures. For the first half, a simple free-cash-flow proxy was negative $25.010 billion: $3.466 billion of operating cash flow minus $28.476 billion of capex. This is calculated from company-reported figures and is not a company-defined non-GAAP measure.
The investment case depends on why customers choose SpaceX despite this capital burden. The company controls more of the delivery stack than most competitors: launch, satellites, spectrum, ground infrastructure, connectivity software, data-center construction and AI models. That integration can compress deployment timelines and internal transfer costs. A cloud customer receives scarce compute capacity that SpaceX says it can bring online quickly; an airline or government customer receives a network backed by more than 10,000 satellites, vertically integrated launch capability and expanding spectrum rights. The distinctive advantage is not any single product. It is the ability to build, launch, operate and monetize infrastructure without waiting for several external suppliers to coordinate.
Industry Chain Reactions
- ✅ Benefit — NVIDIA (NASDAQ: NVDA): SpaceX said future AI capacity will be built exclusively on NVIDIA architecture and indicated that it expects a significant allocation of next-generation GPUs. A move from 1.4 GW of nameplate compute to more than 2 GW by year-end, followed by a much larger 2027 target, supports accelerator, networking and systems demand. The caveat is that NVIDIA must deliver supply into a customer whose deployment schedule is unusually aggressive.
- ❌ Face Pressure — Viasat (NASDAQ: VSAT): Starlink’s acceleration in aviation, maritime and government markets directly challenges Viasat’s higher-value connectivity franchises. SpaceX added major airline deployments, doubled Enterprise & Government revenue and is using lower-cost vertically integrated launch economics to expand capacity. Viasat can still compete through contracted relationships, spectrum and specialized services, but pricing power and share retention become harder as Starlink reliability improves.
Valuation Framework and Key Risks
At the August 5 closing price of $108.27, SPCX traded below its $135 IPO price but still carried an equity value of approximately $1.427 trillion. The calculation uses 13.182 billion Class A and Class B shares outstanding as of July 28, 2026: 13.182 billion shares × $108.27. Adding $39.364 billion of debt and finance leases and subtracting $100.009 billion of cash and marketable securities produces an estimated enterprise value of approximately $1.367 trillion. These are calculated from company-reported figures and the cited market price.
- Estimated enterprise value to annualized Q2 revenue: approximately 43.7 times, using $1.367 trillion ÷ ($7.814 billion × 4).
- Estimated enterprise value to annualized Q2 adjusted EBITDA: approximately 96.6 times, using $1.367 trillion ÷ ($3.538 billion × 4).
- Estimated enterprise value to management’s December annualized revenue run-rate target: approximately 13.7 times, using $1.367 trillion ÷ $100 billion.
- Equity value to annualized Connectivity operating income: approximately 215 times, using $1.427 trillion ÷ ($1.656 billion × 4).
All four ratios are calculated from company-reported figures and should be treated as directional rather than conventional forward multiples. Annualizing a single quarter ignores seasonality and ramp timing. The December run-rate target is not GAAP revenue guidance. Adjusted EBITDA excludes very large depreciation and stock-compensation charges. The Connectivity multiple intentionally isolates the current cash engine and therefore assigns no value to future profits from AI or Space; its purpose is to show how much future success the market still capitalizes.
The valuation can work only if several operating claims prove simultaneously true: cloud capacity earns rapid paybacks; premium compute pricing remains durable; Starlink Enterprise & Government becomes larger than consumer; Starship materially lowers launch cost; V3 satellites create a capacity step-change; and the company converts its December run rate into recurring cash earnings. A lower share price reduces the headline valuation, but it does not make the stock conventionally cheap.
The main risks are:
- Capital-allocation risk: Management’s capex commentary implies a full-year spending level near $65 billion. A delay in contract ramps or a decline in compute pricing would have an outsized effect on free cash flow.
- Earnings-quality risk: AI adjusted EBITDA is positive, but AI remains deeply loss-making under GAAP and its depreciation plus stock compensation nearly equals segment revenue.
- Customer and vendor concentration: Large cloud contracts appear to be concentrated among a limited set of counterparties, while future AI architecture is tied exclusively to NVIDIA.
- Execution and regulatory risk: Starlink V3 economics require successful Starship launches, catches, reuse, regulatory approvals and a sufficiently dense constellation.
- Dilution risk: Cursor’s $60 billion consideration will be paid in SPCX Class A shares based on the seven-day pre-closing VWAP. At $108.27, the transaction would imply roughly 554 million new shares, or about 4.2% of the current Class A and Class B share count; this is an illustrative calculation, not the final exchange ratio.
- Technical supply risk: The post-IPO lockup schedule can materially expand the tradable float, potentially suppressing the share price independently of operating performance.
The appropriate framework is therefore not a simple aerospace multiple or a standard software multiple. SPCX is best treated as a sum of three businesses with shared infrastructure: a profitable, high-growth connectivity platform; a capital-intensive AI compute and software platform; and a loss-making launch and development platform whose value depends on Starship. The stock’s premium reflects the possibility that vertical integration creates compounding advantages across all three. The risk is that investors pay for those synergies before the cash returns are independently visible.
3. Key FAQs
Did SPCX beat Q2 2026 earnings expectations?
Yes. SpaceX reported $7.814 billion of revenue versus a Reuters-reported consensus near $6.82 billion, and a GAAP loss of $0.09 per share versus an expected loss of $0.26. Connectivity operating margin also exceeded the Visible Alpha estimate. However, capex of $18.369 billion was roughly 40% above the widely reported pre-earnings expectation, which was the quarter’s most important adverse surprise.
Why did SPCX stock fall after the Q2 2026 earnings beat?
The stock fell because the earnings report changed the expected cash-flow profile. Management indicated that Q3 and Q4 capex should remain close to Q2’s $18.4 billion level, while the market was already facing a large share unlock and pending all-stock dilution from the Cursor acquisition. At approximately $108 per share, the valuation still required exceptional growth and execution, so a higher spending path outweighed the revenue and EPS beat.
What is SPCX Q3 2026 guidance, and is Starlink profitable?
SpaceX did not issue a formal Q3 revenue, EPS or consolidated operating-margin range. It said the next two quarters should have capex similar to Q2, an additional $6.7 billion of cloud contracts should begin ramping in October, compute capacity should exceed 2 GW by year-end, and December annualized revenue run rate should exceed $100 billion. Starlink is reported inside the Connectivity segment, which generated $1.656 billion of GAAP operating income and a 38.6% operating margin in Q2.
Primary sources: SpaceX Investor Relations, the official Q2 2026 earnings release, the official earnings call transcript, the Q2 2026 Form 10-Q, and the Cursor merger Form 8-K. Market-consensus and share-reaction context was checked against Reuters.
Disclaimer: This article/chart is for educational and informational purposes only and does not constitute investment advice of any kind. Past performance is not indicative of future results. Investors should independently evaluate their own risks.