Key Takeaways
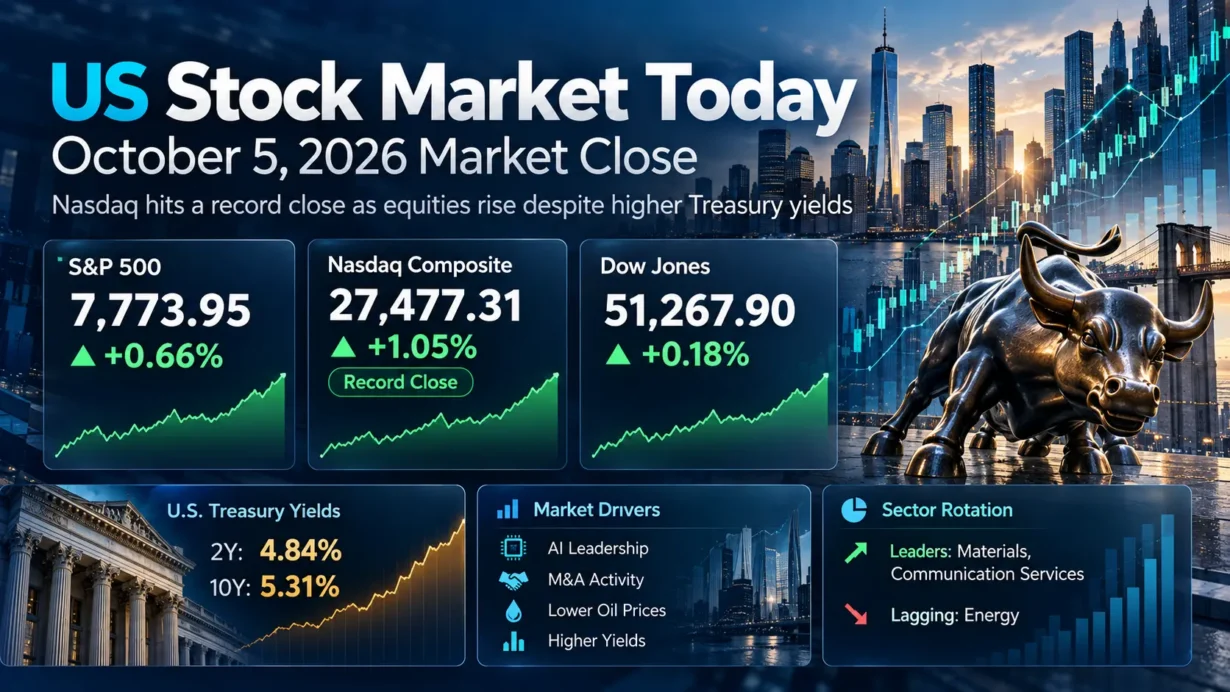
- The S&P 500 rose 0.66% to 7,773.95, the Nasdaq Composite gained 1.05% to a record 27,477.31, the Dow added 0.18% to 51,267.90, and the Russell 2000 advanced 0.50% to 2,847.14.
- Participation was positive but not euphoric: 10 of 11 S&P 500 sectors advanced, S&P 500 advancers outnumbered decliners by roughly 1.7 to 1, and U.S. exchange volume of 16.8 billion shares remained below the 20-session average of 17.3 billion.
- Materials led the S&P 500 sector indexes with a 1.22% gain, followed by Communication Services at 1.14%, while Real Estate fell 0.44% as the 10-year Treasury yield rose to 5.31%.
- The Cboe VIX closed at 15.52, up 0.21 point or 1.37%, showing that investors kept some hedging demand even as equities advanced.
- The session extended Friday’s response to a softer September labor report: nonfarm payrolls rose only 29,000, unemployment edged up to 4.2%, and average hourly earnings increased 0.1% month over month and 3.0% year over year.
1. Market Capital Flows and Sector Rotation
Monday’s tape combined broad participation with clear large-cap growth leadership. The Nasdaq Composite outperformed the S&P 500, Dow and Russell 2000, while Nvidia rose 2.1% to a record close, Microsoft gained 1.5%, and Meta Platforms and Tesla each advanced about 2%. That relative performance is consistent with a growth-oriented tilt, but it should not be treated as a pure growth-versus-value factor signal without a directly verified style-index spread. Small caps participated, with the Russell 2000 up 0.50%, yet they still lagged the Nasdaq’s 1.05% advance.
Sector leadership was broader than the headline technology narrative. Materials rose 1.22%, Communication Services gained 1.14%, Energy advanced 0.89%, Health Care added 0.75%, Financials rose 0.73%, and Information Technology gained 0.72%. Real Estate was the only S&P 500 sector in negative territory, falling 0.44%. The mix matters: cyclical exposure in materials, energy and financials attracted capital, but defensive health care and consumer staples also rose, so the session was not a simple high-beta rotation. The real outlier was rate-sensitive real estate, where higher long-term yields raised the relative appeal of bonds and increased the discount rate applied to property cash flows.
Market breadth confirmed that the advance reached beyond a handful of mega-cap stocks. Within the S&P 500, advancing issues outnumbered decliners by about 1.7 to 1. At the same time, trading activity was relatively light, with 16.8 billion shares changing hands across U.S. exchanges versus a 17.3 billion 20-session average. That combination supports the view that the rally had breadth, but not the volume profile normally associated with aggressive risk-budget expansion.
Institutional Flow Insight: The most plausible institutional interpretation is selective risk addition rather than an indiscriminate chase. Softer labor data reduced the perceived urgency of another near-term Federal Reserve hike, while lower oil prices eased a portion of the inflation risk premium. That favored companies with visible earnings and secular growth exposure, especially mega-cap technology, even though long-duration assets still faced a higher Treasury discount rate. Materials and financials benefited from a broader cyclical bid, while real estate remained constrained by rate sensitivity. Early-quarter rebalancing after the September 30 quarter-end may also have influenced flows, but there is no public evidence that allows that factor to be confirmed as a primary driver.
2. Decoding the Biggest Market Movers
PTC Inc. (PTC)
PTC closed at $192.26, up 33.49%, after Schneider Electric agreed to acquire the industrial software company for $205 per share in cash. The transaction values PTC’s equity at approximately $22.6 billion and implies an enterprise value of about $23.7 billion. The $205 offer represented a 42.3% premium to PTC’s October 2 closing price. PTC also filed an 8-K with the SEC confirming that the merger agreement was signed on October 4 and publicly announced on October 5.
The valuation response also needs to be viewed against PTC’s latest reported operating profile, not just the takeover premium. In fiscal third-quarter 2026, PTC reported revenue of $600 million, GAAP operating margin of 28%, non-GAAP operating margin of 41%, GAAP diluted EPS of $1.03 and non-GAAP diluted EPS of $1.58. Constant-currency ARR excluding divested businesses was $2.448 billion, up 9.1% year over year. Management’s official fiscal-2026 guidance called for revenue of $2.69 billion to $2.75 billion, GAAP EPS of $8.46 to $9.18 and non-GAAP EPS of $7.87 to $8.42. Those figures come from PTC’s July 29 earnings release rather than analyst forecasts.
For the broader software and industrial-technology complex, the deal reinforces the strategic value of software that sits close to engineering workflows, product lifecycle management and industrial data. PTC’s sharp move therefore carried more than merger-arbitrage significance: it provided a fresh transaction benchmark for scarce industrial software assets. However, the fact that PTC closed below the $205 cash offer still reflects closing-time, regulatory and transaction-risk considerations rather than a guaranteed path to the bid price.
RXO Inc. (RXO)
RXO rose 22.54% to $28.65 after C.H. Robinson Worldwide agreed to acquire the freight broker in a stock-and-cash transaction with an announced implied value of $5.8 billion. Under the agreement, the standard mixed consideration is $17.25 in cash plus 0.0856 C.H. Robinson shares for each RXO share, with election alternatives subject to proration. The companies said the transaction represented implied consideration of $30.25 per RXO share based on C.H. Robinson’s 16-day volume-weighted average price through October 2. C.H. Robinson fell 10.85% on October 5, underscoring the market’s distinction between the value captured by the target and the execution burden assumed by the buyer.
RXO’s latest official quarterly results also show why scale matters in freight brokerage. Second-quarter 2026 revenue was $1.8 billion versus $1.4 billion a year earlier, while gross margin declined to 13.9% from 17.8%. The company reported a GAAP net loss of $9 million, adjusted net income of $10 million, adjusted EBITDA of $40 million, a 2.3% adjusted EBITDA margin, GAAP diluted loss per share of $0.05 and adjusted diluted EPS of $0.06. The transaction therefore shifts the market conversation from stand-alone freight-cycle recovery toward network density, purchasing scale and operating integration. For transportation peers, the deal can support strategic scarcity value, but the acquirer’s selloff is a reminder that consolidation premiums do not automatically translate into immediate shareholder value for the buyer.
3. Macro Indicators and Market Outlook
The Cboe VIX finished at 15.52, up 0.21 point or 1.37%. That is an important divergence from the equity tape. A rising VIX during a higher S&P 500 session does not necessarily signal an imminent reversal, but it does indicate that investors continued to pay for near-term optionality and event protection. The move is consistent with a market willing to own equities while still hedging around high Treasury yields, geopolitical risk and an approaching earnings season.
On the U.S. Treasury’s official daily par curve, the 2-year yield rose 1 basis point to 4.84% and the 10-year yield increased 3 basis points to 5.31%. The 2s10s curve therefore stood at roughly +47 basis points and steepened modestly. The front end remained anchored by the Federal Reserve’s 3.75%-4.00% target range and by expectations that softer labor data could reduce the need for an immediate follow-up hike. The larger move in the 10-year suggests that investors were still demanding compensation for longer-run inflation uncertainty, Treasury supply and term premium. It would be inappropriate, however, to interpret a single day’s yield move as proof of a specific future Fed decision.
The labor backdrop explains the split between front-end policy expectations and long-end yields. September nonfarm payrolls rose by only 29,000, the unemployment rate increased to 4.2%, and wage growth slowed to 0.1% month over month and 3.0% year over year. Reuters reported that the implied probability of an October rate hike had fallen to about 24% from roughly 70% a week earlier. At the same time, oil prices fell about 2% on October 5 as Middle East crude exports increased and the G7 pledged measures to boost supply, giving equity investors some near-term inflation relief without fully resolving the longer-duration rate risk.
Upcoming Economic Data & Catalysts:
- FOMC Minutes from the September 15-16 Meeting (Release date: October 7, 2026): Investors will focus on how policymakers framed the September rate increase, the balance between inflation and labor risks, and the conditions that could justify another move. The minutes could affect front-end yields and the market’s interpretation of the October 27-28 meeting.
- Consumer Price Index for September 2026 (Release date: October 14, 2026): The CPI report will be central to the next round of inflation repricing. A material surprise could alter Treasury yields, equity duration sensitivity and the relative appeal of high-multiple growth shares versus rate-sensitive and value-oriented sectors.
Market Insights:
The October 5 advance was broader than a pure mega-cap squeeze: 10 of 11 sectors rose and S&P 500 breadth was positive. Still, the Nasdaq’s record close and outsized gains in Nvidia, Microsoft, Meta and Tesla show that mega-cap growth amplified the headline index move. The main reversal risks are a renewed acceleration in long-term yields, deteriorating breadth, downward earnings revisions, an inflation surprise, a policy shock or a sustained volatility breakout. Light trading volume also argues against assuming that one positive session represents a durable expansion in institutional risk appetite.
Trading & Investment Strategy:
Risk management should remain more important than index-level momentum. Investors can consider scaling into positions rather than chasing gap-ups, keeping position sizes consistent with portfolio volatility, and prioritizing companies with strong balance sheets, recurring cash flow or visible earnings drivers. Sector diversification remains useful because the market is simultaneously rewarding secular growth and selected cyclicals while penalizing rate-sensitive real estate. For event-driven names such as PTC and RXO, investors should distinguish the announced transaction value from the market price and recognize closing, financing and regulatory risks. Predefined risk limits and disciplined exits are preferable to adding leverage simply because the major indexes are near records.
4. Key FAQs About the US Stock Market Today
Why did the US stock market move on October 5, 2026?
U.S. stocks rose as investors combined softer September labor data with lower oil prices and optimism ahead of third-quarter earnings. The weaker jobs report reduced the perceived probability of an immediate Fed rate hike, while mega-cap technology stocks extended their advance. The rally persisted even as long-term Treasury yields rose, showing that earnings confidence temporarily outweighed the valuation pressure from higher discount rates.
Which sectors performed best and worst in the US stock market on October 5, 2026?
Materials was the best-performing S&P 500 sector, rising 1.22%, followed by Communication Services at 1.14%. Real Estate was the only sector to decline, falling 0.44%. The pattern suggests investors favored a mix of cyclical exposure and large communication-platform companies while continuing to avoid the most rate-sensitive property equities as the 10-year Treasury yield moved to 5.31%.
What should investors watch after the US stock market close on October 5, 2026?
The next major macro checkpoints are the October 7 FOMC minutes and the October 14 CPI report. Investors should also monitor whether the 10-year Treasury yield extends its rise, whether S&P 500 breadth remains positive, and whether the VIX continues to firm despite higher equity prices. At the company level, the approaching third-quarter earnings season will test whether current mega-cap valuations are supported by realized revenue, margins and cash flow rather than momentum alone.
Disclaimer: This article is intended solely for the exchange of investment ideas and does not constitute investment advice of any kind.