Key Takeaways
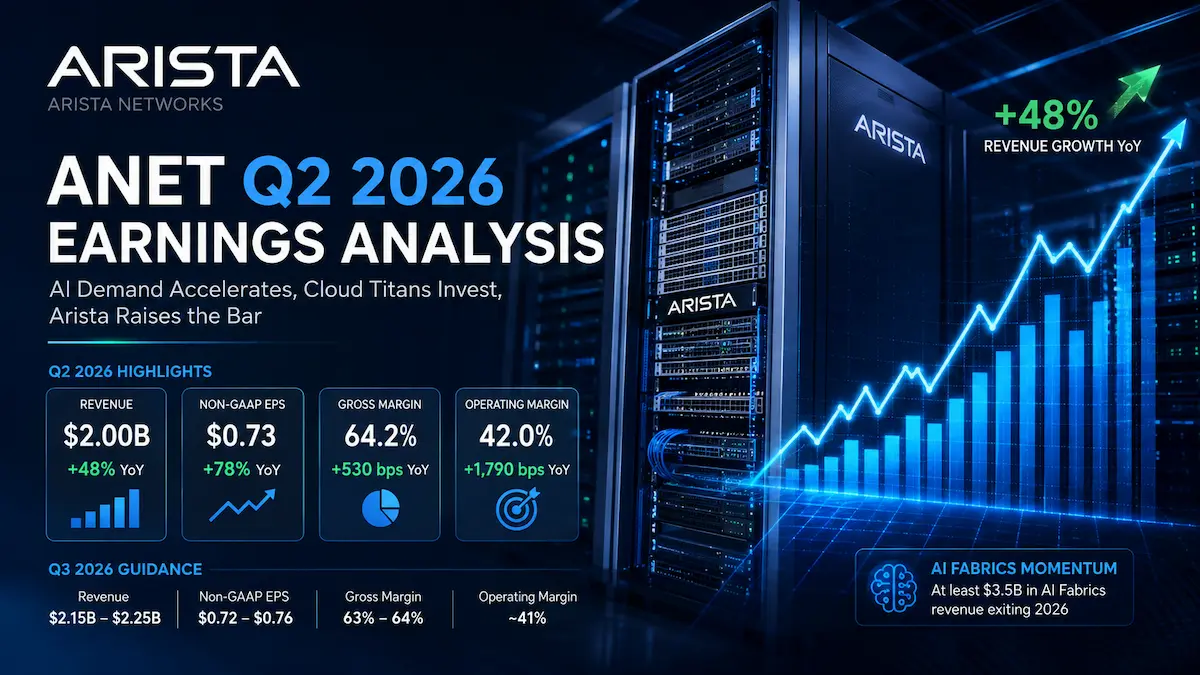
- Arista Networks generated Q2 2026 revenue of $3.0357 billion, up 37.7% year over year, with product revenue rising 38.8% and service revenue rising 31.3%.
- Non-GAAP EPS of $1.02 and non-GAAP operating margin of 49.9% materially exceeded both market expectations and Arista’s prior operating-margin guidance.
- Management raised 2026 revenue guidance to approximately $12.6 billion, or 40% growth, with the incremental upside extending beyond AI fabrics into core data center, enterprise campus and routing.
- Earnings quality was strong: GAAP EPS was $0.95 versus adjusted EPS of $1.02, while adjusted operating income grew 40.6%, broadly matching adjusted EPS growth.
- At the August 5 close of $197.31, ANET traded at approximately 18.9 times enterprise value to management’s 2026 revenue outlook, leaving limited tolerance for a demand, margin or execution reset.
Arista Networks delivered a quarter that changed the near-term earnings trajectory rather than merely clearing a low bar. The headline beat was large, but the more important development was the composition of the raised outlook: management attributed the incremental 2026 revenue opportunity not only to backend AI fabrics, but also to a recovery in core front-end data center switching, enterprise campus deployments and routing adjacencies.
That distinction matters for valuation. A narrow AI-spending surge would support strong growth but leave ANET exposed to hyperscaler concentration and capital-expenditure timing. A broader product-cycle reacceleration supports a more durable earnings base, better utilization of the company’s go-to-market infrastructure and a stronger argument that Arista is becoming a full-stack networking platform rather than a premium hyperscale switch vendor.
The quarter was reported on both GAAP and non-GAAP bases. Unless otherwise stated, market comparisons and company guidance below use non-GAAP figures because that is how Arista guides investors. GAAP figures are presented separately to assess the quality and sustainability of adjusted earnings.
1. Core Earnings Breakdown
Revenue and Profitability Analysis
Q2 revenue reached $3.0357 billion, increasing 12.1% sequentially and 37.7% year over year. This was reported growth. Arista did not disclose a company-wide constant-currency growth rate, so investors should not relabel the 37.7% figure as currency-neutral or organic growth. Operationally, the quarter reflected higher product shipments, broader AI and enterprise demand, improved component availability and better manufacturing throughput.
Arista reports one operating segment. Product and service are revenue categories rather than separately managed reportable segments, but they provide the most useful view of mix:
- Product revenue was $2.6052 billion, up 38.8% year over year and equal to 85.8% of total revenue. The investment implication is that the quarter was driven by shipment volume and infrastructure deployment, not merely by maintenance renewals or accounting timing.
- Service revenue was $430.5 million, up 31.3% year over year and equal to 14.2% of total revenue. Service is still the smaller revenue stream, but its growth reinforces the installed-base flywheel and raises the lifetime value of product wins.
International revenue was $697.8 million, or 23% of sales, compared with 13.5% in Q1. Management attributed the increase to organic growth across international regions and a geographic mix shift in sales to large global customers. The jump should therefore not be treated as a clean measure of customer diversification: part of it reflects where global accounts booked purchases rather than a complete change in end-customer concentration.
Profitability showed a high-quality but nuanced mix. GAAP gross margin was 62.9%, down from 65.2% a year earlier. Non-GAAP gross margin was 63.4%, down from 65.6%. Management attributed the year-over-year pressure primarily to end-customer mix, while the sequential improvement from 62.4% benefited from tariff refunds and customer mix.
Despite the gross-margin decline, GAAP operating margin expanded to 45.4% from 44.7%, and non-GAAP operating margin expanded to 49.9% from 48.8%. This is the central earnings-quality signal. Revenue grew 37.7%, while GAAP operating expenses increased only 17.7%. Arista therefore converted a 220-basis-point decline in adjusted gross margin into a 110-basis-point increase in adjusted operating margin through expense leverage.
GAAP diluted EPS was $0.95, up 35.7% from $0.70. Non-GAAP diluted EPS was $1.02, up 39.7% from $0.73. The $0.07 difference between GAAP and adjusted EPS was modest relative to the total result. Stock-based compensation was $120.4 million, or approximately 4.0% of revenue, and the gap between GAAP and non-GAAP operating margin was 450 basis points. Adjusted figures therefore improve the presentation, but the core earnings performance remains strong on a GAAP basis.
Other income was $126.3 million, equal to 8.4% of GAAP pretax income. Higher cash balances and investment income helped EPS, but the beat was not dependent on that line: non-GAAP operating income rose 40.6% year over year, closely matching the 39.7% increase in adjusted EPS.
Expectations vs. Actual Results
Metric | Actual / Guidance | Expectation / Prior Guide | Variance | Result |
|---|---|---|---|---|
Q2 2026 revenue | $3.0357 billion | $2.82 billion LSEG consensus | +$215.7 million, or approximately 7.6% | ✅ Beat |
Q2 2026 non-GAAP diluted EPS | $1.02 | $0.88 LSEG consensus | +$0.14, or approximately 15.9% | ✅ Beat |
Q2 2026 non-GAAP operating margin | 49.9% | 46%-47% company guidance | +290 to +390 basis points | ✅ Beat |
Q3 2026 revenue guidance | Approximately $3.3 billion | $2.94 billion LSEG consensus | Approximately +$360 million, or 12.2% | ✅ Above expectations |
Q3 2026 non-GAAP diluted EPS guidance | $1.06-$1.08 | $0.91 LSEG consensus | +$0.15 to +$0.17 | ✅ Above expectations |
Q3 2026 non-GAAP gross margin guidance | Approximately 63% | No dependable public consensus disclosed | Approximately 40 basis points below Q2 | ➖ Broadly stable |
Q3 2026 non-GAAP operating margin guidance | 48%-49% | No dependable public consensus disclosed | Below Q2’s exceptional 49.9%, but above the prior Q2 guide | ✅ Sustained profitability |
Full-year 2026 revenue outlook | Approximately $12.6 billion, or 40% growth | $11.5 billion outlook issued in May | +$1.1 billion, or approximately 9.6% | ✅ Raised |
Consensus estimates differ slightly across providers. The table uses the LSEG figures cited by Reuters rather than mixing estimates from multiple data vendors. Other services showed approximately $2.83 billion of revenue and $0.89 of adjusted EPS; either comparison leads to the same conclusion that the beat was substantial.
The revenue beat came from a combination of demand and supply conversion. Management had previously indicated that component availability constrained its ability to ship against demand. During Q2, Arista expanded manufacturing and distribution capacity, qualified more suppliers, improved component delivery terms and secured 2026 memory supply. The quarter therefore converted part of an existing demand opportunity into recognized product revenue.
The EPS beat came primarily from operating leverage. Adjusted operating margin exceeded the top end of the company’s prior guide by 290 basis points even as Arista increased investment in liquid cooling, high-radix switching and AI-optimized software. The result was not a low-quality beat created by aggressive cost cuts; research and development remained 9.2% of revenue and increased sequentially in dollar terms.
The market cared most about guidance and the composition of the pipeline. Product revenue and EPS established that execution had improved, but the re-rating catalyst was management’s $12.6 billion full-year revenue outlook and its statement that the incremental uplift was broad-based. For 2026, management also framed non-GAAP gross margin at 62%-64%, non-GAAP operating margin at 48%-49%, the tax rate at approximately 21.5%, campus revenue at no less than $1.25 billion and AI Fabrics revenue at no less than $3.5 billion. The call reduced the risk that 2026 upside was confined to a small number of backend AI deployments.
ANET initially traded more than 10% higher after the release. On August 5, the stock opened at $210.19 and reached an intraday high of $214.89, approximately 12.8% above the prior close, before finishing at $197.31, up 3.57%. The gap between the initial reaction and the closing gain should not be described mechanically as “sell the news.” The results and guidance were strong; the fade more plausibly reflected a valuation debate after the stock approached a quarter-trillion-dollar market capitalization, combined with year-over-year gross-margin pressure, a Q3 operating-margin range below the Q2 peak and the execution risk embedded in larger supply commitments.
Earnings Call Highlights
- Etherlink has passed 100 cumulative customers. CFO Chantelle Breithaupt set the 2026 AI Fabrics target at no less than $3.5 billion, while CEO Jayshree Ullal referred to no less than $3.6 billion during the strategic discussion. 💡 Reading Between the Lines: The $100 million wording difference is immaterial to the $12.6 billion company outlook but should not be silently harmonized; $3.5 billion is the more conservative modeling anchor. The customer count indicates broader adoption, although one or two customers may still exceed 10% of annual sales.
- Management raised 2026 revenue guidance to approximately $12.6 billion and said the incremental upside includes core front-end data center, enterprise campus and routing, not only AI. 💡 Reading Between the Lines: This is the most important change to the earnings model. A broader product recovery supports a longer growth runway and lowers the probability that current growth collapses when a single AI build cycle pauses.
- Arista secured 2026 memory supply, extended visibility into 2027 and increased multiyear purchase commitments from $3.6 billion to approximately $9.7 billion. 💡 Reading Between the Lines: Management is using balance-sheet strength to turn supply availability into a competitive weapon. The same decision raises inventory, cancellation and demand-forecast risk if customer schedules change.
- Management argued that EOS, NetDL diagnostics and system-level AI networking features reduce operating complexity and make integrated Arista systems more attractive than white-box alternatives. 💡 Reading Between the Lines: Arista is defending gross margin through total cost of ownership rather than hardware alone. Customers may accept higher upfront capital cost when reliability, staffing savings and XPU utilization reduce the much larger cost of downtime.
- The new 1.6 Tbps platform is expected to enter customer trials in the second half of 2026, with production deployment requiring roughly six to twelve months; pluggable optics and copper should remain dominant near term. 💡 Reading Between the Lines: Investors should avoid pulling a full 1.6T revenue ramp into the current year. The near-term model is still driven by existing 400G and 800G deployments, while 1.6T is more relevant to the 2027 growth bridge.
2. Deep Business Insights
Hidden Metrics That Matter
Metric one is the operating-leverage bridge. Adjusted gross margin declined 220 basis points year over year, but adjusted operating margin increased 110 basis points. The implied improvement in the adjusted operating-expense ratio was approximately 330 basis points: 220 basis points of gross-margin pressure plus 110 basis points of operating-margin expansion. This is calculated from company-reported figures. On a GAAP basis, operating expenses increased 17.7% while revenue increased 37.7%, confirming that the margin improvement was created by scale rather than by non-GAAP exclusions alone.
This matters because AI networking hardware can carry volatile customer and product mix. Arista does not need gross margin to return immediately to the mid-60% range to generate faster earnings growth if operating expenses continue to scale more slowly than revenue. The risk is that investors may extrapolate a near-50% adjusted operating margin into years when growth normalizes and sales investment rises.
Metric two is the balance-sheet commitment required to support the new revenue plan. Purchase commitments reached approximately $9.7 billion. Dividing $9.7 billion by the $12.6 billion 2026 revenue outlook produces a 77.0% ratio, calculated from company-reported figures. This is not a backlog ratio and should not be interpreted as 77% of revenue already sold. Inventory was $2.5353 billion and inventory turns were 1.7, so the commitment strategy is already visible in working capital. It shows the scale of Arista’s supplier commitments relative to annual sales and the amount of capital discipline required to avoid excess inventory.
Deferred revenue provides a second balance-sheet signal. Current and non-current deferred revenue totaled $6.8659 billion at June 30, 2026, compared with $5.3724 billion at December 31, 2025. The increase was $1.4935 billion, or 27.8%, calculated from company-reported figures. Management said the majority of the balance was product-related and that product deferred revenue increased by approximately $600 million sequentially, largely because of customer-specific acceptance clauses. Deferred revenue is therefore not backlog and does not map cleanly to the next twelve months; it is better viewed as evidence of shipped or invoiced product awaiting contractual revenue recognition, plus service obligations.
Customers choose Arista because the economic proposition extends beyond switching throughput. EOS provides a consistent software image across platforms; Smart System Upgrade can reduce disruptive maintenance; MRC and SRv6 improve fabric utilization and path control; NetDL adds diagnostics across hardware and software; and the system architecture reduces the staffing burden for customers that lack large networking teams. The differentiation is therefore operational reliability and fleet-level automation, not a single proprietary chip or chassis.
Industry Chain Reactions
- ✅ Benefit — Broadcom (AVGO): Arista’s higher shipment outlook and larger multiyear component commitments are a positive read-through for the merchant Ethernet switching-silicon ecosystem. The direct revenue impact cannot be calculated because Arista does not disclose supplier allocation, but the demand signal supports high-speed switching and connectivity content.
- ❌ Face Pressure — Cisco Systems (CSCO): The incremental guide includes enterprise campus, front-end data center and routing, expanding the areas where Arista competes directly with Cisco. Arista’s single-EOS architecture and high sales efficiency increase pressure on incumbent pricing, renewal economics and operating complexity.
Nvidia requires a more nuanced interpretation than a simple winner-or-loser label. Ethernet adoption in scale-out and scale-across networks can pressure InfiniBand share, but Arista also connects a large installed base of Nvidia GPUs and acknowledged that NVLink remains difficult to displace in scale-up systems. Strong ANET results can therefore validate AI infrastructure demand while creating competitive pressure only within selected networking layers.
Valuation Framework and Key Risks
ANET closed at $197.31 on August 5, 2026, implying a market capitalization of approximately $251.8 billion. Arista ended Q2 with $13.3433 billion of cash, cash equivalents and marketable securities. Subtracting that balance from market capitalization produces an approximate enterprise value of $238.4 billion. Dividing enterprise value by management’s $12.6 billion 2026 revenue outlook gives an enterprise-value-to-sales multiple of approximately 18.9 times.
The trailing price-to-earnings ratio was approximately 61.5 times. A mechanical annualization of Q2 EPS produces a lower but still demanding reference point: $197.31 divided by four times $1.02 equals 48.4 times annualized non-GAAP EPS, while $197.31 divided by four times $0.95 equals 51.9 times annualized GAAP EPS. These are calculated from company-reported figures and the August 5 closing price; they are not forecasts and ignore normal quarterly seasonality.
The valuation implies that investors are underwriting more than one strong year. Even if 2027 revenue grows 20%, the current enterprise value would equal roughly 15.8 times that hypothetical revenue before considering future cash generation. The market is therefore pricing a combination of sustained AI fabric growth, continued enterprise share gains, durable near-50% adjusted operating margins and limited disruption from white-box or proprietary networking architectures.
The premium is supported by unusual financial quality: 37.7% revenue growth, approximately 50% adjusted operating margin, a net-cash balance sheet and an expanding software and service installed base. It is not supported by valuation optionality. A company trading near 19 times the current year’s sales has little room for delayed customer deployments, a lower mix of premium systems or a normalization in hyperscaler capital expenditure.
Key risks include:
- Customer concentration: management expects one or possibly two customers to exceed 10% of 2026 revenue, leaving quarterly results sensitive to deployment schedules.
- Supply and inventory execution: $9.7 billion of purchase commitments improve availability but increase the cost of a forecast error.
- Gross-margin pressure: customer mix, memory and silicon costs, tariffs and pricing timing may keep gross margin below historical peaks even if operating margin remains strong.
- Technology substitution: white-box systems, custom networking, proprietary scale-up fabrics and competing Ethernet platforms can limit pricing power in selected use cases.
- Product-cycle timing: 1.6T platforms require customer qualification, liquid-cooling infrastructure and production readiness, making the ramp more relevant to 2027 than to the current quarter.
- Capital-spending cyclicality: AI infrastructure demand is strong, but the size and concentration of customer programs can create nonlinear order and shipment patterns.
The appropriate valuation conclusion is balanced. Q2 materially improved the fundamental case and reduced the probability of a supply-constrained 2026. It did not remove the risk embedded in the stock price. ANET can sustain a premium multiple if growth broadens as management expects, but the current valuation requires consistent execution rather than merely respectable results.
3. Key FAQs
Did Arista Networks beat Q2 2026 earnings estimates?
Yes. Arista reported Q2 revenue of $3.0357 billion versus the $2.82 billion LSEG consensus cited by Reuters. Non-GAAP EPS was $1.02 versus $0.88 expected. Non-GAAP operating margin was 49.9%, compared with Arista’s prior guidance of 46%-47%.
Why did ANET stock fade after its initial Q2 2026 earnings jump?
ANET initially rose more than 10% and reached $214.89 on August 5, but closed at $197.31, up 3.57%. The fade did not reflect a weak quarter. It was more consistent with valuation sensitivity, profit-taking after a strong pre-earnings run, year-over-year gross-margin compression, a Q3 operating-margin guide below the Q2 peak and concern about the execution obligations created by larger supplier commitments.
What is Arista Networks’ guidance after Q2 2026 earnings?
For Q3 2026, Arista expects approximately $3.3 billion of revenue, approximately 63% non-GAAP gross margin, a 48%-49% non-GAAP operating margin and non-GAAP diluted EPS of $1.06-$1.08. Management also raised full-year 2026 revenue guidance to approximately $12.6 billion, representing 40% annual growth, from the $11.5 billion outlook issued in May. Full-year assumptions include a 62%-64% non-GAAP gross margin, a 48%-49% non-GAAP operating margin and an approximately 21.5% tax rate.
Primary sources include Arista Networks’ official Q2 2026 earnings release, the official earnings webcast page, the SEC-filed earnings exhibit, Reuters and LSEG consensus data, and the time-stamped Quartr earnings-call transcript. Arista’s Investor Relations page currently provides an official webcast replay rather than a company-issued text transcript; management remarks in this article are accurate summaries cross-checked against the official release and time-stamped transcript.
Disclaimer: This article/chart is for educational and informational purposes only and does not constitute investment advice of any kind. Past performance is not indicative of future results. Investors should independently evaluate their own risks.