Key Takeaways
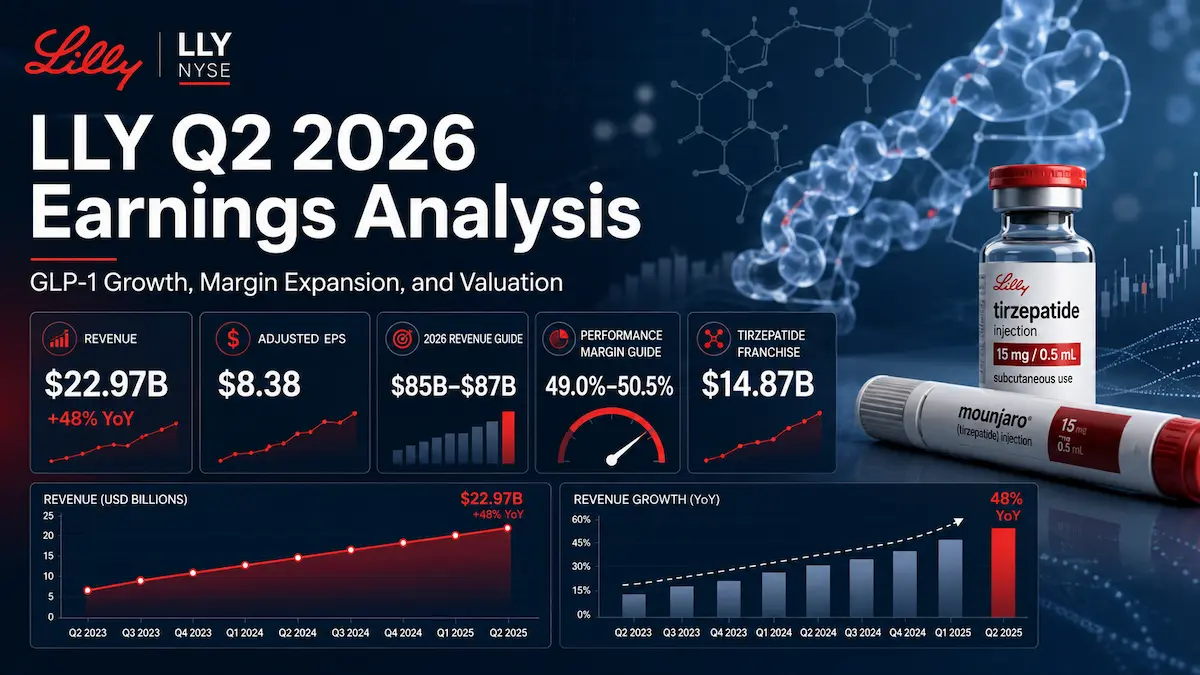
- Eli Lilly generated Q2 2026 revenue of $22.974 billion, up 48% as reported and approximately 46% at constant exchange rates, beating the FactSet consensus by about 11%.
- Non-GAAP EPS reached $8.38 versus the LSEG consensus of $6.01, even after absorbing $3.03 per share of acquired in-process research and development charges.
- Mounjaro and Zepbound produced $14.871 billion of combined sales, equal to 64.7% of total revenue and approximately 84.8% of the company’s year-over-year revenue increase, calculated from company-reported figures.
- Management raised 2026 revenue guidance to $85 billion-$87 billion and non-GAAP performance-margin guidance to 49.0%-50.5%; the apparent reduction in the EPS ceiling primarily reflects acquisition-related IPR&D rather than weaker operating expectations.
- At $1,169.86 per share, LLY traded at about 32.5 times the midpoint of updated 2026 adjusted EPS guidance, leaving the stock dependent on sustained international penetration, pricing discipline and successful execution of Foundayo and retatrutide.
1. Core Earnings Breakdown
Revenue and Profitability Analysis
Eli Lilly reported second-quarter 2026 revenue of $22.974 billion, compared with $15.558 billion a year earlier. Reported growth was 48%, while operational growth at constant exchange rates was approximately 46%. The bridge was unusually transparent: volume added 60 percentage points, lower realized prices subtracted 13 points, and foreign exchange added approximately one point, with rounding accounting for the remaining difference. The central investment conclusion is that demand elasticity remained exceptionally strong despite deliberate price concessions and broader reimbursed access.
Lilly operates as one reportable pharmaceutical segment, so the most useful breakdown is by product franchise, therapeutic area and geography rather than by formal operating segment.
- Mounjaro: Revenue rose 91% to $9.943 billion. U.S. revenue was approximately $4.8 billion, up 45%, while revenue outside the U.S. increased 172% to approximately $5.2 billion. The product is no longer primarily a U.S. diabetes asset; international demand has become a co-equal earnings engine and materially lengthens the franchise growth runway.
- Zepbound: Revenue increased 46% to $4.928 billion, driven by prescription volume and partially offset by lower realized prices, including cash-pay price reductions. The franchise is proving that lower net price can be economically rational when it expands access, improves competitive positioning and raises manufacturing utilization.
- Foundayo: The newly launched oral GLP-1 generated $98 million, modestly below the roughly $106 million market expectation cited after the release. The quarter itself was not decisive; physician adoption, formulary access and the July prescription inflection are more important than the initial sell-in number.
- Ebglyss: Sales increased 131% to $201 million. The base remains small, but accelerating prescription share and expanded maintenance dosing support a credible immunology franchise rather than a single-product launch story.
- Jaypirca: Sales rose 56% to $192 million. Label expansion and combination-regimen data matter more than the current revenue base because broader-line use could materially increase duration and addressable patients.
- Kisunla: Sales reached $167 million, up from $49 million. Uptake remains constrained by diagnostic and infusion infrastructure, but rising blood-based p-tau217 testing can reduce a major friction point in Alzheimer’s treatment.
- Omvoh and Inluriyo: Omvoh grew 36% to $102 million, while Inluriyo contributed $75 million. These assets diversify the pipeline narrative, although their present scale is not yet sufficient to offset incretin concentration risk.
Newer “Key Products,” as defined by Lilly, generated $15.7 billion and grew 76%. That represented approximately 68.3% of company revenue. Within immunology, oncology and neuroscience, Key Product revenue grew 121%, an encouraging sign of portfolio renewal. However, the absolute dollar mix remains dominated by cardiometabolic medicines, so diversification is progressing faster in percentage terms than in economic significance.
Geographically, U.S. revenue rose 33% to $14.413 billion as volume increased 37% and price declined 3%. Management disclosed that U.S. price would have fallen approximately 9% without favorable adjustments to prior estimates for rebates and discounts. Revenue outside the U.S. increased 80% to approximately $8.6 billion, driven by a 113% volume increase and partially offset by a 36% price decline, largely related to Mounjaro’s inclusion on China’s National Reimbursement Drug List. Europe grew 60% as reported and 55% at constant exchange rates; China grew 102% as reported and 93% operationally; and the rest of world increased 143% as reported and 136% operationally.
Profitability was stronger than the headline EPS growth rate suggests. GAAP gross margin was $19.706 billion, or 85.8% of revenue, up 1.5 percentage points. Non-GAAP gross margin was $19.831 billion, or 86.3%, up 1.3 points. Favorable product mix and lower production costs more than offset pricing pressure. R&D expense increased 14% to $3.8 billion, equal to about 17% of revenue, while marketing, selling and administrative expense rose 25% to $3.4 billion as Lilly funded multiple launches.
GAAP operating income was $8.978 billion, implying a 39.1% operating margin calculated from company-reported figures. Adjusted operating income was $9.806 billion, implying a 42.7% adjusted operating margin. Lilly’s separately defined non-GAAP performance margin was 54.8%, up 8.9 percentage points; this metric excludes acquired IPR&D and is calculated as gross margin less R&D and marketing, selling and administrative expense, divided by revenue. It should not be confused with conventional operating margin.
GAAP net income increased 25% to $7.095 billion, and GAAP EPS rose 26% to $7.94. Non-GAAP net income increased 32% to $7.493 billion, and non-GAAP EPS rose 33% to $8.38. Both measures included $3.03 per share of acquired IPR&D charges, mainly related to recent acquisitions. An illustrative pre-IPR&D EPS figure would be $11.41, calculated as $8.38 plus $3.03 from company-reported figures. That calculation is useful for isolating operating momentum, but investors should not automatically treat business-development spending as irrelevant because acquisitions are a recurring component of Lilly’s capital-allocation strategy.
Expectations vs. Actual Results
Metric | Q2 2026 Actual | Market Expectation / Prior Guidance | Result |
|---|---|---|---|
Total revenue | $22.974 billion | Approximately $20.69 billion FactSet consensus | ✅ Beat by approximately $2.28 billion, or 11.0% |
Adjusted diluted EPS | $8.38 | $6.01 LSEG consensus | ✅ Beat by $2.37, or 39.4% |
GAAP operating margin | 39.1%, calculated as $8.978 billion / $22.974 billion | No reliable standardized public quarterly consensus located | Not directly comparable; operating income rose 31% |
Non-GAAP performance margin | 54.8% | No reliable standardized public quarterly consensus located | ✅ Expanded 8.9 percentage points year over year |
2026 revenue guidance | $85 billion-$87 billion | Prior: $82 billion-$85 billion; FactSet consensus approximately $85.28 billion | ✅ Midpoint raised by $2.5 billion to $86 billion |
2026 non-GAAP performance-margin guidance | 49.0%-50.5% | Prior: 47.0%-48.5% | ✅ Raised by 2.0 percentage points at both ends |
2026 adjusted EPS guidance | $35.50-$36.50 | Prior: $35.50-$37.00; consensus approximately $35.04 | Mixed headline: top end reduced, but midpoint remains above consensus |
Q3 2026 guidance | No formal quarterly revenue, EPS or margin guidance issued | Not applicable | Investors must model Q3 from full-year guidance and call commentary |
Consensus figures vary slightly by data provider. The revenue comparison above uses the approximately $20.69 billion FactSet figure reported after the release, while the EPS comparison uses the $6.01 LSEG average cited by Reuters.
The beat was not driven by a low-quality tax benefit or a single accounting adjustment. Mounjaro produced $9.943 billion versus a pre-release estimate near $8.93 billion, while Zepbound’s $4.928 billion was above expectations near $4.7 billion. Together, those two products delivered approximately $6.3 billion of year-over-year growth. Gross-margin expansion and operating leverage then converted the revenue surprise into a much larger EPS surprise.
There were nevertheless non-recurring elements. U.S. price benefited from adjustments to prior rebate and discount estimates, and international revenue included a $250 million Jardiance sales-based milestone. Management explicitly warned that the rebate adjustment would not repeat in the second half. A disciplined model should therefore avoid annualizing the full Q2 revenue and margin run rate.
The updated EPS range requires careful interpretation. The midpoint fell by $0.25 from the prior range, but Lilly stated that underlying non-GAAP EPS expectations increased by $2.78 at the midpoint before the $3.03 per-share impact of Q2 acquired IPR&D. The apparent guidance cut was therefore an acquisition-accounting effect, not a deterioration in the commercial outlook. Future acquired IPR&D incurred after June 30 is excluded from the guidance and could create additional reported volatility.
The market was more focused on four issues than on the headline EPS beat alone: the durability of Mounjaro and Zepbound volume, the 13% companywide price headwind, the early trajectory of Foundayo, and the timing and regulatory pathway for retatrutide. Pipeline optionality remains a valuation input because Lilly’s current multiple assumes that the franchise can extend beyond first-generation tirzepatide.
LLY shares closed on August 5, 2026 at $1,169.86, up approximately 4.8%. The positive reaction was directionally consistent with the results, but smaller than the 39% EPS surprise. That gap is rational rather than contradictory: investors discounted rebate true-ups and milestone revenue, noted Foundayo’s modest sales miss, and recognized that a stock valued above $1 trillion already embeds substantial success. The reaction was not a simple “sell the news” event; it was a partial upward revision to earnings estimates without a comparable expansion in the valuation multiple.
Earnings Call Highlights
- Management said the Medicare GLP-1 Bridge Program gives roughly 20 million eligible Americans obesity-drug coverage at a $50 monthly out-of-pocket cost; early program data showed about 80% choosing injectables and 60%-70% representing new patients. 💡 Reading Between the Lines: Access expansion is becoming the principal volume catalyst, but it comes with lower net pricing. The relevant valuation question is whether incremental scripts and better fixed-cost absorption continue to outweigh the rebate and mix pressure.
- Foundayo prescriptions in the final week of July were almost double the level one month earlier, approximately one in four new starts were on Foundayo, and the prescriber base increased from about 8,000 to 36,000. 💡 Reading Between the Lines: The $98 million launch-quarter revenue figure understates the recent change in commercial momentum, but sampling, inventory build and direct-to-consumer spending make early prescription data noisy. The launch must still prove persistence, titration and reimbursement economics.
- The CFO cautioned that favorable prior-period rebate adjustments will not recur in the second half and that future international growth will depend more on market penetration than on a new-country launch bolus. 💡 Reading Between the Lines: Q2 should not be mechanically annualized. Management is signaling continued absolute-dollar growth but a slower percentage cadence, with more pressure on price realization and a tougher comparison base.
- Lilly has the clinical package needed for retatrutide registration and targets a U.S. submission in Q1 2027, while additional CMC work and the proposed biologics-license pathway remain unresolved execution items. 💡 Reading Between the Lines: Retatrutide is the largest source of duration beyond the current tirzepatide cycle, but regulatory classification and launch timing introduce non-trivial risk. A delay would affect the terminal-growth assumptions embedded in premium valuation models.
- International management reported continued Mounjaro prescription growth in India and Brazil after generic semaglutide launches, attributing resilience to tirzepatide differentiation and competitor supply constraints. 💡 Reading Between the Lines: Clinical differentiation is functioning as a first line of defense against lower-priced alternatives, but it does not eliminate price competition. The international opportunity can expand units rapidly while producing structurally lower revenue per prescription.
2. Deep Business Insights
Hidden Metrics That Matter
Metric 1: Tirzepatide concentration is higher than the broad portfolio narrative suggests. Mounjaro and Zepbound represented 64.7% of Q2 revenue: ($9.943 billion + $4.928 billion) / $22.974 billion = 64.7%, calculated from company-reported figures. More importantly, the two products generated approximately 84.8% of Lilly’s year-over-year revenue growth: [($9.943 billion – $5.199 billion) + ($4.928 billion – $3.381 billion)] / ($22.974 billion – $15.558 billion) = 84.8%, calculated from company-reported figures.
This concentration is both the core advantage and the principal risk. Lilly has the strongest commercial engine in the fastest-growing large pharmaceutical category, but a material change in reimbursement, safety perception, competitor efficacy, supply or net pricing would transmit rapidly into consolidated results. The 121% growth in newer oncology, immunology and neuroscience products is strategically valuable, yet those products still contribute a comparatively small share of absolute dollars.
Metric 2: Mounjaro has crossed into an internationally balanced franchise. Outside-U.S. Mounjaro sales were approximately $5.2 billion, equal to 52.3% of worldwide Mounjaro revenue: $5.2 billion / $9.943 billion = 52.3%, calculated from company-reported figures. At the company level, 60% volume growth absorbed a 13% price decline and still produced approximately 46% operational revenue growth.
This matters because international penetration provides years of unit growth, but the economics are different from the U.S. cash-pay and commercial markets. China reimbursement illustrates the trade-off: materially lower price can unlock very high volume. Investors should model geographic mix and net price separately rather than extrapolate U.S. revenue per prescription across global markets.
Patients, physicians and payers are choosing Lilly’s platform for a combination of differentiated clinical outcomes, multiple delivery formats, improving formulary access and increasingly integrated distribution. Tirzepatide’s efficacy supports physician preference; Foundayo adds an oral option without food or water restrictions; LillyDirect and the CVS collaboration reduce access friction; and new manufacturing capacity lowers the risk that demand is capped by supply. The distinctive asset is not one molecule alone but the combination of product efficacy, access infrastructure, manufacturing scale and a pipeline designed to move patients across oral, injectable and next-generation therapies.
Industry Chain Reactions
- ✅ Benefit — CVS Health (NYSE: CVS): CVS Caremark’s expanded formulary access for Foundayo and Zepbound, together with the new CVS-Lilly direct-to-consumer collaboration, can increase prescription volume, digital engagement, clinician visits and same-day pharmacy fulfillment. The benefit is not automatic because CVS also bears drug-cost and reimbursement complexity through its insurance and PBM businesses, but higher GLP-1 activity strengthens the value of its integrated care platform.
- ❌ Face Pressure — Novo Nordisk (NYSE: NVO): Lilly reported approximately 60.9% share of the U.S. incretin-analog market and 54.9% share internationally in its investor presentation. Injectable medicines still accounted for roughly three out of four new patient starts, while Lilly’s Medicare data showed an approximately 80% injectable preference. Novo remains a formidable competitor, especially in oral therapy, but Lilly’s Q2 volume, share and international momentum raise the execution bar.
Valuation Framework and Key Risks
At the August 5 closing price of $1,169.86, LLY had an equity market value of approximately $1.046 trillion and a trailing P/E near 39.3 times. Using the midpoint of updated 2026 adjusted EPS guidance, the forward multiple is approximately 32.5 times: $1,169.86 / $36.00 = 32.5 times. Using the $86 billion revenue-guidance midpoint, the equity-value-to-sales proxy is approximately 12.2 times: $1.046 trillion / $86 billion = 12.2 times.
The valuation is demanding but not disconnected from the operating profile. Revenue is expected to grow about 32% at the guidance midpoint, non-GAAP performance margin is guided to 49.0%-50.5%, and Lilly is gaining share in a category with low treatment penetration. The quarter supports higher near-term earnings estimates because the revenue beat was volume-led and margins expanded despite lower prices.
However, the stock does not merely price 2026. It prices continued international Mounjaro penetration, durable Zepbound leadership, a successful global Foundayo rollout, retatrutide approval and commercialization, and meaningful growth from non-incretin assets. A 32.5-times forward multiple leaves less room for execution variance than the income statement alone suggests.
- Pricing and access risk: Broader coverage can expand volume while accelerating rebate pressure. Management expects U.S. pricing to decline as CVS access normalizes, and international reimbursement generally carries lower net prices.
- Product concentration risk: Mounjaro and Zepbound account for nearly two-thirds of revenue and most incremental growth.
- Foundayo execution risk: Early prescription indicators improved, but launch revenue missed expectations modestly and oral competition remains active.
- Retatrutide regulatory risk: The filing target is Q1 2027, but CMC completion and the BLA pathway are not fully resolved.
- Capital-allocation risk: Acquired IPR&D and integration charges create EPS volatility. Because business development is central to Lilly’s strategy, investors should not assume every charge is economically irrelevant.
- Manufacturing risk: The growth thesis requires continuous, reliable scale-up across injectable, oral and advanced-therapy capacity.
- Political and reimbursement risk: Obesity-drug coverage, Medicare design, drug-price policy and formulary negotiations can materially alter both market size and revenue per patient.
The appropriate conclusion is that Q2 improved the probability of Lilly delivering the earnings embedded in the current valuation, but it did not remove the need for sustained high growth. Near-term estimate revisions are supported; further multiple expansion would require evidence that international penetration, Foundayo and retatrutide can extend the growth curve without a disproportionate deterioration in net price.
3. Key FAQs
Did Eli Lilly beat Q2 2026 earnings estimates?
Yes. Lilly reported revenue of $22.974 billion versus an approximately $20.69 billion FactSet consensus, an 11.0% beat. Adjusted EPS was $8.38 versus the $6.01 LSEG consensus, a 39.4% beat. The main drivers were Mounjaro and Zepbound sales, gross-margin expansion and operating leverage.
Why did LLY stock rise after the Q2 2026 earnings report?
LLY rose approximately 4.8% because the company delivered a large revenue and EPS beat, raised full-year revenue guidance and increased performance-margin guidance. The share-price gain was smaller than the EPS surprise because some Q2 benefits were non-recurring, Foundayo slightly missed expectations, pricing remains under pressure and the stock already traded at a premium valuation.
What is Eli Lilly’s 2026 revenue and EPS guidance after Q2?
Lilly expects 2026 revenue of $85 billion-$87 billion, non-GAAP performance margin of 49.0%-50.5%, and adjusted EPS of $35.50-$36.50. The lower EPS ceiling reflects Q2 acquired IPR&D charges; management said underlying EPS expectations increased by $2.78 at the midpoint before the $3.03 per-share acquisition charge.
Primary sources: Eli Lilly’s official Q2 2026 earnings release, official earnings presentation, and official earnings-call webcast and replay. Market expectations and reaction were cross-checked with Reuters, and call remarks were checked against the published earnings-call transcript.
Disclaimer: This article/chart is for educational and informational purposes only and does not constitute investment advice of any kind. Past performance is not indicative of future results. Investors should independently evaluate their own risks.