Key Takeaways
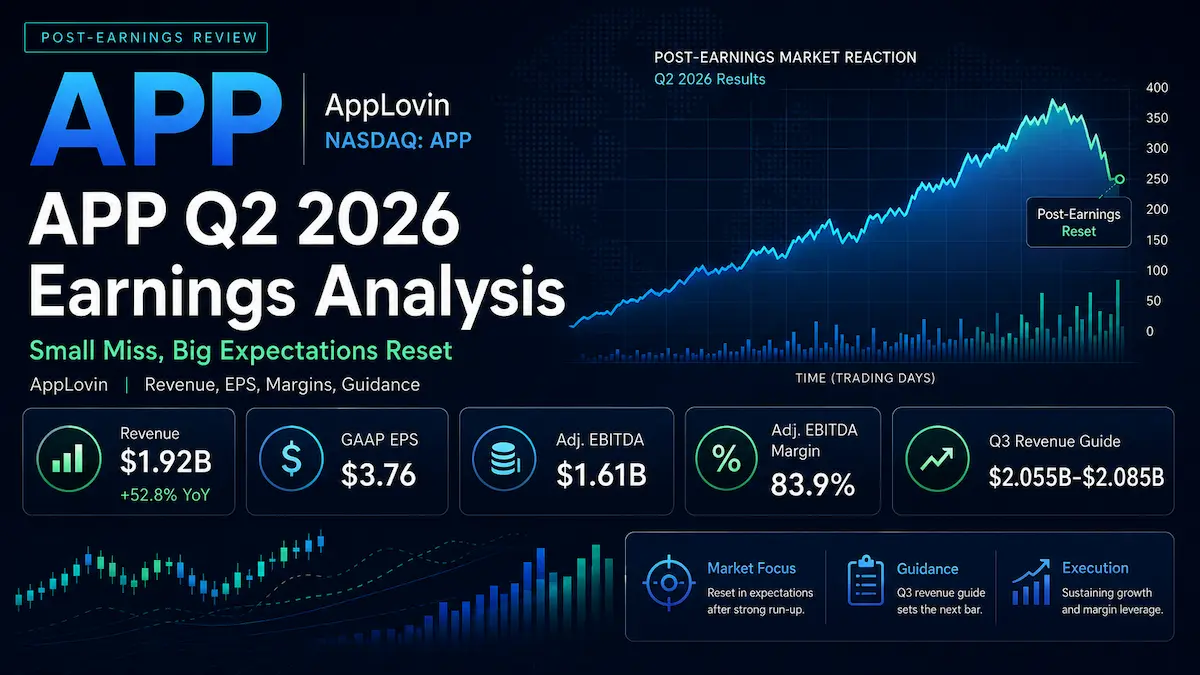
- AppLovin reported Q2 2026 revenue of $1.9237 billion, up 52.8% year over year, but roughly $16.3 million below the $1.94 billion FactSet consensus.
- GAAP diluted EPS was $3.76, in line with consensus. AppLovin did not report a separate adjusted EPS figure, despite some media coverage labeling the number as adjusted.
- Adjusted EBITDA reached $1.6138 billion at an 83.9% margin, only $1.2 million below the low end of management’s prior range, while GAAP operating margin expanded to 77.7%.
- The Q3 revenue midpoint of $2.070 billion was only about 0.5% below consensus, but the adjusted EBITDA midpoint was about 2.0% below expectations, reinforcing concern about compute investment and model-release timing.
- The approximately 20% post-earnings share-price decline reflected a reset in execution confidence and consumer-ad expectations, not a collapse in demand or headline profitability.
AppLovin’s second-quarter report was not a weak set of financial statements in absolute terms. Revenue grew more than 50%, GAAP net income exceeded $1.2 billion, and adjusted EBITDA margin remained above 80%. The problem was relative performance. APP had trained investors to expect a recurring beat-and-raise pattern, rapid model-driven acceleration, and a consumer advertising business capable of expanding the company’s addressable market beyond mobile gaming. Q2 2026 interrupted that pattern.
The investment question is therefore not whether AppLovin remains highly profitable. It does. The more important question is whether the earnings model should still be valued as a predictable compounder, or whether investors now need to apply a larger discount for uneven model releases, slower consumer onboarding, higher compute spending, and limited segment disclosure.
1. Core Earnings Breakdown
Revenue and Profitability Analysis
AppLovin generated Q2 revenue of $1.923686 billion, compared with $1.258754 billion a year earlier. That equals 52.8% reported growth and 4.4% sequential growth. The company did not disclose a constant-currency, organic, or separately defined operational growth rate, so the 53% headline figure should be treated strictly as reported growth rather than relabeled as operational growth.
- Gaming advertising remained the majority of revenue. Management said growth was driven by the core gaming business, but the quarter received less model-performance uplift than investors had become accustomed to. Investment view: gaming remains the cash engine, but Q2 demonstrated that its quarterly growth rate can be sensitive to the timing of model releases.
- Consumer advertising delivered record advertiser spend, ending the quarter 28% above Q4 2025 levels even though Q4 is typically the seasonal peak. Investment view: this is encouraging evidence of customer-level traction, but advertiser spend is not the same as AppLovin revenue, and management did not disclose the consumer vertical’s revenue, margin, or percentage of total sales.
- MAX publisher earnings grew at a double-digit rate quarter over quarter, while AppLovin’s share of publisher waterfalls remained consistent. Investment view: these datapoints argue against a broad deterioration in mobile gaming demand or an abrupt competitive share loss, but they do not eliminate the risk of uneven user-acquisition performance between model releases.
GAAP profitability remained exceptional. Operating income was $1.494277 billion, up from $957.682 million. GAAP operating margin was 77.7%, calculated as $1.494277 billion divided by $1.923686 billion, versus 76.1% a year earlier. That represents approximately 160 basis points of year-over-year expansion.
GAAP net income was $1.266538 billion, up 54.5% from reported net income of $819.531 million. On a continuing-operations basis, the cleaner comparison was 64.1% growth from $771.856 million, because the prior-year quarter included income from the divested Apps business. GAAP diluted EPS increased to $3.76 from $2.39.
Adjusted EBITDA was $1.613823 billion, up 58.5%, while adjusted EBITDA margin increased to 83.9% from 80.9%. The adjusted figure excluded, among other items, $85.8 million of stock-based compensation and $32.6 million of amortization, depreciation and write-offs. Stock-based compensation grew 148% year over year, considerably faster than revenue, which is why investors should not treat adjusted EBITDA as interchangeable with GAAP earnings.
Free cash flow was $863.3 million, up 12.4% year over year, but the growth rate materially lagged revenue and EBITDA growth. Free-cash-flow margin fell to 44.9% from 61.0%, and free-cash-flow conversion was 53.5% of adjusted EBITDA. Management attributed the shortfall to the timing of international cash taxes and interest payments and expects full-year conversion to normalize to approximately 75% of adjusted EBITDA. That explanation is plausible, but Q3 cash conversion now becomes a required confirmation point rather than an optional upside metric.
Expectations vs. Actual Results
Metric | Q2 2026 Actual | Expectation or Prior Guide | Result |
|---|---|---|---|
Revenue | $1.9237 billion | $1.94 billion FactSet consensus | ❌ Miss by $16.3 million, or 0.8% |
GAAP diluted EPS | $3.76 | $3.76 FactSet consensus | ➖ In line |
GAAP operating margin | 77.7%, calculated from company-reported figures | No reliable public consensus located | N/M; expanded about 160 bps YoY |
Adjusted EBITDA | $1.6138 billion | Prior company guide of $1.615-$1.645 billion | ❌ $1.2 million below the low end |
Adjusted EBITDA margin | 83.9% | Prior company guide of 84%-85% | ❌ Fractionally below range |
Q3 revenue guidance | $2.055-$2.085 billion | $2.08 billion consensus | ⚠️ Midpoint about 0.5% below |
Q3 adjusted EBITDA guidance | $1.710-$1.740 billion | $1.76 billion consensus | ❌ Midpoint about 2.0% below |
The revenue miss was small in dollars and percentage terms. AppLovin’s revenue also remained within its own prior range of $1.915 billion to $1.945 billion, although it came in about $6.3 million below the range midpoint. The more important miss was the break from management’s historical pattern of exceeding its own guidance. Adjusted EBITDA was only marginally below the low end, but this was symbolically significant for a stock whose valuation had depended on unusually consistent execution.
The EPS result should also be interpreted carefully. The $3.76 figure was GAAP diluted EPS, not a company-reported adjusted EPS measure. It was supported by a 77.7% GAAP operating margin and $62.4 million of other income, compared with other expense in the prior-year period. The earnings quality was therefore strong at the operating level, although cash conversion was temporarily weaker.
The market cared more about guidance, model cadence, and the consumer pipeline than about the in-line EPS result. The Q3 revenue midpoint still implied 7.6% sequential growth and approximately 47% year-over-year growth, but the adjusted EBITDA midpoint implied an 83.3% margin and fell further below consensus than revenue. Investors interpreted that combination as evidence that higher compute spending is arriving before the market has full visibility into the associated revenue payoff.
The stock reaction was materially worse than the headline miss. APP closed at $417.80 before the report, fell roughly 17% in after-hours trading, and traded near $334 around 11:23 a.m. ET on August 6, 2026, a decline of about 20%. This was not adequately explained by the phrase “sell the news.” The decline reflected four specific issues: a broken beat-and-raise pattern, Q3 EBITDA below consensus, slower-than-hoped self-serve consumer adoption, and a valuation that had previously left little room for execution variability.
Earnings Call Highlights
- “The Q2 shortfall came down to timing: meaningful model improvement was lighter during the quarter, and the next material uplift landed just after quarter-end.” 💡 Reading Between the Lines: Management is arguing that demand and competitive position remained intact, but it also confirmed that quarterly growth is partly dependent on an R&D release cadence that cannot be scheduled with precision. The appropriate valuation framework therefore needs a higher execution-risk discount than a conventional recurring-revenue model.
- “Consumer advertiser spend finished 28% above Q4 2025 levels, but the business is not yet large enough to smooth a softer gaming quarter.” 💡 Reading Between the Lines: Consumer traction is real at the spend level, but it has not yet reached sufficient scale to diversify consolidated revenue. Investors should resist converting the 28% spend datapoint into a revenue estimate because AppLovin disclosed neither the revenue base nor its take rate.
- “The near-term consumer strategy is fewer, larger mid-market advertisers acquired through targeted partnerships rather than mass-market SMB onboarding.” 💡 Reading Between the Lines: AppLovin is prioritizing data quality and advertiser success over account count. That may improve model training and lifetime value, but it delays the original market narrative of a rapidly scaling self-serve platform comparable with Meta or Google.
- “Creative remains the biggest onboarding hurdle; AppLovin can generate interactive end cards efficiently but cannot yet consistently produce high-quality 30- to 60-second video out of the box.” 💡 Reading Between the Lines: The bottleneck is not only targeting technology. AppLovin’s mobile-game inventory requires a creative format that many smaller merchants do not possess, limiting conversion from self-service sign-up to scaled spend and protecting incumbent ad platforms in the near term.
- “The SEC concluded its voluntary inquiry with no recommended action, according to the CFO.” 💡 Reading Between the Lines: Based on management’s statement, investors should not continue modeling the reported inquiry as an open enforcement overhang. The more relevant risks are now operating execution, platform dependence, disclosure quality, and the durability of model-driven returns.
2. Deep Business Insights
Hidden Metrics That Matter
First, the free-cash-flow conversion gap was unusually large. Q2 free-cash-flow conversion equaled 53.5%, calculated from company-reported figures as $863.317 million divided by $1.613823 billion of adjusted EBITDA. This compares with management’s expectation of approximately 75% conversion for the full year. The difference is about 21.5 percentage points. Management attributed the gap to tax and interest timing, which means Q3 should show a meaningful rebound. If it does not, investors will need to revisit working-capital, tax, or earnings-quality assumptions.
Second, AppLovin increased investment intensity without sacrificing GAAP margin. R&D expense rose 126.9% to $99.9 million, and R&D intensity increased to 5.2% of revenue from 3.5%, calculated from company-reported figures. Stock-based compensation rose 148.3% to $85.8 million, or 4.5% of revenue versus 2.7% a year earlier. Even with those increases, GAAP operating margin expanded by about 160 basis points. This indicates substantial underlying operating leverage, but it also shows that the next phase of model improvement is becoming more compute- and talent-intensive.
The customer proposition remains differentiated. AppLovin combines user-acquisition demand, MAX monetization supply, transactional feedback, and model optimization within one advertising system. Advertisers choose the platform when it can deliver incremental return on ad spend rather than simply redistribute existing conversions. Publishers choose MAX because higher auction efficiency can raise monetization. The strategic advantage is a reinforcing data loop: more successful advertisers produce more conversion data; better data improves models; better models support higher advertiser spend; and higher demand improves publisher economics.
However, that flywheel is strongest in mobile gaming, where AppLovin has years of data and mature creative formats. In consumer advertising, the flywheel is earlier. Mid-market advertisers can tolerate learning costs and provide richer transaction data, while small merchants may churn before the model reaches their return target. This explains why management is moving away from maximizing self-serve sign-ups and toward partnerships with analytics and attribution providers such as Triple Whale.
Industry Chain Reactions
- ✅ Benefit — Meta Platforms (NASDAQ: META): AppLovin’s admission that SMB onboarding is constrained by video creative, platform awareness, and data scale reduces the immediate risk of a broad migration of long-tail merchant budgets away from Meta. Meta’s mature creative tools, merchant familiarity, and conversion data remain meaningful competitive advantages.
- ❌ Face Pressure — Unity Software (NYSE: U): AppLovin reported double-digit quarter-over-quarter growth in MAX publisher earnings, stable waterfall share, and a post-quarter model uplift that improved gaming campaign performance. Those signals imply continued competitive pressure on Unity’s mobile advertising and monetization products even though the overall market can grow for multiple platforms.
Valuation Framework and Key Risks
At approximately $334.12 per share on August 6, 2026, AppLovin’s market capitalization was about $112.6 billion and its trailing price-to-earnings ratio was approximately 25.7 times. Using management’s $3.7 billion total-debt figure and the reported $3.053 billion cash balance, enterprise value was approximately $113.3 billion.
On an annualized Q2 basis, that valuation equaled approximately 17.5 times enterprise value to adjusted EBITDA, 14.6 times market capitalization to revenue, and a 3.1% annualized free-cash-flow yield. Using the midpoint of Q3 adjusted EBITDA guidance and annualizing it produces an enterprise-value-to-EBITDA multiple of approximately 16.4 times. These are run-rate calculations based on a single quarter or quarterly guidance, not full-year forecasts.
The post-earnings decline removed a substantial portion of the perfection premium, but the valuation still assumes that AppLovin can sustain unusually high margins and compound revenue well above the broader digital-advertising market. Management’s long-term aspiration of roughly 30% annual compounding is central to that thesis. If gaming growth normalizes sharply before consumer revenue becomes material, the current multiple could still compress even after the selloff.
The main upside case is that Q2 was genuinely a timing issue, the early-Q3 model release restores the beat-and-raise cadence, consumer advertisers continue increasing spend from a small base, and normalized free-cash-flow conversion returns to approximately 75%. In that scenario, current valuation metrics could prove conservative relative to sustained 30%-plus growth and low-80% adjusted EBITDA margins.
The main risks are more specific than a generic ad-market slowdown:
- Model-release risk: quarterly growth depends on uncertain R&D outcomes, and management acknowledged that meaningful lifts do not arrive on a fixed schedule.
- Consumer execution risk: the platform is scaling with a limited number of larger advertisers, while SMB creative, awareness, measurement, and implementation remain unresolved.
- Disclosure risk: management does not provide consumer revenue, gaming revenue, advertiser concentration, take-rate, or cohort retention, making it difficult to independently test the diversification thesis.
- Margin risk: training and inference costs are rising. Management still expects low-80% adjusted EBITDA margins over time, but the market will demand evidence that each incremental compute dollar produces durable revenue.
- Platform and regulatory risk: AppLovin remains exposed to mobile operating systems, app stores, privacy rules, publisher relationships, and changes in third-party data access. The SEC inquiry discussed on the call was said to be closed with no recommended action, so it should not be presented as ongoing without contrary verified evidence.
- Capital-allocation risk: AppLovin used $551.3 million for share repurchases and tax withholding in Q2, equal to 63.9% of quarterly free cash flow. Because the disclosed amount combines repurchases with withholding obligations, it cannot be treated as a clean average repurchase price.
The most defensible investment stance after Q2 is neither a reflexive bullish call nor a conclusion that the growth story is broken. The financial engine remains unusually strong, but the burden of proof has shifted. Investors should now require three confirmations: Q3 model-driven reacceleration, a rebound in free-cash-flow conversion, and more measurable evidence that consumer advertising is becoming a meaningful revenue contributor rather than only a promising spend datapoint.
3. Key FAQs
Why did APP stock fall after Q2 2026 earnings?
APP stock fell because revenue narrowly missed consensus, adjusted EBITDA slipped just below management’s prior range, and Q3 adjusted EBITDA guidance was below Wall Street expectations. More importantly, the call revealed that consumer self-serve scaling remains constrained and that gaming growth can vary with model-release timing. The roughly 20% decline represented multiple compression and lower execution confidence, not a collapse in current profitability.
Did AppLovin beat Q2 2026 earnings expectations?
No, the quarter was mixed. Revenue of $1.9237 billion missed the $1.94 billion consensus by approximately 0.8%. GAAP diluted EPS of $3.76 was in line. Adjusted EBITDA of $1.6138 billion was only $1.2 million below the low end of management’s prior guidance. AppLovin did not report a separate adjusted EPS figure.
What is AppLovin’s Q3 2026 guidance and what does it imply?
AppLovin guided to Q3 revenue of $2.055 billion to $2.085 billion and adjusted EBITDA of $1.710 billion to $1.740 billion, with an approximately 83% adjusted EBITDA margin. The revenue midpoint implies 7.6% sequential growth, but it was about 0.5% below consensus; the EBITDA midpoint was about 2.0% below consensus. The guide includes model improvements already launched and higher compute costs, but excludes unlaunched future model releases.
Source data: AppLovin’s official Q2 2026 earnings release, official quarterly results, and official earnings-call materials.
Disclaimer: This article/chart is for educational and informational purposes only and does not constitute investment advice of any kind. Past performance is not indicative of future results. Investors should independently evaluate their own risks.