Key Takeaways
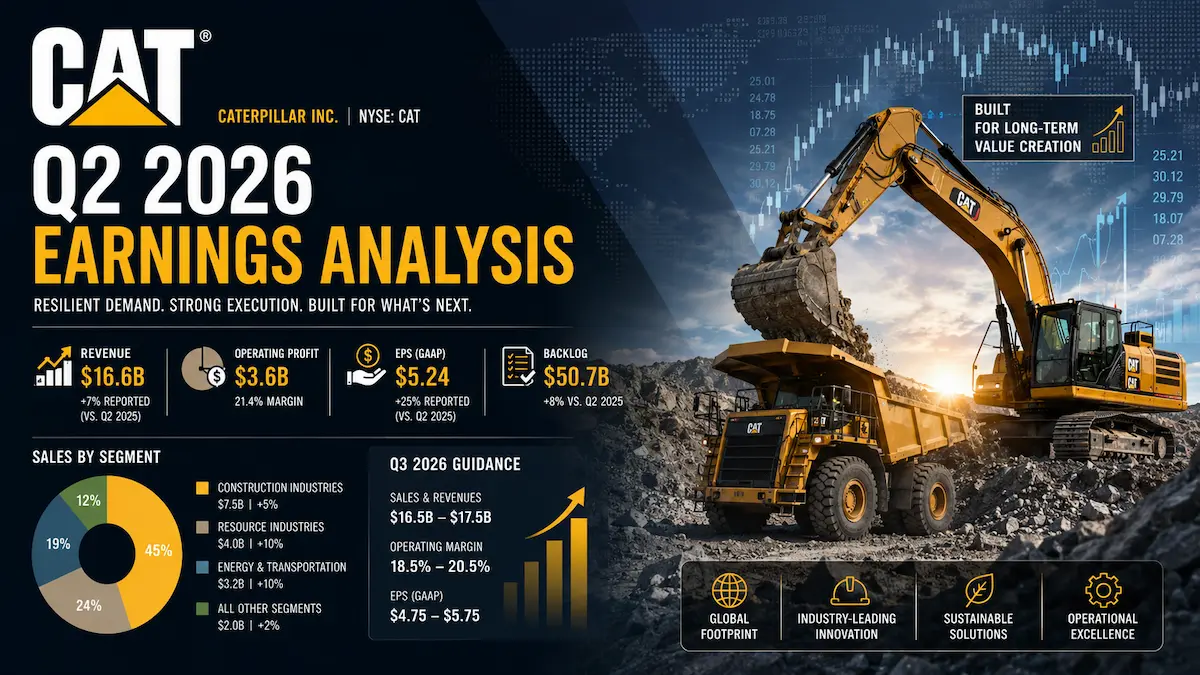
- Caterpillar generated a company-record $20.543 billion of Q2 2026 sales and revenues, up 24% year over year, with adjusted EPS of $8.17 and an adjusted operating profit margin of 21.9%.
- Against FactSet consensus, revenue beat by approximately $1.21 billion, or 6.2%, while adjusted EPS beat by $1.95, or 31.4%. The result was broad-based, but tariff recoveries and lower-than-expected tariff costs amplified the upside.
- Backlog reached $72.1 billion, up 92% year over year and $9.4 billion sequentially. Its breadth across all three primary segments matters more than the headline size, although much of Power & Energy backlog is long-dated.
- Management raised its 2026 sales outlook to mid-to-high-teens growth and expects strong Q3 sales growth with a higher adjusted operating margin than a year earlier.
- At roughly $871 per share, CAT traded near 37.5 times trailing GAAP earnings. The valuation now assumes that Power & Energy is undergoing a durable structural expansion rather than a temporary industrial upcycle.
1. Core Earnings Breakdown
Revenue and Profitability Analysis
Caterpillar’s Q2 2026 sales and revenues increased 24.0% to $20.543 billion from $16.569 billion. The reported increase consisted of $3.113 billion of higher sales volume, $595 million of favorable price realization, $199 million of currency benefit and $67 million of higher Financial Products revenue.
Caterpillar does not disclose a formal organic or operational growth rate. A useful operating-growth proxy is therefore volume plus price divided by prior-year sales: ($3.113 billion + $0.595 billion) / $16.569 billion = 22.4%. This is calculated from company-reported figures. Currency contributed approximately 1.2 percentage points and Financial Products revenue contributed approximately 0.4 percentage points. The distinction matters because nearly all of the reported growth came from demand, mix and pricing rather than translation.
On an external-sales basis, the approximate consolidated revenue mix was Construction Industries at 40.2%, Power & Energy at 33.1%, Resource Industries at 22.2% and Financial Products revenue at 4.7%. These percentages are calculated from company-reported external sales and revenues and may not sum perfectly because of eliminations and rounding.
- Construction Industries: Total segment sales rose 35% to $8.346 billion, including a 50% increase in North America. Segment profit increased 57% to $1.947 billion, and margin expanded 320 basis points to 23.3%. The investment conclusion is that Caterpillar is taking advantage of infrastructure, non-residential construction, data-center projects and rental-fleet loading, but the current mix is more concentrated in mega-project activity than in a broad residential cycle.
- Power & Energy: Total segment sales increased 17% to $8.238 billion, while segment profit rose 30% to $2.027 billion and margin expanded 250 basis points to 24.6%. Power Generation sales grew 29%, Oil and Gas grew 9% and Industrial grew 9%. This segment is increasingly the duration asset in the CAT portfolio because constrained supply, long lead times and an expanding installed base can support both equipment revenue and higher-quality aftermarket service revenue.
- Resource Industries: Total segment sales rose 20% to $4.648 billion, with Mining, Heavy Construction and Quarry & Aggregates up 22% and Rail up 15%. Segment profit increased 23% to $693 million, but margin improved only 40 basis points to 14.9% because unfavorable manufacturing costs were $158 million. The segment delivered demand growth without equivalent operating leverage, making cost execution the key variable for future earnings quality.
- Financial Products: Segment revenue increased 10% to $1.145 billion and segment profit rose 32% to $328 million. Past dues improved to 1.31% from 1.62% a year earlier, while the allowance for credit losses was 0.84% of finance receivables. Credit metrics remain supportive rather than restrictive, which helps Caterpillar’s dealers and customers finance equipment purchases without signaling a material deterioration in end-market quality.
GAAP operating profit increased 50% to $4.295 billion, and GAAP operating margin expanded to 20.9% from 17.3%. Adjusted operating margin was 21.9%, up from 17.6%, because adjusted figures excluded restructuring costs. GAAP diluted EPS was $7.77, while adjusted EPS was $8.17. The $0.40 per-share difference reflects restructuring-related adjustments and should not be confused with the separate benefit from IEEPA tariff recoveries, which remained inside operating profit and adjusted EPS.
Profit quality was strong but not entirely recurring. Higher volume and favorable price realization were the principal operating drivers, yet Q2 operating profit also included $392 million of expected IEEPA tariff recoveries. Other income was $398 million versus $84 million a year earlier, supported by foreign exchange, total-return swaps, investments and interest income. Those items helped EPS beyond the core segment contribution and should be normalized in a forward model.
Expectations vs. Actual Results
Metric | Q2 2026 Actual | Expectation or Prior Setup | Result |
|---|---|---|---|
Sales and revenues | $20.543 billion | $19.335 billion FactSet consensus | ✅ Beat by $1.208 billion, or 6.2% |
Adjusted EPS | $8.17 | $6.22 FactSet consensus | ✅ Beat by $1.95, or 31.4% |
GAAP diluted EPS | $7.77 | No directly comparable standardized consensus used | GAAP result remained below adjusted EPS because of restructuring costs |
Adjusted operating profit margin | 21.9% | Management had expected a year-over-year increase from 17.6% despite approximately $700 million of Q2 tariff costs | ✅ Materially above the prior qualitative setup; tariff costs excluding recoveries were approximately $400 million |
Q3 2026 outlook | Strong sales growth; adjusted operating margin higher year over year; tariff costs similar to Q3 2025 | New management guidance | ✅ Supports continued growth, but no explicit quarterly revenue or EPS range was issued |
Full-year 2026 outlook | Mid-to-high-teens sales growth; adjusted margin near the bottom of the annual target range excluding IEEPA recoveries; tariff costs around $2.2 billion; MP&E free cash flow in the top half of the $6 billion to $15 billion target range | Prior sales outlook was low-double-digit growth | ✅ Revenue outlook raised; margin language remains disciplined rather than euphoric |
The revenue beat came primarily from Construction Industries and Resource Industries, while management characterized Power & Energy as broadly in line with its own expectations. This is important because the quarter was not simply an AI-power surprise. Construction volume, North American end-user sales, rental loading, mining deliveries and rail shipments all contributed.
The EPS beat was larger than the revenue beat for three reasons. First, volume leverage and price realization expanded segment margins. Second, Q2 tariff costs excluding IEEPA recoveries were approximately $400 million, materially below the roughly $700 million management had anticipated. Third, the $392 million of IEEPA recoveries added approximately $0.65 per share, while other income increased by $314 million year over year.
Investors should therefore separate the recurring and non-recurring components. Adjusted EPS of $8.17 exceeded consensus by $1.95. Removing the approximately $0.65 per-share IEEPA recovery produces pro forma adjusted EPS of about $7.52, which would still exceed the $6.22 consensus by $1.30. The recovery represented roughly 33% of the reported EPS surprise: $0.65 / $1.95 = 33.3%, calculated from company-reported figures and consensus data. Even after that adjustment, the quarter was a substantial operating beat, although the lower tariff-cost burden and elevated other income also helped.
The market’s priority has shifted from a single quarter’s machinery sales to backlog conversion, capacity execution and margin durability. The $72.1 billion backlog, long-dated Power & Energy order book and plans to expand turbine and reciprocating-engine capacity are now more relevant to valuation than whether one quarter’s EPS beats consensus by a particular percentage.
CAT shares closed at $876.54 on August 4, up 5.6% from the prior close of $830.03. The stock traded as high as $935, an intraday gain of approximately 12.6%, before giving back part of the move. It closed at $871.08 on August 5. The fade from the intraday peak did not contradict the strength of the results. It reflected a high starting valuation, recognition that tariff recoveries are not recurring, management’s expectation that full-year adjusted margin will be near the bottom of its target range excluding those recoveries, and execution risk as capacity, depreciation, freight and labor costs rise.
Earnings Call Highlights
- “Management described the $72.1 billion backlog increase as broad-based across Power & Energy, Construction Industries and Resource Industries rather than the product of one unusually large order.” 💡 Reading Between the Lines: This reduces the risk that the backlog is only an AI data-center headline. The valuation still depends on Power & Energy duration, but demand breadth gives Caterpillar more ways to absorb delays in any single end market.
- “Power & Energy demand remains supply-constrained, with large gas-prime engine orders extending into late 2028, turbine lead times running even longer and diesel standby orders reaching well into 2028.” 💡 Reading Between the Lines: Long lead times provide revenue visibility and pricing protection through escalator clauses, but they also increase execution, cancellation and customer-concentration risk. A discounted cash-flow model should not treat every backlog dollar as equally near-term or equally certain.
- “Caterpillar restarted its 10-megawatt medium-speed gas engine platform after receiving initial orders, with first shipments planned for Q4 and capacity expected to ramp toward roughly 1.5 gigawatts over 18 months.” 💡 Reading Between the Lines: The strategic value is not only the added capacity. The product fills a gap between high-speed reciprocating engines and industrial gas turbines, improving Caterpillar’s ability to offer a broader behind-the-meter power architecture with limited incremental investment.
- “The dealer-owned Major Projects rental joint venture began receiving equipment and is designed to support multibillion-dollar transportation, energy, manufacturing and data-center projects across North America.” 💡 Reading Between the Lines: Caterpillar is using rental infrastructure to convert its dealer network from a local distribution advantage into a national fleet solution. That can increase share on large projects, but near-term equipment shipments into rental fleets should not be treated as identical to final end-user utilization.
- “Management expects the largest service and aftermarket benefit from the expanding Power & Energy installed base to emerge after 2030, and capacity investments include components and machining needed to support that lifecycle revenue.” 💡 Reading Between the Lines: The capacity program is intended to create a future annuity-like service stream, not merely a one-time equipment surge. This supports a higher quality multiple if utilization remains high, but the cash-flow payoff extends beyond the period covered by most sell-side estimates.
2. Deep Business Insights
Hidden Metrics That Matter
First, the quality of the EPS surprise was better than the headline concern about tariff recoveries implies. Adjusted EPS beat consensus by $1.95. The approximately $0.65 IEEPA recovery accounted for one-third of that surprise, leaving a $1.30 beat after removing the recovery. Calculation: ($8.17 – $0.65) – $6.22 = $1.30, calculated from company-reported figures and FactSet consensus. This confirms that volume, pricing, operating leverage and lower tariff costs were economically meaningful, although investors should not annualize the full quarterly margin.
Second, backlog density reached approximately 3.51 times quarterly revenue: $72.1 billion / $20.543 billion = 3.51, calculated from company-reported figures. That ratio is unusually high for a diversified machinery company, but it is not equivalent to 3.5 quarters of guaranteed revenue. Power & Energy orders extend into 2028, 2029 and beyond, and the backlog includes different cancellation terms, escalators, delivery schedules and margins. The real value is visibility and production planning, not a simple backlog-to-revenue conversion assumption.
Third, cash conversion supported the reported earnings. Enterprise operating cash flow was $4.4 billion versus $3.593 billion of profit attributable to common shareholders, a ratio of approximately 1.22 times: $4.4 billion / $3.593 billion = 1.22, calculated from company-reported figures. MP&E free cash flow was $5.1 billion, and Caterpillar returned $2.2 billion through $1.5 billion of repurchases and $0.7 billion of dividends. The shareholder return represented approximately 43% of quarterly MP&E free cash flow, leaving capacity for investment and balance-sheet flexibility.
Customers choose Caterpillar for more than equipment specifications. The company combines reciprocating engines, industrial gas turbines, diesel standby systems, construction and mining equipment, financing, parts, digital tools and one of the industry’s largest independent dealer networks. That integrated model lowers execution friction for customers building large sites: a contractor or data-center developer can obtain equipment, service, rental capacity and financing from an ecosystem with global parts availability. The dealer network also creates field-service data and customer relationships that are difficult for a single-product competitor to replicate.
The product-mix transformation is therefore central to the investment case. Construction Industries remains the largest external-sales contributor, but Power & Energy increasingly determines duration, backlog and multiple. If equipment shipments produce a large installed base with decades of parts and service demand, Caterpillar’s earnings mix can become less dependent on short-cycle dealer inventory and more dependent on lifecycle economics. The risk is that investors pay for the service stream years before it becomes material.
Industry Chain Reactions
- ✅ Benefit — GE Vernova (NYSE: GEV): Caterpillar’s comments validate a multi-year shortage of dispatchable power equipment for data centers, industrial facilities and grid-constrained regions. The read-through is favorable for gas turbine demand, service backlogs and pricing across the broader power-generation supply chain. CAT’s results do not establish GEV’s company-specific orders, but they strengthen the sector-level demand thesis.
- ❌ Face Pressure — Cummins (NYSE: CMI): Caterpillar’s restarted 10-megawatt gas engine, expanded reciprocating capacity, diesel standby presence and integrated turbine-to-engine portfolio intensify competition in distributed and behind-the-meter power. Cummins retains meaningful technology and customer advantages, but CAT can combine equipment with a global dealer network, financing and major-project rental relationships, raising the competitive bar for large power packages.
Valuation Framework and Key Risks
At approximately $871 per share on August 5, CAT had a market capitalization of roughly $403 billion and traded at about 37.5 times trailing GAAP EPS of $23.23. Using company-reported adjusted EPS of $4.95 for Q3 2025, $5.16 for Q4 2025, $5.54 for Q1 2026 and $8.17 for Q2 2026, trailing adjusted EPS was $23.82. The resulting adjusted trailing P/E was approximately 36.6 times: $871.08 / $23.82, calculated from company-reported figures.
That multiple is not pricing Caterpillar as a conventional mid-cycle heavy-equipment company. It implies several embedded expectations:
- Power & Energy demand remains durable through the 2028-2030 delivery window.
- Capacity additions convert backlog into revenue without material schedule slippage or cost overruns.
- Price escalators protect economics on long-dated orders.
- Construction mega-projects and dealer rental initiatives sustain above-industry growth.
- The expanding installed base eventually produces higher-margin service and aftermarket revenue.
- Industrial cyclicality is offset by infrastructure, energy-security and data-center investment.
The valuation can be supported if CAT evolves from a cyclical machinery producer into a scarce provider of power, equipment and lifecycle service for capital-intensive infrastructure. However, a high multiple also compresses the margin of safety. The stock does not need an earnings decline to underperform; a transition from exceptional growth to merely healthy growth could drive multiple compression.
The principal risks are:
- Tariff normalization: Q2 benefited from $392 million of IEEPA recoveries and lower-than-expected tariff costs. Management still expects approximately $2.2 billion of full-year tariff costs excluding recoveries.
- Capacity-ramp economics: Higher depreciation, freight, labor, supplier costs and startup inefficiencies can reduce incremental margins even when revenue grows.
- Backlog duration and quality: Orders scheduled years ahead carry cancellation, project-delay, permitting, financing and customer-concentration risks. Backlog should be probability-weighted rather than capitalized at face value.
- Data-center infrastructure constraints: Power availability, natural-gas access, transmission, environmental review and local regulation can delay projects even when end-demand remains intact.
- Construction mix: Current strength is concentrated in non-residential, infrastructure and mega-project activity, while residential and other private construction pockets remain less robust.
- Dealer inventory and rental loading: Shipments into dealer or joint-venture fleets support reported sales before final utilization is fully proven, creating potential timing volatility.
- Resource Industries execution: A 20% sales increase produced only 40 basis points of margin expansion because manufacturing costs remained unfavorable.
- Valuation risk: A trailing earnings multiple in the high 30s requires sustained growth and leaves limited tolerance for order deferrals, weaker pricing or lower incremental margins.
A practical valuation framework should use three earnings buckets rather than a single blended multiple: a lower multiple for traditional cyclical construction and mining earnings, a higher multiple for visible Power & Energy equipment backlog, and a premium recurring-revenue multiple only for service cash flows as they are actually realized. The current stock price appears to capitalize a meaningful portion of the third bucket before the post-2030 service opportunity is visible in reported financials.
3. Key FAQs
Did Caterpillar beat Q2 2026 earnings expectations?
Yes. Caterpillar reported Q2 2026 adjusted EPS of $8.17 versus FactSet consensus of $6.22, a $1.95 or 31.4% beat. Sales and revenues were $20.543 billion versus $19.335 billion expected, a beat of approximately $1.208 billion or 6.2%. Even after removing the approximately $0.65-per-share IEEPA recovery, adjusted EPS would have been about $7.52, still materially above consensus.
Why did Caterpillar raise its 2026 revenue outlook?
Management raised its full-year sales and revenues outlook from low-double-digit growth to mid-to-high-teens growth because demand strengthened across all three primary segments. Construction benefited from infrastructure, non-residential projects, data centers and rental-fleet loading; Power & Energy remained capacity-constrained with long order lead times; and Resource Industries saw higher equipment deliveries. Backlog increased to $72.1 billion, up $9.4 billion sequentially and 92% year over year.
Is CAT stock expensive after Q2 2026 earnings?
CAT was valued at approximately 37.5 times trailing GAAP earnings and 36.6 times trailing adjusted earnings at a share price near $871. Those multiples are high for a traditional machinery cycle and imply that investors expect durable Power & Energy growth, successful capacity conversion and a future service-revenue stream from the expanding installed base. The valuation may be justified by structural growth, but it creates significant downside sensitivity to slower backlog conversion, margin pressure or multiple normalization.
Sources: Caterpillar’s official Q2 2026 earnings release, Caterpillar’s official Q2 2026 earnings-call webcast and materials, Caterpillar Investor Relations quarterly results, and the published Q2 2026 earnings-call transcript.
Source note: As of August 6, 2026, Caterpillar’s official quarterly-results and event pages had not yet exposed a downloadable Q2 2026 transcript link. Management commentary in this article was cross-checked against the official earnings release, analyst presentation and webcast materials, with the published transcript used for the Q&A detail.
Disclaimer: This article/chart is for educational and informational purposes only and does not constitute investment advice of any kind. Past performance is not indicative of future results. Investors should independently evaluate their own risks.