

Key Takeaways
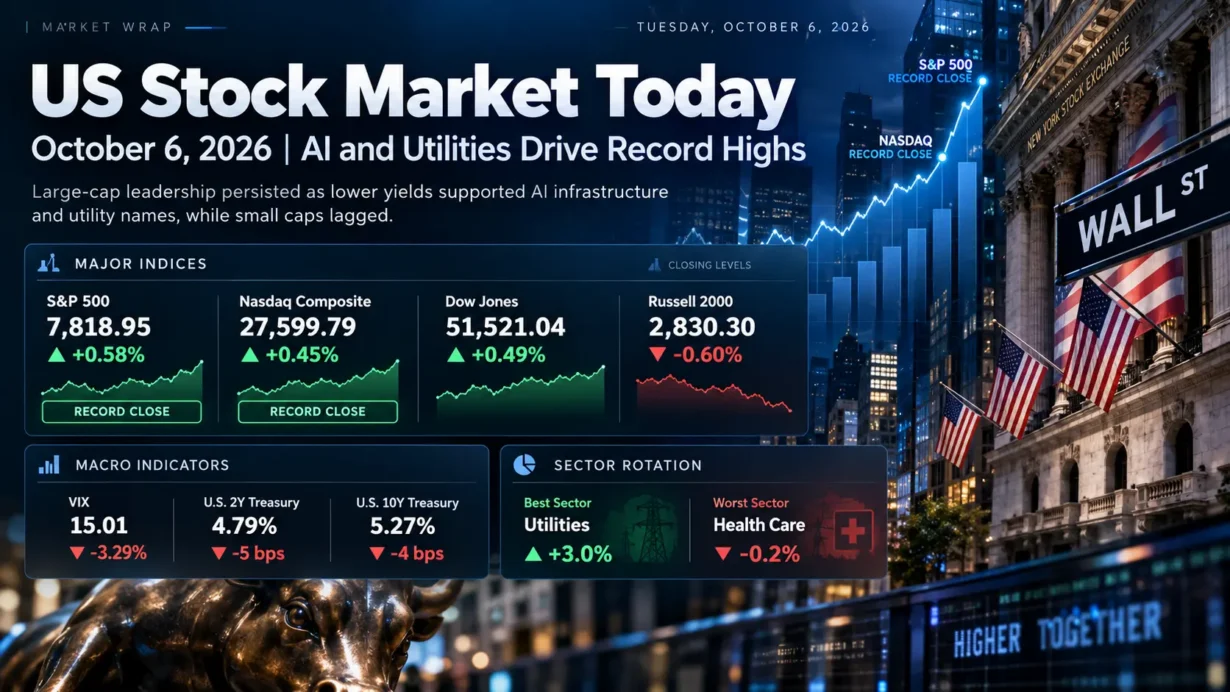
- The S&P 500 rose 0.58% to 7,818.95 and the Nasdaq Composite gained 0.45% to 27,599.79, both at record closing highs. The Dow advanced 0.49% to 51,521.04, while the Russell 2000 fell 0.6% to 2,830.30, highlighting continued large-cap leadership.
- Utilities were the best-performing S&P 500 sector, up 3.0%, while Health Care was the only sector in negative territory, down 0.2%. Constellation Energy’s 12.3% surge after a major Google power agreement was a central driver of the utilities move.
- Lower Treasury yields eased the discount-rate pressure on equities: the U.S. Treasury’s October 6 par curve showed the 2-year yield at 4.79%, down 5 basis points, and the 10-year at 5.27%, down 4 basis points.
- The Cboe VIX closed at 15.01, down 3.29%, consistent with lower near-term hedging demand. However, small-cap weakness and nearly flat Nasdaq advance-decline breadth showed that risk appetite was not uniformly broad.
- Official BEA data showed the August U.S. trade deficit widened 13.7% to $105.6 billion as imports rose 4.3% to $420.8 billion and exports increased 1.4% to $315.2 billion, reinforcing a picture of resilient demand but a more complicated inflation and growth mix.
1. Market Capital Flows and Sector Rotation
Tuesday’s tape was better described as selective risk-on than as an indiscriminate beta rally. Utilities led the 11 S&P 500 sectors with a 3.0% gain, while Health Care fell 0.2% and was the only sector to finish lower. The unusual combination matters: a traditionally defensive sector led because long-duration power contracts and AI-linked electricity demand created a growth-like catalyst, while another defensive sector lagged. Large caps clearly outperformed small caps, with the S&P 500 up 0.58% against a 0.6% decline in the Russell 2000. Large-cap growth also retained an edge over value proxies as AI-linked megacaps advanced, but the positive performance of rate-sensitive utilities shows that the day was not simply a growth-versus-value factor trade. Cyclical participation was positive in parts of the market, yet the small-cap decline argues against calling the session a broad cyclical breakout.
Market breadth was constructive on the NYSE but much less convincing on the Nasdaq. NYSE advancers outnumbered decliners by 1.93 to 1, while Nasdaq breadth was only 1.01 to 1, with 2,394 stocks advancing and 2,378 declining. The S&P 500 registered 23 new 52-week highs and two new lows, but the Nasdaq Composite recorded 61 new highs against 182 new lows. U.S. exchange volume totaled 16.50 billion shares, below the 20-session average of 17.51 billion. The combination suggests that the record index closes had meaningful participation, but not the kind of uniformly strong breadth and volume that would confirm a fully broad-based risk expansion.
Institutional Flow Insight: The most plausible allocation logic was a combination of lower rate sensitivity and improved earnings visibility in specific AI infrastructure beneficiaries. Falling Treasury yields mechanically improve the relative valuation support for long-duration equities, while contracted power demand can make selected utilities look less like pure bond proxies and more like infrastructure growth assets. Small caps remained disadvantaged by higher financing sensitivity with Treasury yields still elevated in absolute terms. Early-quarter rebalancing may also have influenced flows, but the tape alone cannot confirm that. The key distinction is that institutions appeared willing to add risk where cash-flow visibility, structural demand or duration support improved, rather than lifting all economically sensitive assets together.
2. Decoding the Biggest Market Movers
Constellation Energy (CEG)
Constellation Energy closed 12.3% higher after announcing a long-term strategic clean-energy agreement with Google. The companies said a 20-year power purchase agreement will support more than $4.3 billion of Constellation investment to add 890 MW of new nuclear capacity through uprates at 11 existing units in Illinois, Pennsylvania and New Jersey, with the first uprate expected by 2028. A separate 15-year energy supply agreement covers another 2,700 MW of existing PJM generation, bringing the announced commercial relationship to 3,590 MW. The structure is important because it combines incremental physical capacity with longer-duration revenue support for existing assets rather than relying solely on greenfield generation.
The announcement landed against an already improving earnings backdrop. In its latest official quarterly release, Constellation reported second-quarter GAAP net income of $1.42 per share and adjusted operating earnings of $2.55 per share, then raised full-year adjusted operating EPS guidance to $11.50-$12.50. It also said it had signed another 920 MW of long-term power purchase agreements during the quarter. Those verified figures show that the Google agreement extends an existing contracting strategy rather than creating an entirely new earnings narrative. Importantly, the company did not disclose enough project-level economics to quantify the Google deal’s near-term EPS contribution, so investors should avoid converting the headline megawatts directly into an earnings estimate.
For the broader market, CEG’s move helps explain why Utilities led the S&P 500. The read-through is that dispatchable power, nuclear uprates and long-term contracted generation are increasingly being valued as part of the AI infrastructure stack. That can support higher valuation premiums for power suppliers with scarce assets and credible contracting opportunities, but the trade still carries execution, capital-spending, regulatory and project-timing risks.
Marvell Technology (MRVL)
Marvell Technology rose 5.8% to $287.01 after its October 6 Investor Day, where management raised its fiscal 2028 revenue outlook to approximately $20 billion from the roughly $18 billion outlook discussed after its August earnings report. Management said approximately $18 billion of that fiscal 2028 total is expected to come from data center revenue, with the latest increase driven by connectivity demand including scale-out optics, scale-up optics and switching.
The revised outlook is more credible when viewed against Marvell’s latest reported results rather than in isolation. The company’s official August 27 earnings release showed fiscal second-quarter 2027 revenue of $2.739 billion, up 37% year over year, with data center revenue growth of 46%. GAAP gross margin was 53.1%, non-GAAP gross margin was 58.9%, GAAP diluted EPS was $0.33 and non-GAAP diluted EPS was $0.94. For fiscal Q3, Marvell guided revenue to $3.150 billion plus or minus 5%, GAAP gross margin to 52.9%-53.9%, non-GAAP gross margin to 57.5%-58.5%, GAAP diluted EPS to $0.53 plus or minus $0.05 and non-GAAP diluted EPS to $1.10 plus or minus $0.05.
The market significance extended beyond MRVL. Broadcom also advanced roughly 4%, indicating a positive read-through for custom silicon and AI connectivity suppliers. The strategic point is that AI infrastructure spending is increasingly distributed across compute, networking, optical interconnect and power rather than being captured by one hardware category. Still, Marvell’s longer-dated targets remain management forecasts, not realized revenue; valuation discipline should therefore distinguish between current execution, near-term guidance and multi-year opportunity.
3. Macro Indicators and Market Outlook
The Cboe VIX closed at 15.01, down 0.51 point or 3.29%. That direction was consistent with the rise in the S&P 500 and suggests less immediate demand for index-level downside protection. A VIX near 15 does not mean macro risk has disappeared, however. With equities near records, a low volatility premium can leave the market more sensitive to an abrupt repricing in rates, energy or policy expectations if investors have reduced hedges into strength.
The U.S. Treasury’s official daily par yield curve showed the 2-year yield at 4.79%, down from 4.84% on October 5, and the 10-year at 5.27%, down from 5.31%. The resulting 2s10s spread was about +48 basis points. The decline at both maturities eased pressure on equity discount rates after the Federal Reserve’s September 16 decision to raise the federal funds target range by 25 basis points to 3.75%-4.00%. The move should not be read as proof of a coming rate cut or as a definitive signal that the tightening cycle is over. Rather, it reflects a one-day repricing of the balance among inflation risk, growth expectations, energy prices and term premium.
The October 6 trade report added to that ambiguity. The August goods and services deficit widened to $105.6 billion from a revised $92.8 billion in July. Imports rose 4.3% to $420.8 billion while exports increased 1.4% to $315.2 billion. Stronger imports are consistent with resilient domestic demand, but a larger trade gap can subtract from GDP accounting, while strong demand and supply constraints can keep inflation sensitivity elevated. For equities, the cleaner near-term signal was therefore the decline in yields rather than any single interpretation of the trade balance.
Upcoming Economic Data & Catalysts:
- FOMC Minutes, September 15-16 Meeting (Release date: October 7, 2026): Investors will focus on the discussion behind the September rate increase, the Committee’s assessment of inflation risks and the conditions that could alter the policy path. The minutes may affect front-end Treasury pricing and the equity duration trade.
- Consumer Price Index for September 2026 (Release date: October 14, 2026): The BLS release will be the next major inflation test. Markets will scrutinize headline and core inflation, especially whether energy-related price pressure is broadening into services or other categories that could influence the Fed’s reaction function.
Market Insights:
The session was not merely a handful of megacaps dragging the indexes higher, because NYSE breadth was clearly positive and ten of 11 S&P 500 sectors advanced. But it was also not a fully broad risk-on move: the Russell 2000 fell, Nasdaq advance-decline breadth was nearly flat and Nasdaq new lows exceeded new highs. The more accurate interpretation is a selective broadening led by AI infrastructure, rate-sensitive assets and large-cap earnings visibility. Risks to that pattern include a renewed jump in Treasury yields, weaker breadth, downward earnings revisions, a policy surprise, a material VIX breakout or valuation compression in crowded AI-linked names.
Trading & Investment Strategy:
With the S&P 500 and Nasdaq at records, risk management matters more than chasing index momentum. Investors can consider keeping position sizes proportional to volatility, using staged entries rather than full allocations at extended prices, and favoring sectors where earnings visibility or contracted demand supports the thesis. Existing winners should still be governed by predefined loss limits or thesis-based exit rules. Around the FOMC minutes and CPI, reducing oversized event exposure may be more prudent than adding leverage. The strongest setups are likely to be those where fundamental revisions confirm the price move; headline-driven gaps without measurable earnings support deserve more conservative sizing.
4. Key FAQs About the US Stock Market Today
Why did the US stock market move on 6 October 2026?
U.S. stocks rose as Treasury yields eased, crude-price pressure stabilized and investors returned to AI-linked growth themes ahead of third-quarter earnings season. Company-specific catalysts amplified the move: Constellation Energy’s Google power agreement lifted Utilities, while Marvell’s higher fiscal 2028 revenue outlook supported semiconductor and AI-connectivity sentiment. The broader macro backdrop remained mixed because the U.S. trade deficit widened sharply even as bond yields declined.
Which sectors performed best and worst in the US stock market on 6 October 2026?
Utilities were the strongest S&P 500 sector, rising 3.0%, while Health Care was the weakest and the only sector to decline, falling 0.2%. Utilities benefited from lower Treasury yields and a major AI-power catalyst from Constellation Energy, making the rotation more about power scarcity, contract visibility and rate sensitivity than a conventional defensive bid.
What should investors watch after the US stock market close on 6 October 2026?
The immediate catalyst is the Federal Reserve’s September meeting minutes on October 7, followed by September CPI on October 14. Investors should also watch whether the 10-year Treasury yield can remain below its recent highs, whether small caps begin to participate, whether Nasdaq breadth improves and whether upcoming earnings revisions validate the market’s elevated AI and infrastructure expectations.
Disclaimer: This article is intended solely for the exchange of investment ideas and does not constitute investment advice of any kind.