
Key Takeaways
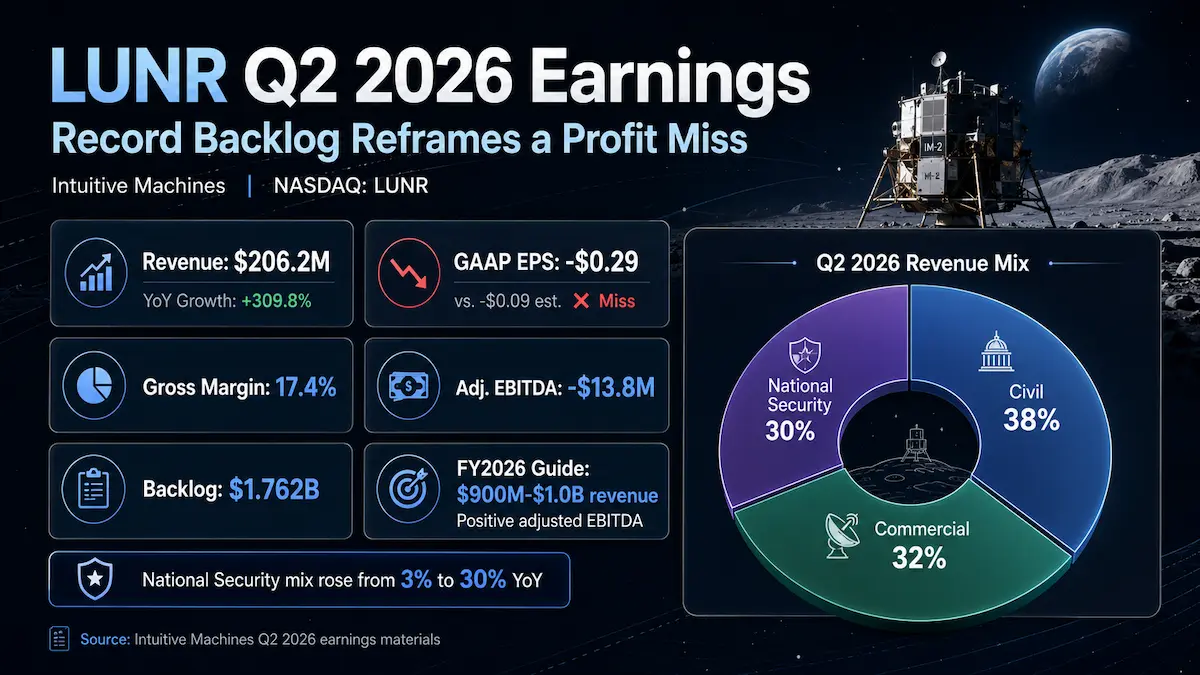
- Intuitive Machines reported Q2 2026 revenue of $206.168 million, up 309.8% year over year, but below the $216.3 million FactSet consensus. GAAP Class A EPS of -$0.29 also missed the -$0.09 consensus.
- Gross margin improved sharply to 17.4% from approximately -23.5% a year earlier, yet adjusted EBITDA was -$13.799 million versus a roughly +$3.2 million FactSet expectation, exposing the gap between stronger gross economics and still-heavy operating investment.
- Quarter-end backlog reached $1.762 billion, but only $814.7 million qualified as remaining performance obligations, making backlog quality and conversion timing more important than the headline backlog number alone.
- Management reaffirmed full-year 2026 revenue guidance of $900 million to $1.0 billion and positive adjusted EBITDA. It did not issue a formal Q3 revenue, EPS or operating-margin guide.
- The stock initially gapped lower after the release, then reversed higher and closed August 17 at $20.38, about 20.2% above its August 12 pre-earnings close. The market ultimately rewarded contract visibility and strategic diversification more than the quarter’s headline misses.
1. Core Earnings Breakdown
Revenue and Profitability Analysis
Intuitive Machines generated Q2 2026 revenue of $206.168 million, compared with $50.313 million in Q2 2025, representing 309.8% year-over-year growth. The step-change was overwhelmingly acquisition-driven: the company’s Form 10-Q states that Lanteris contributed $166.7 million of Q2 revenue. That contribution equaled approximately 80.9% of consolidated revenue, calculated as $166.7 million divided by $206.168 million from company-reported figures.
This distinction matters. Consolidated growth was spectacular, but investors should not read 310% growth as an organic run-rate. Subtracting the disclosed $166.7 million Lanteris contribution leaves approximately $39.4 million of other Q2 revenue, versus $50.3 million of total company revenue a year earlier. That residual comparison implies a 21.6% decline, calculated from company-reported figures, but it is not a clean organic-growth metric because the portfolio also changed through other acquisitions and program timing. The useful conclusion is narrower: Lanteris, rather than legacy lunar activity, created the majority of the quarter’s scale.
By revenue type, product revenue was $166.735 million, or 80.9% of total revenue. Product cost of revenue was $119.328 million, implying product gross profit of $47.407 million and a 28.4% product gross margin, calculated from company-reported figures. This is strategically important because spacecraft manufacturing now provides a positive gross-profit engine large enough to absorb some of the volatility in mission services.
Service revenue was $36.677 million, or 17.8% of total revenue. Direct and affiliated service costs totaled $48.214 million, implying a service gross loss of $11.537 million and a -31.5% service gross margin, calculated from company-reported figures. The investment judgment is clear: services remain the part of the model where execution risk, milestone timing and loss-contract accounting can overwhelm revenue growth.
Grant revenue was $2.756 million, or 1.3% of total revenue, with $2.760 million of associated cost. It was essentially gross-margin neutral and is not currently a meaningful driver of valuation.
On an end-customer basis, the 10-Q disaggregated revenue from contracts with customers into $76.281 million of civil revenue, $66.279 million of commercial revenue and $60.852 million of national-security revenue. Adding grant revenue brings the civil-related mix to roughly 38%, consistent with the company’s earnings presentation. Commercial represented about 32% and national security about 30% of the quarter.
- Civil: $76.281 million of contract revenue, with grant revenue taking the broader civil-related mix to roughly 38%. NASA and lunar programs remain foundational, but they no longer dominate the revenue base. That diversification reduces dependence on a single mission cadence.
- Commercial: $66.279 million, approximately 32% of contract revenue. The commercial contribution validates demand for the Lanteris spacecraft portfolio and the IM-1300-class platform, but large multi-satellite awards can make quarterly revenue recognition lumpy and customer concentration worth monitoring.
- National security: $60.852 million, approximately 30% of contract revenue, versus only $1.698 million a year earlier. This is arguably the most important strategic mix shift because it moves LUNR from a lunar-services narrative toward a broader defense-space manufacturing story, while also increasing exposure to government procurement timing and contract-termination risk.
Consolidated gross profit was $35.866 million, translating to a 17.4% gross margin, compared with a gross loss of $11.843 million and roughly -23.5% margin in the prior-year quarter. That is the strongest evidence that the post-Lanteris business can support materially better unit economics. However, the improvement did not flow through to operating profitability. General and administrative expense reached $60.346 million, research and development was $7.729 million, and depreciation and amortization was $14.927 million. Operating loss was $47.136 million, equal to a -22.9% operating margin, calculated from company-reported figures.
The company also reported a $62.841 million net loss and a $46.612 million net loss attributable to Class A common shareholders. GAAP Class A EPS was -$0.29. Adjusted EBITDA improved to -$13.799 million from -$25.368 million a year earlier, but profitability still lagged the scale of the revenue expansion.
Expectations vs. Actual Results
- Revenue: $206.168 million actual versus approximately $216.3 million FactSet consensus — ❌ Miss by $10.132 million, or 4.7%.
- GAAP Class A EPS: -$0.29 actual versus approximately -$0.09 FactSet consensus — ❌ Miss by $0.20 per share.
- GAAP operating margin: -22.9% actual, calculated from $47.136 million of operating loss divided by $206.168 million of revenue. A dependable public pre-earnings consensus for GAAP operating margin was not identified in the reviewed sources, so no comparison figure is fabricated.
- Adjusted EBITDA: -$13.799 million actual versus approximately +$3.2 million FactSet consensus — ❌ Material miss. Actual adjusted EBITDA margin was -6.7%, calculated from company-reported figures, versus an implied consensus margin of roughly +1.5% using the FactSet revenue and adjusted EBITDA expectations.
- Full-year 2026 guidance: $900 million to $1.0 billion of revenue and positive adjusted EBITDA — ↔ Reaffirmed.
- Q3 guidance: No formal Q3 revenue, EPS or operating-margin range was issued.
The revenue miss was not evidence of weak demand. Management’s call commentary pointed instead to procurement timing and the timing of converting authorizations to proceed into definitized contracts, which can shift revenue between quarters. The more consequential profitability miss came from the operating-cost structure and program adjustments. Management said the quarter included an approximately $14.7 million IM-4 estimate-at-completion adjustment related to accommodating payload changes, while G&A included roughly $11 million of stock-based compensation and approximately $8 million of acquisition and integration expense.
The market therefore had to decide which signal mattered most: the income statement, or the forward contract base. For a company that has just transformed its revenue mix through Lanteris and is still integrating multiple acquisitions, EPS is a noisy short-term metric. Gross margin, adjusted EBITDA conversion, backlog quality, production throughput and cash burn are more informative. At the same time, EPS cannot be dismissed because equity issuance is financing a meaningful portion of the growth strategy, making per-share economics central to the investment case.
The price action captured that debate. LUNR closed at $16.95 on August 12, before the August 13 pre-market release. It opened August 13 at $14.29 and traded as low as $14.18, an intraday decline of roughly 16% from the prior close, before reversing to finish at $17.56, up 3.6% for the day. It then closed at $19.01 on August 14 and $20.38 on August 17. From the August 12 close through August 17, the stock rose approximately 20.2%.
This was not a conventional “sell the news” pattern. The initial drop was consistent with disappointment over the revenue, EPS and adjusted EBITDA misses, the IM-4 cost adjustment, negative free cash flow, elevated capital spending and recent ATM dilution. The reversal suggests investors assigned greater weight to the $1.8 billion backlog, the broadened commercial and national-security mix, management’s reaffirmed full-year outlook and additional contract visibility.
Investors should be careful with the August 17 announcement of a greater-than-$600 million authorization to proceed for a multi-satellite communications program. The Q2 call had already described a greater-than-$600 million three-satellite GEO communications award, and the 10-Q explained that approximately $587 million of backlog related to a multi-satellite program that had not yet met the accounting definition of remaining performance obligations. The August 17 announcement appears closely related to that Q2 program, but the company did not explicitly state in the announcement that they are identical. Until management confirms otherwise, adding another $600 million on top of the reported Q2 backlog would risk double-counting.
Earnings Call Highlights
- “Management has very strong visibility to the low end of the 2026 revenue range, while reaching the midpoint depends partly on procurement timing and the definitization of authorizations to proceed.”
💡 Reading Between the Lines: Management is signaling that demand is not the primary constraint; administrative conversion and contract timing are. That supports the low end of guidance but makes the upper half of the range less bankable until awards turn into executable revenue schedules. - “The strategy is to integrate spacecraft build, connectivity and operations, with the full five-satellite lunar communications constellation targeted for operational capability in 2028.”
💡 Reading Between the Lines: LUNR is trying to migrate from project-based hardware and mission revenue toward recurring infrastructure revenue. A successful network-services mix could justify a higher-quality valuation multiple, but it requires capital expenditure well before recurring economics are proven. - “More than 70 IM-300 spacecraft are under contract, the non-recurring engineering burden for the first batch has largely been retired, and commonality should improve production economics.”
💡 Reading Between the Lines: The margin thesis increasingly depends on manufacturing repetition rather than bespoke engineering. If common designs, procurement scale and factory utilization work as planned, gross margin can expand; if production cadence slips, the same fixed-cost base can magnify downside. - “Q2 cash deployment included approximately $17 million for accelerated inventory and infrastructure, about $8 million for acquisition and integration activity, an approximately $17 million SpaceX milestone, and roughly $24 million of capital expenditures; capex is expected to remain elevated in coming quarters.”
💡 Reading Between the Lines: A meaningful share of cash burn is deliberate capacity building rather than simple operating deterioration. The risk is timing: if backlog conversion or milestone receipts slip, the company may have to keep using equity financing before the investments generate adequate returns. - “IM-3 is scheduled for the January-to-March 2027 window, with hot-fire testing, integrated navigation-sensor testing and an October delta flight-readiness review among the remaining milestones.”
💡 Reading Between the Lines: The investment case is now diversified enough that one lunar mission no longer determines the entire revenue story, but mission execution still matters disproportionately to credibility, NASA relationships and the future economics of lunar infrastructure.
2. Deep Business Insights
Hidden Metrics That Matter
Backlog quality is more important than backlog size. Intuitive Machines reported $1.76195 billion of backlog at June 30, but only $814.7 million of remaining performance obligations, or RPO. RPO divided by backlog equals 46.2% ($814.7 million ÷ $1.76195 billion), calculated from company-reported figures. That means approximately $947.3 million, or 53.8% of backlog, sat outside RPO at quarter-end.
The 10-Q explains the gap: roughly $587 million related to a multi-satellite program, approximately $316 million represented funded service-contract value recognized only as services are performed and billable, and about $44.3 million was constrained variable consideration. This does not make the backlog invalid, but it does mean that a dollar of backlog should not automatically be valued like a dollar of GAAP RPO. Investors should assign different confidence weights based on contract definitization, cancellation rights, performance conditions and revenue-recognition mechanics.
The second hidden metric is the H2 execution hurdle embedded in unchanged guidance. First-half 2026 revenue was $392.898 million. To reach the $900 million to $1.0 billion full-year range, H2 must therefore produce $507.102 million to $607.102 million of revenue, calculated from company-reported figures. That is 29.1% to 54.5% more revenue than H1. First-half adjusted EBITDA was -$11.132 million, so H2 adjusted EBITDA must exceed +$11.132 million for full-year adjusted EBITDA to finish above zero. On the required H2 revenue range, that implies a minimum H2 adjusted EBITDA margin of approximately 1.8% to 2.2%, calculated from company-reported figures.
That hurdle is achievable mathematically, but Q2’s -6.7% adjusted EBITDA margin shows the business still needs a meaningful mix and execution improvement. The most important variables are product-manufacturing scale, fewer loss-contract adjustments, milestone timing and tighter control of acquisition-related operating costs.
Why would customers choose Intuitive Machines? The differentiator is increasingly the breadth of the stack. Through Lanteris, the company gained a high-power spacecraft manufacturing platform; through KinetX, it expanded navigation and mission-design capability; through Goonhilly and COMSAT, it is building ground-station and communications infrastructure; and its legacy Nova-C, CLPS and lunar-network activities provide flight operations and lunar-domain expertise. In practical terms, a government or commercial customer can buy more of the spacecraft lifecycle from one supplier, reducing interface risk across bus design, navigation, mission operations and communications.
That integrated model becomes more valuable if the company can prove schedule discipline. Management’s emphasis on inventory, factory capacity and common spacecraft platforms indicates that the competitive goal is not merely technical differentiation; it is faster production with repeatable economics. The long-term moat will therefore be measured by delivery cadence and gross margin as much as by engineering capability.
Industry Chain Reactions
- ✅ Benefit — L3Harris Technologies (NYSE: LHX): Intuitive Machines was selected by L3Harris to design, build and deliver 18 spacecraft platforms for the Space Development Agency’s Tranche 3 Tracking Layer architecture. LUNR’s expanding manufacturing capacity and IM-300 production scale can support L3Harris execution on proliferated defense constellations. The read-through is indirect rather than a guaranteed earnings benefit for L3Harris, but successful delivery would reduce one spacecraft-bus execution risk inside a major national-security program.
- ❌ Face Pressure — Rocket Lab USA (NASDAQ: RKLB): Rocket Lab already competes in proliferated LEO constellations and holds a $515 million SDA Tranche 2 Transport Layer-Beta spacecraft contract. LUNR’s more than 70 IM-300 spacecraft under contract, broader national-security exposure and expanded factory footprint increase competition for future SDA, Golden Dome and adjacent defense-space awards. This is not a one-for-one competitive map—Rocket Lab retains launch and vertically integrated component advantages—but LUNR is becoming a more credible rival for satellite-prime and bus work.
Valuation Framework and Key Risks
At the August 17 close of $20.38, LUNR’s valuation depends heavily on which share-count lens an investor uses. The company reported 173.231 million Class A shares and 55.693 million Class C shares outstanding as of August 6. Because the Class C shares are paired with OpCo units that can generally be exchanged into Class A shares on a one-for-one basis, an economic common-equivalent view is more informative than a Class A-only view for long-term dilution analysis.
Using $20.38 per share, 173.231 million Class A shares imply approximately $3.53 billion of Class A equity value, calculated from company-reported share counts and the market price. Including the 55.693 million Class C/common-unit equivalents produces approximately 228.924 million common-equivalent shares and about $4.67 billion of economic common-equivalent equity value, calculated from company-reported figures and the market price. This second figure is not a reported GAAP market capitalization and still excludes other potential dilution from restricted stock, warrants and convertible securities.
Against the $900 million to $1.0 billion 2026 revenue guide, the Class A-only value equates to approximately 3.5x to 3.9x sales. The economic common-equivalent value equates to approximately 4.7x to 5.2x sales. Those are calculated valuation ratios, not company guidance.
The market is therefore already pricing more than simple 2026 revenue delivery. The bull case requires three things: backlog conversion without major schedule slippage, sustained product gross margins as manufacturing scales, and a credible path from hardware projects to recurring communications, relay and positioning services. If those conditions emerge together, current sales multiples could be justified by improving margin quality and recurring revenue.
The bear case is equally concrete. As of June 30, cash was $367.354 million and long-term debt was $336.352 million, leaving only a modest cash-over-debt cushion before considering post-quarter acquisitions. Q2 operating cash use was $59.802 million, and first-half free cash flow was -$145.819 million. The company sold 8.259 million Class A shares through its ATM during Q2 for approximately $235.2 million of net proceeds, after also issuing 11.574 million Class A shares in a February financing. Growth is being funded partly with equity, so a high enterprise-growth rate does not automatically translate into equally strong per-share compounding.
Contract accounting is another risk. The 10-Q states that both IM-3 and IM-4 were in loss positions at June 30, and Q2 included a sizable IM-4 estimate-at-completion adjustment. If fixed-price programs continue to require engineering changes, revenue growth can coexist with weak margins. Finally, the backlog itself carries timing and definitization risk, while national-security and NASA programs remain subject to appropriations, procurement decisions and termination provisions.
At $20.38, LUNR is no longer valued like a binary lunar-mission company. The stock increasingly discounts a successful transition into a diversified space prime. That transition is plausible, but investors should demand evidence in gross-margin durability, adjusted EBITDA conversion and per-share cash generation before treating the $1.8 billion backlog as equivalent to fully de-risked future revenue.
3. Key FAQs
Did LUNR beat Q2 2026 earnings estimates?
No. Intuitive Machines reported $206.168 million of Q2 2026 revenue versus approximately $216.3 million expected by FactSet, a 4.7% miss. GAAP Class A EPS was -$0.29 versus approximately -$0.09 expected. Adjusted EBITDA of -$13.799 million also fell materially below the roughly +$3.2 million FactSet expectation. The strategically positive elements were the 17.4% gross margin, record backlog and improved revenue diversification.
What is Intuitive Machines’ 2026 revenue guidance after Q2 2026 earnings?
Management reaffirmed full-year 2026 revenue guidance of $900 million to $1.0 billion and positive adjusted EBITDA. It did not provide a formal Q3 revenue or EPS range. Because H1 revenue was $392.898 million, the company needs $507.102 million to $607.102 million of H2 revenue to reach the full-year range, calculated from company-reported figures.
Why did LUNR stock rise after missing Q2 2026 earnings expectations?
The stock initially reacted negatively to the revenue, EPS and adjusted EBITDA misses, but quickly reversed as investors focused on the $1.762 billion backlog, commercial and national-security diversification, a reaffirmed full-year outlook and additional visibility around a greater-than-$600 million multi-satellite communications program. LUNR moved from a $16.95 pre-earnings close on August 12 to $20.38 by August 17. Investors should not automatically add the August 17 greater-than-$600 million program to Q2 backlog, however, because the company had already discussed a similarly sized commercial multi-satellite award during the Q2 reporting cycle and has not explicitly confirmed that the figures are incremental.
Source methodology: Intuitive Machines’ official Q2 2026 earnings release, official Q2 earnings-call event page and webcast materials, Q2 2026 Form 10-Q filed with the SEC, and the company’s August 17 multi-satellite communications announcement are the controlling sources for financial and strategic facts. The official IR page provides a webcast replay but does not publish a written transcript, so management commentary is paraphrased from the full third-party earnings-call transcript and cross-checked against the official materials; where wording differs, official company filings control.
Disclaimer: This article/chart is for educational and informational purposes only and does not constitute investment advice of any kind. Past performance is not indicative of future results. Investors should independently evaluate their own risks.