Key Takeaways
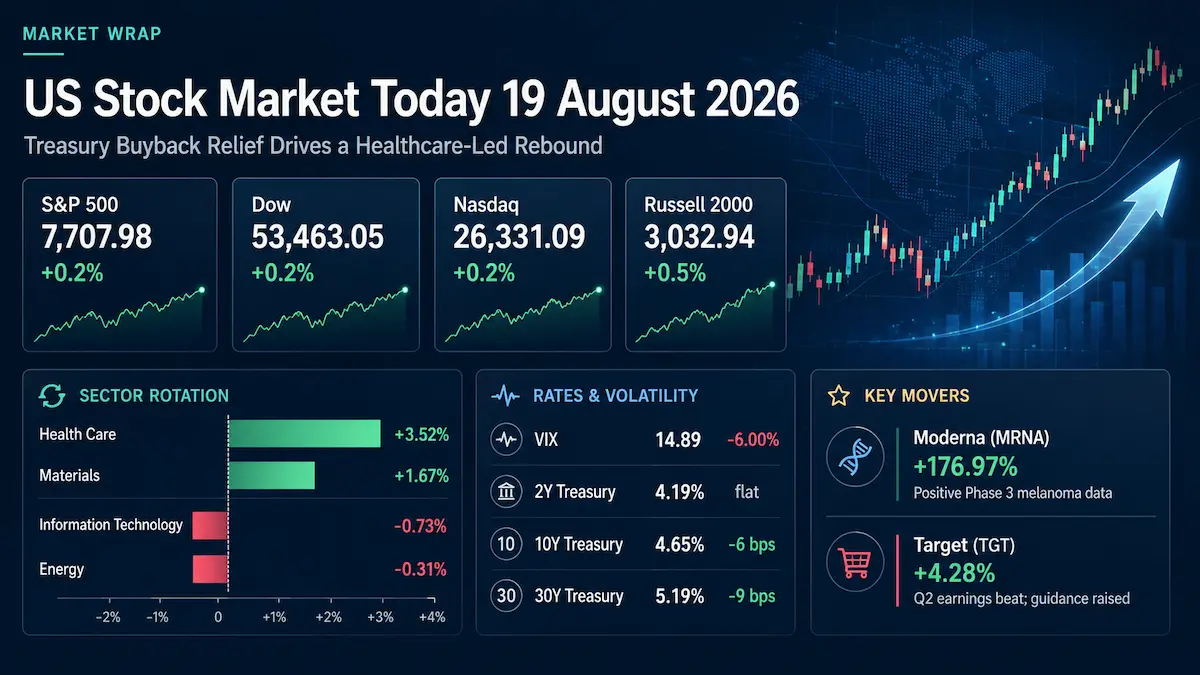
- The S&P 500 rose 0.2% to 7,707.98, the Dow Jones Industrial Average gained 0.2% to 53,463.05, and the Nasdaq Composite added 0.2% to 26,331.09, ending a three-session losing streak. The Russell 2000 outperformed with a 0.5% gain to 3,032.94.
- Health Care was the strongest S&P 500 sector, rising 3.52%, while Information Technology was the weakest, falling 0.73%. The divergence showed a meaningful rotation away from long-duration technology leadership rather than a simple broad-based risk-on move.
- Long-end Treasury yields fell after the U.S. Treasury announced larger liquidity-support buybacks for longer-dated nominal securities. The 10-year yield declined 6 basis points to 4.65%, while the 2-year yield held at 4.19%.
- The Cboe VIX fell 6.00% to 14.89, consistent with lower index-level hedging demand, even as single-stock dispersion remained unusually high because of major company-specific catalysts.
1. Market Capital Flows and Sector Rotation:
Wednesday’s close was defined by rotation rather than uniform risk appetite. The S&P 500 Health Care sector gained 3.52%, making it the best-performing sector, while Information Technology fell 0.73%, the weakest of the 11 groups. Materials also advanced 1.67%, whereas Energy slipped 0.31%, leaving the cyclical complex mixed rather than uniformly strong. At the capitalization level, the Russell 2000’s 0.5% rise outpaced the S&P 500’s 0.2% gain, indicating that smaller companies participated more fully than the headline large-cap indexes suggested. Defensives were led decisively by health care, while the growth-versus-value picture was less binary: long-duration technology growth lagged, and the day’s leadership favored a lower-duration, more value-sensitive cross-section, but there was no clean value sweep across every sector.
The Russell 2000’s relative strength is the most reliable breadth signal from the major closing indexes. Combined with gains in health care and materials despite technology weakness, it argues against describing the session as another mega-cap-driven advance. At the same time, the S&P 500’s modest 0.2% gain shows that the market was not experiencing indiscriminate risk expansion.
Institutional Flow Insight: A plausible institutional interpretation, rather than confirmed fund-flow data, is that investors reduced some duration concentration after the prior rise in long-term yields and redeployed risk toward areas with company-specific earnings or clinical catalysts. Treasury’s decision to increase long-end liquidity-support buybacks may also have improved the near-term rate backdrop for equity risk budgets. The rotation into health care offered a combination of idiosyncratic earnings visibility and lower sensitivity to long-duration discount-rate pressure, while technology remained more exposed to valuation compression if long yields reaccelerate.
2. Decoding the Biggest Market Movers:
Target Corporation (TGT)
Target closed at $159.00, up 4.28%, after reporting second-quarter 2026 results that were stronger both operationally and in reported earnings. Net sales rose 5.3% year over year to $26.539 billion, comparable sales increased 3.8%, and comparable digital sales grew 8.7%. GAAP and adjusted EPS were $4.11 versus $2.05 a year earlier. However, earnings quality requires normalization: the quarter included $994 million of pretax tariff-refund benefits, which added $1.65 per share and 3.7 percentage points to operating margin. Reported operating margin reached 9.6% versus 5.2% a year earlier, while gross margin was 33.7%. Excluding tariff refunds, Target said EPS still increased 20% year over year.
Management raised its 2026 outlook to net sales growth in a range around 5%, about one percentage point above its prior range. It now expects an operating margin around 6%, including roughly 90 basis points of benefit from the second-quarter tariff refunds, and GAAP and adjusted EPS of $9.90 to $10.90, including the $1.65 per-share refund benefit. Excluding tariff refunds, the midpoint of the EPS outlook increased by $0.75 from the prior $7.50-$8.50 range. The investment takeaway is therefore more constructive than the headline EPS doubling alone: traffic, digital growth and the underlying profit trend improved, but the tariff refund should not be treated as a recurring margin run rate. For the broader retail complex, Target’s result supports company-specific differentiation rather than an automatic conclusion that the entire U.S. consumer sector has strengthened equally.
Moderna, Inc. (MRNA)
Moderna closed at $174.38, up 176.97%, after Moderna and Merck announced positive topline Phase 3 INTerpath-001 results for intismeran autogene in combination with KEYTRUDA in patients with completely resected stage IIB-IV melanoma. The study met its primary endpoint of recurrence-free survival and a key secondary endpoint of distant metastasis-free survival, with the companies reporting statistically significant and clinically meaningful improvements versus KEYTRUDA alone. Overall survival remains under evaluation, the safety profile was consistent with prior combination studies, and no new safety signals were observed.
The size of Moderna’s move reflects more than a single-product reaction: the readout materially strengthened the market’s perception of individualized mRNA oncology as a platform. Importantly, the companies did not disclose the Phase 3 hazard ratios or full efficacy magnitude in the topline release, so older Phase 2b risk-reduction figures should not be substituted for the new Phase 3 data. Merck also gained 12.6%, and the readout was a major contributor to health care’s 3.52% sector gain. For peer valuation, the result can raise the option value assigned to personalized cancer-vaccine pipelines, but detailed data, regulatory review, manufacturing economics and eventual commercialization remain necessary before investors can quantify the full incremental earnings contribution with confidence.
Together, Target and Moderna illustrate why Wednesday’s index gain was more informative at the stock and sector level than at the headline level. Retail earnings quality and oncology platform validation attracted capital even as technology lagged, creating a market in which fundamental dispersion mattered more than broad beta.
3. Macro Indicators and Market Outlook
The Cboe VIX ended at 14.89, down 0.95 point or 6.00% from the prior session. That decline was directionally consistent with the rebound in the major indexes and the easing in long-end Treasury yields, suggesting less demand for near-term S&P 500 volatility protection. The low index-level VIX should not be confused with low single-name risk, however: Moderna’s 176.97% surge and continued technology weakness demonstrate that cross-sectional volatility remained substantial.
U.S. Treasury’s official constant-maturity data showed the 2-year yield unchanged at 4.19%, while the 10-year yield fell to 4.65% from 4.71%, a 6-basis-point decline. The 2s10s spread therefore narrowed to about 46 basis points from 52 basis points. The 30-year yield fell more sharply, to 5.19% from 5.28%. The move was concentrated in the long end after Treasury announced that, beginning September 9, it would at least double the maximum size of liquidity-support buybacks in the 10-to-20-year and 20-to-30-year nominal sectors, from $2 billion to at least $4 billion per operation. That announcement can reduce liquidity and term-premium pressure without being equivalent to a change in the Federal Reserve’s policy rate.
The Federal Reserve’s July 28-29 meeting minutes, released Wednesday, reinforced that distinction. Most participants had supported keeping the federal funds target range at 3.50%-3.75%, while several favored a 25-basis-point increase and many judged that further tightening could be necessary if inflation failed to decline. The day’s bond rally therefore should not be interpreted as confirmation of an imminent Fed easing cycle. A more defensible reading is that investors repriced long-end liquidity and term-premium risk while the front-end policy signal remained comparatively firm.
Upcoming Economic Data & Catalysts:
- GDP (Second Estimate) and Corporate Profits, 2nd Quarter 2026 (Release date: August 26, 2026): Investors will focus on revisions to real growth and corporate profits for evidence on whether earnings breadth can remain resilient under elevated real and nominal rates.
- Personal Income and Outlays, July 2026 (Release date: August 26, 2026): The report includes consumer spending and the Federal Reserve’s preferred PCE inflation measures, making it important for front-end yields, policy expectations and equity-duration sensitivity.
Both releases are scheduled by the U.S. Bureau of Economic Analysis for August 26, 2026 at 8:30 a.m. ET.
Market Insights:
The August 19 rebound was not a classic broad risk-on surge and was not driven by a small group of mega-cap technology stocks. Small caps outperformed, health care surged, technology declined and long-end yields fell. That combination points to selective risk reallocation rather than indiscriminate multiple expansion. The most important reversal risks are a renewed rise in long-term Treasury yields, weaker participation outside isolated event-driven winners, downward earnings revisions, policy surprises, renewed volatility expansion and further valuation compression in crowded growth trades.
Trading & Investment Strategy:
Risk management should take priority over chasing the largest one-day winners. Investors can consider scaling into positions rather than deploying full exposure at once, separating repeatable operating improvement from one-time accounting or policy benefits, and favoring sectors where earnings visibility supports valuation. In technology, position sizing should reflect continued sensitivity to long-duration yields. In event-driven biotechnology, a large price gap should be assessed against the still-pending detailed clinical data and regulatory path. Stops and risk limits should be set around the investment thesis and expected volatility, not arbitrary price targets, while diversification can reduce dependence on any single macro or company catalyst.
4. Key FAQs About the US Stock Market Today
Why did the US stock market move on August 19, 2026?
U.S. stocks rose modestly as Treasury’s plan to increase long-end liquidity-support buybacks helped ease pressure in the bond market, while strong company-specific catalysts in health care and retail supported equities. The move was tempered by continued weakness in information technology and by FOMC minutes that kept inflation and potential further tightening in focus.
Which sectors performed best and worst in the US stock market on August 19, 2026?
Health Care was the best-performing S&P 500 sector, up 3.52%, helped by the Moderna-Merck Phase 3 melanoma readout. Information Technology was the worst performer, down 0.73%, as higher-rate sensitivity and the recent reassessment of crowded AI and semiconductor exposures continued to weigh on the group.
What should investors watch after the US stock market close on August 19, 2026?
The next major confirmed macro catalysts are the BEA’s second estimate of second-quarter GDP and corporate profits and its July Personal Income and Outlays report, both due August 26. Between now and then, investors should monitor whether long-end Treasury yields remain contained, whether small-cap and non-technology participation persists, whether detailed follow-up on Moderna’s Phase 3 data changes the biotechnology risk-reward, and whether equity volatility begins to re-expand.
Disclaimer: This article is intended solely for the exchange of investment ideas and does not constitute investment advice of any kind.