
Key Takeaways
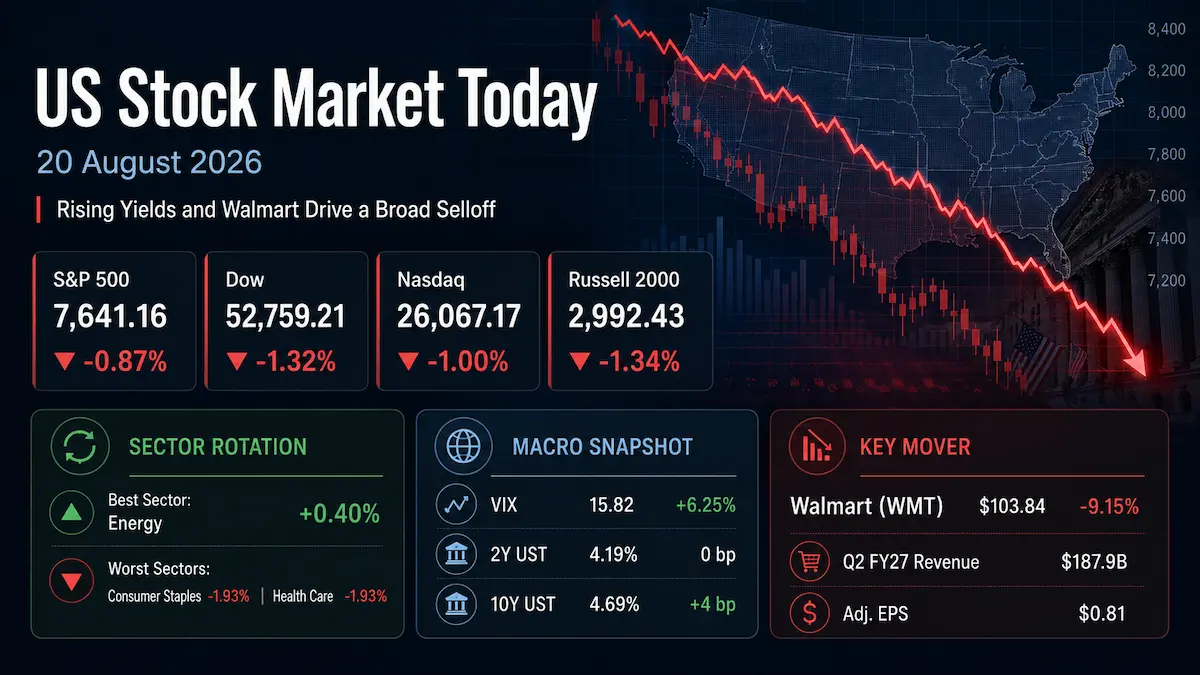
- The S&P 500 fell 0.87% to 7,641.16, the Dow Jones Industrial Average dropped 1.32% to 52,759.21, and the Nasdaq Composite lost 1.00% to 26,067.17. The Russell 2000 declined 1.34% to 2,992.43, showing that small caps underperformed large caps.
- Energy was the best S&P 500 sector at +0.40%, while Real Estate was the only other gainer at +0.15%. Consumer Staples and Health Care were tied for the worst performance at -1.93%, followed by Consumer Discretionary at -1.80%.
- The U.S. Treasury’s official daily curve showed the 2-year yield unchanged at 4.19% and the 10-year yield up 4 basis points to 4.69%, steepening the 2s10s curve to roughly 50 basis points. Higher long-end yields raised the discount-rate hurdle for equities without signaling a simple one-day repricing of the next Federal Reserve decision.
- Walmart closed down 9.15% at $103.84 even after reporting Q2 FY27 revenue of $187.9 billion, adjusted EPS of $0.81 and higher full-year guidance. The market instead focused on slower U.S. comparable-sales growth and the prospect of softer near-term operating leverage as tariff refunds are reinvested in price.
- Cboe’s VIX closed at 15.82, up 6.25%, while decliners outnumbered advancers by nearly 2-to-1 on both the NYSE and Nasdaq. That combination points to broad de-risking, but the below-average trading volume argues against characterizing the session as capitulation.
1. Market Capital Flows and Sector Rotation
The August 20 selloff was broader than a one-stock or one-factor event. Energy gained 0.40% as crude prices rose, and Real Estate added 0.15%, but the rest of the S&P 500 sectors finished lower. Consumer Staples and Health Care each fell 1.93%, while Consumer Discretionary lost 1.80%. The unusual weakness in traditionally defensive Staples and Health Care is important: this was not a textbook rotation from cyclicals into defensives. Company-specific pressure in retail and health care overrode the usual factor labels, while higher oil prices favored cash-generative energy exposure.
Small caps lagged: the Russell 2000 fell 1.34% versus the S&P 500’s 0.87% decline, consistent with tighter financial conditions weighing more heavily on companies with greater refinancing and domestic-demand sensitivity. A clean growth-versus-value signal was absent. The growth-heavy Nasdaq fell 1.00%, less than the Dow’s 1.32% drop, but Walmart’s 9.15% decline disproportionately hurt the price-weighted Dow. Higher long-term yields still created a valuation headwind for long-duration growth assets, so the session should not be reduced to a simple growth-over-value or value-over-growth rotation.
Market breadth confirmed that weakness extended beyond the headline indexes. Declining issues outnumbered advancers 1.94-to-1 on the NYSE and 1.92-to-1 on the Nasdaq. About 9.61 billion shares changed hands across U.S. exchanges, well below the 20-session average of 16.64 billion. Broad negative breadth combined with light volume is more consistent with orderly risk reduction and position trimming than with forced liquidation.
Institutional Flow Insight: One plausible institutional interpretation is that the rise in long-end yields, with the 2-year yield unchanged, encouraged risk managers to reduce duration-sensitive equity exposure and small-cap beta rather than make an aggressive directional bet on the next Fed move. Energy offered a partial hedge against the inflationary impulse from higher oil prices, while the weakness in Staples and Health Care shows that earnings visibility and stock-specific catalysts mattered more than defensive classification alone. This is an inference from price action and cross-asset relationships, not confirmed fund-flow data.
2. Decoding the Biggest Market Movers
Walmart Inc. (WMT)
Walmart closed at $103.84, down 9.15%, making it one of the most consequential single-stock drags on both the Dow and the Consumer Staples sector. The selloff is notable because the company’s official Q2 FY27 release was not weak on headline financial delivery. Revenue rose 5.9% to $187.9 billion, or 5.1% in constant currency. GAAP EPS was $0.80 and adjusted EPS was $0.81. Operating income rose 28.8%, while adjusted operating income increased 17.4% in constant currency. The gross profit rate increased 96 basis points, although Walmart said tariff refunds were the primary driver of that expansion.
The more investable issue was the quality and forward shape of the earnings. Walmart U.S. comparable sales excluding fuel rose 2.6%, down from 4.6% in the year-earlier quarter. Transactions increased 1.5% and average ticket rose 1.1%. The company identified a 125-basis-point drag to U.S. comparable sales from pharmacy deflation related to maximum fair price regulation. At the same time, the higher-margin digital ecosystem remained strong: global eCommerce grew 23%, Walmart U.S. eCommerce rose 24%, and global advertising grew 38%.
Walmart also received nearly $2.9 billion of IEEPA tariff refunds and reinvested part of that benefit into pricing. The company said adjusted operating-income growth in constant currency included a 750-basis-point net benefit from tariff refunds; excluding that benefit, underlying operating-income growth was at the top end of its prior 7% to 10% guidance. That distinction matters because investors must separate structural margin improvement from temporary refund economics.
For Q3 FY27, Walmart guided to constant-currency net-sales growth of 3.0% to 3.75%, adjusted operating-income growth of 2.0% to 4.0%, and adjusted EPS of $0.62 to $0.64. For FY27, it raised constant-currency net-sales growth guidance to 4.0% to 5.0%, adjusted operating-income growth to 7.0% to 8.5%, and adjusted EPS to $2.80 to $2.87. Capital expenditures are now expected at about 4.0% of net sales. The market’s negative reaction therefore looks less like a verdict that Walmart’s business is deteriorating outright and more like a repricing of near-term margin quality, consumer sensitivity and the valuation investors are willing to pay for defensive growth.
The read-through reached beyond Walmart. When a bellwether that has been gaining share across income cohorts sells off despite raising full-year guidance, investors tend to scrutinize the entire consumer complex for evidence that higher fuel costs and price sensitivity are compressing discretionary spending. That helps explain why the shock spread from Consumer Staples into Consumer Discretionary rather than remaining isolated to one retailer.
3. Macro Indicators and Market Outlook
The Cboe VIX closed at 15.82, up 0.93 point or 6.25%. The direction of volatility was consistent with the equity selloff and broader negative market breadth, indicating increased demand for downside protection and event-risk hedging. Still, the absolute VIX level remained moderate relative to periods of acute market stress, so the close signaled rising caution rather than disorderly fear.
Rates were more important than the VIX level. The U.S. Treasury’s official daily Constant Maturity Treasury curve showed the 2-year yield at 4.19%, unchanged from August 19, while the 10-year yield rose from 4.65% to 4.69%. The roughly 50-basis-point 2s10s spread therefore widened by about 4 basis points. Because the front end was stable while the long end sold off, the move is better described as a long-end bear steepening than as a clean repricing of imminent Fed policy. Investors were likely balancing resilient growth, inflation risk from energy, heavy duration supply and term-premium concerns rather than expressing one definitive view on the next rate decision.
The day’s official regional data reinforced that ambiguity. The Philadelphia Fed’s current general activity index rose to 47.4 in August from 41.4 in July, its highest reading since April 2021, while its employment index climbed to 27.9. At the same time, the prices-paid index fell to 40.9 from 53.9. Stronger activity and hiring can reduce the urgency for easier policy, but the easing in price diffusion argues against interpreting the report as a one-way inflation shock.
Oil supplied the clearest cross-asset link to sector rotation. Brent crude rose about 2% to $93.49 as Middle East supply risks remained elevated. That supported Energy while increasing concerns about transportation costs, household purchasing power and the inflation path. The combination of higher oil and higher long-term yields was especially unhelpful for rate-sensitive and consumer-facing equities.
Upcoming Economic Data & Catalysts:
- GDP (Second Estimate) and Corporate Profits, Q2 2026 (Release date: August 26, 2026): Investors will watch revisions to real growth, domestic demand and corporate-profit measures. A meaningful change in the growth or profit picture could affect both earnings expectations and the term structure of Treasury yields.
- Personal Income and Outlays, July 2026 (Release date: August 26, 2026): The report includes personal spending, income and the PCE price indexes. The balance between consumer demand and inflation will be important for the market’s assessment of real purchasing power, corporate revenue resilience and the Fed’s policy flexibility.
Only officially scheduled post-August-20 releases are included above.
Market Insights:
The session was driven by broad risk aversion rather than a narrow megacap selloff. Breadth was negative by roughly 2-to-1, small caps underperformed and most sectors declined. Walmart amplified the Dow and Consumer Staples losses, but higher long-term yields and oil prices provided the common macro pressure across the tape. The trend could reverse if long-end yields stabilize, breadth improves and earnings revisions remain resilient. Conversely, another sharp rise in the 10-year yield, weaker breadth, downward earnings revisions, a policy or geopolitical shock, a material volatility breakout, or renewed valuation compression would increase downside risk.
Trading & Investment Strategy:
Position sizing should reflect the higher sensitivity of equities to long-duration yields and energy prices. Staging entries rather than deploying capital all at once can reduce timing risk, especially in small caps and high-multiple growth stocks. Within sectors, preference can be given to companies with visible free cash flow, balance-sheet flexibility and pricing power, while avoiding the assumption that every defensive stock will outperform in a risk-off tape. Energy exposure can hedge an oil shock, but chasing a one-day move after a sharp commodity rally creates asymmetric reversal risk. For individual stocks such as Walmart, a large one-day decline is not by itself a buy signal; investors should wait for the earnings thesis, valuation and price trend to align. Stop-loss or risk-exit levels should be set before entry and calibrated to position size and normal volatility rather than emotion.
4. Key FAQs About the US Stock Market Today
Why did the US stock market move on 20 August 2026?
U.S. stocks fell because long-term Treasury yields resumed their rise, oil prices increased and Walmart’s post-earnings selloff weakened confidence in the consumer complex. The Philadelphia Fed survey also showed very strong regional manufacturing activity, which reinforced the market’s focus on resilient growth even as its prices-paid index eased. The combined effect was a higher discount-rate backdrop with added consumer and inflation uncertainty.
Which sectors performed best and worst in the US stock market on 20 August 2026?
Energy was the best S&P 500 sector, rising 0.40%, followed by Real Estate at +0.15%. Consumer Staples and Health Care were tied for the worst performance at -1.93%, while Consumer Discretionary fell 1.80%. The rotation was not a conventional defensive trade: higher oil supported Energy, while Walmart and other stock-specific pressures overwhelmed the usual defensive characteristics of Staples and Health Care.
What should investors watch after the US stock market close on 20 August 2026?
The most important near-term signals are whether the 10-year Treasury yield can stabilize around the current elevated range, whether market breadth improves after a roughly 2-to-1 negative session, and whether oil continues to rise. On August 26, the BEA will release the second estimate of Q2 GDP and corporate profits alongside July Personal Income and Outlays. Those reports can materially influence the market’s views on growth, inflation, earnings resilience and the discount rate applied to equities.
Disclaimer: This article is intended solely for the exchange of investment ideas and does not constitute investment advice of any kind.