
Key Takeaways
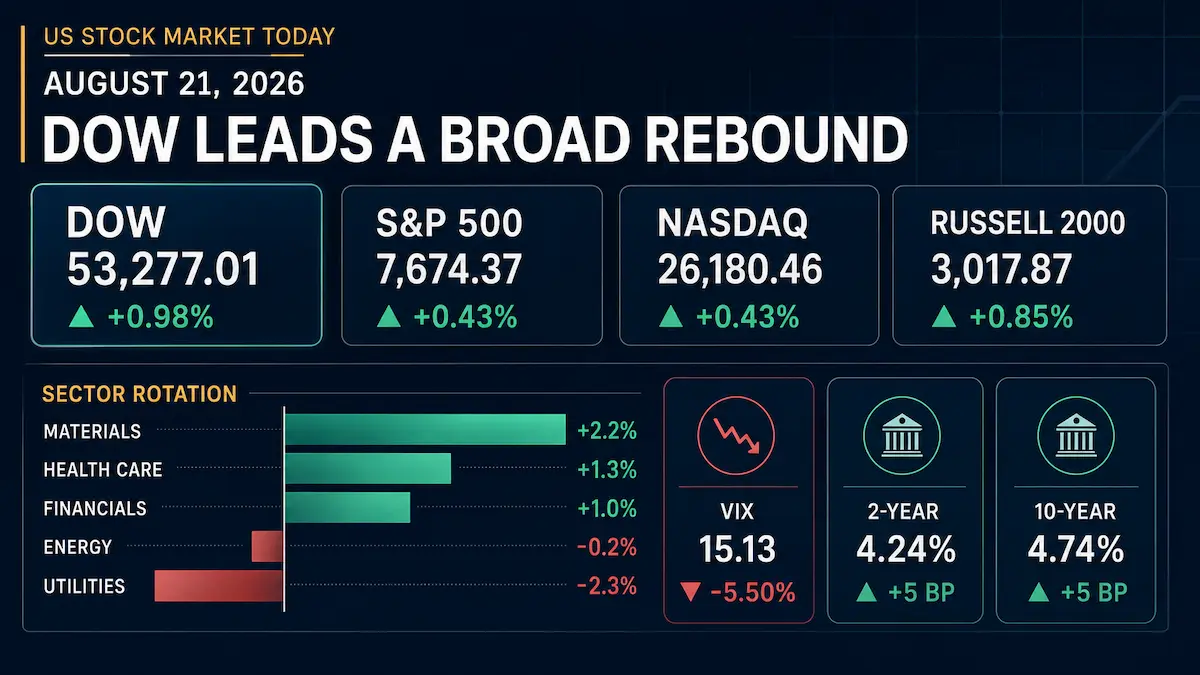
- The S&P 500 gained 0.43% to 7,674.37, the Dow Jones Industrial Average rose 0.98% to 53,277.01, the Nasdaq Composite added 0.43% to 26,180.46 and the Russell 2000 advanced 0.85% to 3,017.87 in the regular U.S. session.
- Participation was broader than the headline S&P 500 move: the equal-weighted S&P 500 proxy rose 0.63%, while advancers led decliners by 1.68-to-1 on the NYSE and 1.85-to-1 on Nasdaq.
- Materials led the S&P 500 sectors with a 2.2% gain, followed by health care at 1.3% and financials at 1.0%. Utilities fell 2.3%, the session’s clear laggard, while energy slipped 0.2%.
- The flash S&P Global U.S. Composite PMI rose to 56.0 in August as services accelerated to 56.8, outweighing a manufacturing slowdown to 53.2. The resilient growth signal coincided with higher Treasury yields.
- The Cboe VIX closed at 15.13, down 5.50%, but Friday’s rebound did not erase weekly losses of 1.43% for the S&P 500, 2.05% for the Nasdaq and 0.85% for the Dow.
1. Market Capital Flows and Sector Rotation
The tape favored economically sensitive and value-leaning exposures without becoming a uniform cyclical rally. According to the final market close, materials gained 2.2% as gold and copper strengthened, health care rose 1.3% and financials added 1.0%. Utilities dropped 2.3% as higher long-term yields reduced the relative appeal of bond-like cash flows, while energy fell 0.2% despite a sixth consecutive gain in oil futures. The Dow’s 0.98% rise and the Russell 2000’s 0.85% advance both exceeded the 0.43% gains in the S&P 500 and Nasdaq. S&P 500 value exposure also modestly outperformed growth exposure based on liquid ETF proxies, consistent with a rotation away from duration-heavy leadership; however, the Nasdaq still finished higher, so this was rotation within a rising market rather than a wholesale exit from growth.
Market breadth confirms that the rebound was not driven solely by a few mega-cap stocks. The Invesco S&P 500 Equal Weight ETF, a liquid breadth proxy, rose 0.63% versus the cap-weighted index’s 0.43%. On the NYSE, 214 stocks made new highs and 118 made new lows; Nasdaq recorded 3,186 advancers against 1,725 decliners. Conviction was less impressive than participation: 14.91 billion shares changed hands across U.S. exchanges, below the 20-session average of 16.62 billion shares.
Institutional Flow Insight: The price action may reflect tactical re-risking after Thursday’s selloff rather than confirmed strategic inflows; public closing data do not identify the end investor behind each trade. Falling implied volatility can mechanically free some risk budget, while resilient activity data favor earnings-sensitive cyclicals and higher nominal growth favors materials. At the same time, a 4.74% 10-year yield raises the discount rate on utilities and other long-duration cash flows. Health care’s strength suggests that investors also retained exposure to earnings visibility rather than moving exclusively into high beta. Because August 21 was neither a month-start nor a quarter-start session, calendar rebalancing is a weaker explanation than the interaction among yields, commodity prices, earnings quality and the prior day’s de-risking.
2. Decoding the Biggest Market Movers
Ross Stores (ROST)
Ross Stores rose 4.39% to $239.04 after its official fiscal second-quarter release and earnings call; management commentary was cross-checked against the published call transcript. Sales increased 13% to $6.265 billion, comparable-store sales grew 10% primarily on higher customer traffic, net income reached $851.3 million and diluted EPS rose to $2.66 from $1.56. Reported operating income of $1.104 billion equated to a 17.6% operating margin, up approximately 610 basis points. The quarter included about $253 million of IEEPA tariff refunds, adding roughly $0.60 to EPS and 405 basis points to operating margin; importantly, operating margin still expanded 205 basis points excluding that benefit. Management raised fiscal 2026 EPS guidance to $8.61-$8.77, including the refund benefit, and projected third-quarter comparable sales growth of 6%-7%, EPS of $1.75-$1.83 and operating margin of 11.7%-12.0%. Fourth-quarter comparable sales are expected to rise 4%-5%, with EPS of $2.17-$2.26. The investment signal is stronger than a one-time refund: management reported gains from new and lapsed customers, more frequent trips by existing customers and broad category and geographic strength. Still, the refund distorted reported earnings quality, tougher comparisons remain ahead and higher fuel costs are embedded as a freight headwind. The read-through is therefore positive for off-price retail and value-oriented consumer demand, but it should not be generalized to every discretionary retailer.
Robinhood Markets (HOOD)
Robinhood surged 13.75% to $108.13, the largest S&P 500 gain of the session, as bitcoin advanced 6.4% to its highest level since mid-May. The move was cohort-wide: Coinbase gained 8.2% and Strategy added 6.0%. That pattern suggests crypto beta, improving regulatory sentiment and short-covering were more important than company-specific earnings news. Robinhood’s latest official monthly data showed July crypto notional volume of $10.9 billion, down 33% from June and 62% from a year earlier. Friday’s rally therefore appears to have priced the possibility of better future trading engagement; it did not confirm a revenue acceleration. The stock’s move reinforced sentiment in trading platforms and crypto-sensitive financials and accompanied a 1.0% gain in the broader financial sector, but it should not be treated as evidence of a broad re-rating in traditional banks or insurers.
3. Macro Indicators and Market Outlook
The Cboe VIX fell 0.88 point, or 5.50%, to an official close of 15.13. That decline was directionally consistent with higher equities and positive breadth, signaling less demand for near-term S&P 500 option protection than on Thursday. A 15-handle does not indicate acute stress, but the lower VIX should not be read as the absence of event risk: the market still faces inflation data, a major central-bank speech and unresolved Middle East and fiscal-policy uncertainty.
The U.S. Treasury’s official 3:30 p.m. constant-maturity marks put the 2-year yield at 4.24% and the 10-year yield at 4.74%, both 5 basis points above Thursday. The 2s10s curve remained positively sloped by about 50 basis points, unchanged on rounded official data, so the session was closer to a parallel upward shift than a fresh steepening signal. The short end reflected some repricing of policy and resilient growth risk, while the long end also carried inflation, energy and fiscal term-premium concerns. A single-day yield move cannot establish the Federal Reserve’s next action. Treasury’s decision to at least double long-end liquidity-support buybacks to $4 billion per operation from September 9 may improve market functioning, but it does not remove the underlying supply, inflation or deficit risks priced into longer maturities.
A softer dollar and gains in gold and copper helped explain materials leadership. Oil futures extended their winning streak amid Iran-related supply concerns, yet energy equities fell 0.2%; that divergence suggests investors preferred metals exposure and did not indiscriminately chase every commodity-sensitive equity.
Upcoming Economic Data & Catalysts:
- Personal Income and Outlays, July 2026 (Release date: Wednesday, August 26, 2026, at 8:30 a.m. ET): The BEA release includes the PCE price indexes. Investors will focus on core inflation, real spending and income growth because the combination can shift both policy-rate expectations and consumer-earnings assumptions.
- Federal Reserve Chair Kevin Warsh’s Jackson Hole keynote (Release date: Friday, August 28, 2026, at 10:00 a.m. ET): The official Federal Reserve calendar confirms the speech. Markets will assess how the Chair balances resilient activity, elevated energy and input costs, financial innovation and the threshold for any policy adjustment.
Only events confirmed on official schedules after the August 21 close are listed above.
Market Insights:
The session was broader than a mega-cap-led bounce: small caps and equal weight outperformed, both exchange advance-decline ratios were positive and three sectors rose at least 1.0%. However, below-average volume, the week’s negative index returns and concentrated surges in metals and crypto temper the signal. The rebound could reverse if the 10-year yield makes a sustained move above recent highs, breadth narrows while cap-weighted indexes rise, earnings estimates are cut, policy or geopolitical news lifts oil and inflation expectations, or the VIX turns sharply higher.
Trading & Investment Strategy:
Keep gross exposure consistent with portfolio volatility limits and use staged entries rather than chasing Friday’s largest gaps. Quality cyclicals with visible free cash flow can participate in the stronger growth backdrop, while health care can provide earnings resilience; utilities remain sensitive to further long-end yield increases. For high-beta metals and crypto-linked equities, smaller position sizes and predetermined exit levels are prudent because realized volatility can remain high even when the VIX falls. Add only when price, breadth and the fundamental thesis remain aligned, and reassess risk if yields rise while market participation deteriorates.
4. Key FAQs About the US Stock Market Today
Why did the US stock market move on 21 August 2026?
U.S. stocks rebounded as the flash Composite PMI showed faster private-sector growth, Ross Stores delivered strong traffic-led results and crypto-sensitive stocks rallied with bitcoin. The Treasury market remained a constraint rather than a tailwind: 2-year and 10-year official yields each rose 5 basis points. Broad participation and a lower VIX helped equities absorb that rate pressure, although the major indexes still ended the week lower.
Which sectors performed best and worst in the US stock market on 21 August 2026?
Materials performed best, rising 2.2% as gold and copper strengthened. Health care gained 1.3% and financials rose 1.0%. Utilities were the worst sector, falling 2.3% as elevated long-term yields pressured rate-sensitive valuations; energy was the next-worst performer with a 0.2% decline.
What should investors watch after the US stock market close on 21 August 2026?
The next major checkpoints are the July Personal Income and Outlays report on August 26 and Chair Warsh’s Jackson Hole remarks on August 28. Investors should also monitor whether the 10-year yield holds near 4.74% or breaks higher, whether equal-weight and small-cap leadership persists, whether advance-decline breadth remains positive and whether the VIX reverses from 15.13. Those signals will help distinguish a durable broadening phase from a one-session rebound.
Disclaimer: This article is intended solely for the exchange of investment ideas and does not constitute investment advice of any kind.