Key Takeaways
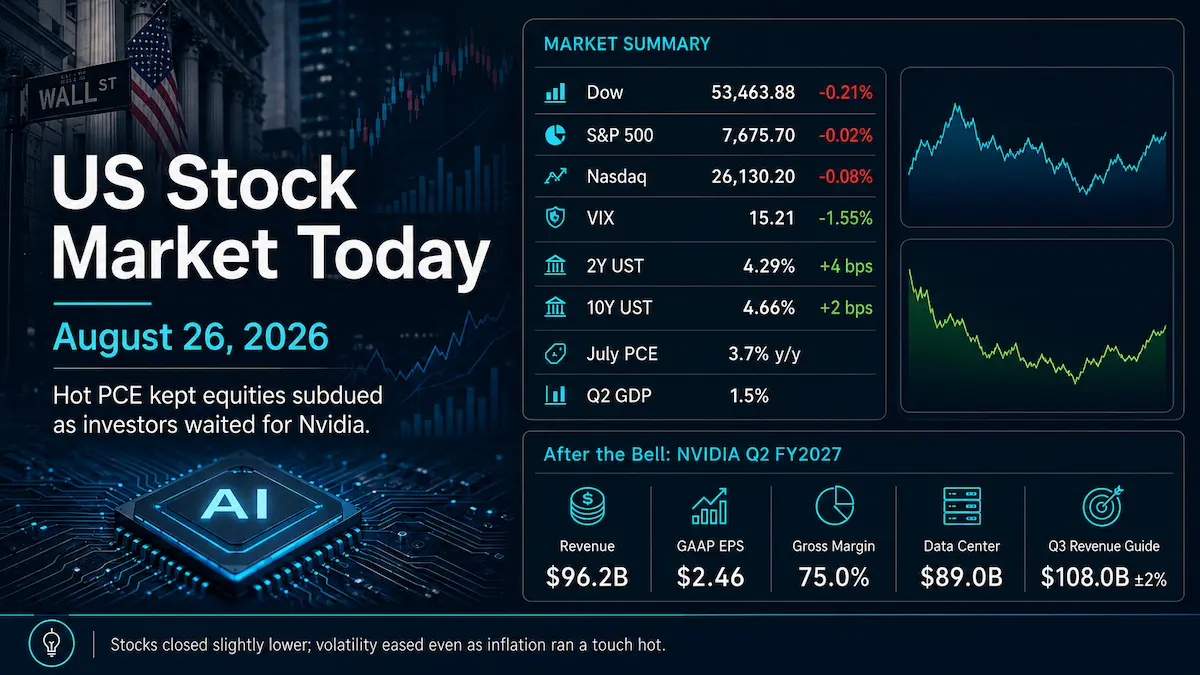
- The S&P 500 slipped 0.02% to 7,675.70, the Dow Jones Industrial Average fell 0.21% to 53,463.88, and the Nasdaq Composite eased 0.08% to 26,130.20. The Russell 2000 declined 0.1% to 3,005.90, leaving small caps slightly behind large caps.
- July PCE inflation rose 3.7% year over year and core PCE rose 3.3%, while second-quarter real GDP was estimated to have increased at a 1.5% annualized rate. The combination kept inflation risk in focus without triggering a disorderly equity selloff.
- Industrials led the S&P 500 sectors with a 1.07% gain, while Health Care was the weakest at -1.00%. Market breadth was softer than the headline indexes, but trading volume was below its 20-day average.
- The Cboe VIX closed at 15.21, down 1.55%, while the U.S. Treasury 2-year and 10-year par yields both rose 2 basis points to 4.19% and 4.66%, respectively.
- Nvidia fell 1.6% in the regular session before reporting fiscal second-quarter results after the close: revenue of $96.221 billion, a 75.0% gross margin, and Q3 revenue guidance of $108.0 billion, plus or minus 2%.
1. Market Capital Flows and Sector Rotation
Sector dispersion mattered more than the near-flat index close. Industrials finished as the best-performing S&P 500 sector, up 1.07%, while Health Care fell 1.00% and ranked last. That pairing argues against a simple defensive risk-off narrative: economically sensitive industrial shares attracted capital even as a traditionally defensive sector lagged. At the index level, the S&P 500’s 0.02% decline was smaller than the Russell 2000’s 0.1% drop, indicating modest large-cap relative resilience. The Nasdaq’s 0.08% decline versus the Dow’s 0.21% loss also left the growth-versus-value signal mixed rather than decisive.
Underlying participation was weaker than the capitalization-weighted indexes suggested. Decliners outnumbered advancers by 1.16-to-1 on the NYSE and 1.38-to-1 on Nasdaq. U.S. exchange volume totaled 14.2 billion shares, below the 20-session average of 16.2 billion. That combination points to selective de-risking and weak participation rather than a high-conviction liquidation event.
Institutional Flow Insight: A reasonable interpretation is that investors were reducing event risk around inflation and Nvidia without abandoning equity exposure wholesale. Higher front-end and long-end yields raised the hurdle rate for duration-sensitive assets, while the market continued to reward businesses with clearer earnings visibility. With month-end approaching, portfolio rebalancing may also have influenced positioning, but there is no direct evidence that rebalancing was the primary driver of the session. The low VIX and below-average volume are more consistent with controlled risk-budget adjustment than forced deleveraging.
2. Decoding the Biggest Market Movers:
NVIDIA (NVDA)
Nvidia shares closed the regular session down 1.6%, reflecting pre-earnings risk reduction in one of the market’s largest index weights rather than a reaction to the results themselves. After the closing bell, Nvidia reported fiscal Q2 2027 revenue of $96.221 billion, up 18% sequentially and 106% year over year. Data Center revenue was $89.0 billion, up 117% from a year earlier. GAAP and non-GAAP gross margins were both 75.0%; GAAP diluted EPS was $2.46 and non-GAAP diluted EPS was $2.22.
For fiscal Q3 2027, Nvidia guided to revenue of $108.0 billion, plus or minus 2%, with GAAP and non-GAAP gross margins of 74.0%, plus or minus 50 basis points. The company explicitly stated that its outlook assumes no Data Center compute revenue from China. Strategically, the report matters well beyond semiconductors: the revenue trajectory remains a key read-through for hyperscaler capital spending, AI networking, memory, power and cooling infrastructure, and the valuation framework for the broader AI complex. The one-point midpoint step-down in gross margin from the reported 75.0% to the guided 74.0% puts greater emphasis on product mix, input costs and the quality of incremental AI revenue rather than top-line growth alone. At the time this article was finalized, Nvidia’s official Investor Relations site had published the Q2 earnings release and event materials but had not yet posted a Q2 corrected earnings-call transcript; accordingly, this analysis excludes third-party transcript-only claims.
3. Macro Indicators and Market Outlook
The Cboe VIX closed at 15.21, down 0.24 point or 1.55%. The decline in implied volatility despite modest equity losses suggests that the session did not produce a broad surge in demand for near-term S&P 500 protection. That divergence is consistent with event-specific caution and selective hedging rather than a generalized volatility shock.
U.S. Treasury yields moved higher after the inflation data. The Treasury’s official daily par yield curve showed the 2-year yield at 4.19%, up 2 basis points from 4.17%, and the 10-year yield at 4.66%, up 2 basis points from 4.64%. The 2s10s spread therefore remained near +47 basis points. The roughly parallel upward shift is consistent with investors demanding somewhat more compensation for inflation and policy uncertainty across maturities; it should not be interpreted as proof of a specific Federal Reserve move from a single trading session.
The macro mix remains nuanced. July headline PCE inflation accelerated to 3.7% year over year, with core PCE at 3.3%, while real PCE was essentially flat on the month. At the same time, second-quarter real GDP grew at a 1.5% annualized rate, but real final sales to private domestic purchasers rose 4.2%. For equities, that combination preserves earnings support from private demand while keeping discount-rate sensitivity elevated.
Upcoming Economic Data & Catalysts:
- U.S. Employment Situation for August 2026 (Release date: September 4, 2026): Payroll growth, unemployment and wage trends will be important inputs for front-end Treasury yields and the market’s assessment of labor-demand resilience.
- U.S. Consumer Price Index for August 2026 (Release date: September 11, 2026): Investors will focus on whether inflation pressure is broadening or cooling after the firm July PCE reading, with implications for real yields, equity valuation multiples and rate-sensitive sectors.
Market Insights:
The session was not a broad risk-on move. Capitalization-weighted indexes remained close to unchanged, but negative breadth showed that underlying participation was softer. Large-cap resilience therefore masked some weakness below the surface. A more durable advance would be better supported by improving breadth and stable yields; risks to the current equilibrium include another sharp rise in Treasury yields, weakening earnings revisions, further breadth deterioration, policy surprises, a sustained volatility breakout, or valuation compression in crowded growth exposures.
Trading & Investment Strategy:
Risk management should take priority over chasing post-event price gaps. Investors can use staged entries rather than full-size positions, keep single-stock exposure proportional to realized and implied volatility, and favor sectors or companies where earnings visibility can justify the prevailing cost of capital. Stop-loss and thesis-review disciplines should be defined before entry, especially around earnings catalysts. In AI-related equities, separating durable cash-flow beneficiaries from momentum-driven exposures is increasingly important as revenue growth, margins and capital intensity are scrutinized together.
4. Key FAQs About the US Stock Market Today
Why did the US stock market move on August 26, 2026?
U.S. equities finished slightly lower as July PCE inflation came in firm, Treasury yields moved higher and investors reduced risk ahead of Nvidia’s post-close earnings. The modest index declines, falling VIX and below-average volume indicate caution rather than a broad liquidation.
Which sectors performed best and worst in the US stock market on August 26, 2026?
Industrials were the best-performing S&P 500 sector with a 1.07% gain, while Health Care was the weakest at -1.00%. The divergence suggests selective rotation toward economically sensitive industrial exposure rather than a uniform move into defensive assets.
What should investors watch after the US stock market close on August 26, 2026?
The immediate corporate catalyst is Nvidia’s fiscal Q2 report and its $108.0 billion Q3 revenue outlook. Beyond single-stock earnings, investors should monitor whether the 2-year and 10-year Treasury yields continue to rise, whether market breadth improves, and how the September 4 Employment Situation and September 11 CPI releases reshape inflation and growth expectations.
Disclaimer: This article is intended solely for the exchange of investment ideas and does not constitute investment advice of any kind.