

Key Takeaways
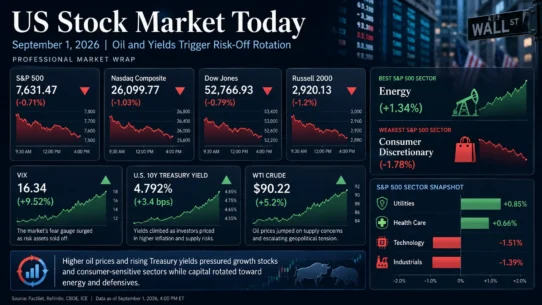
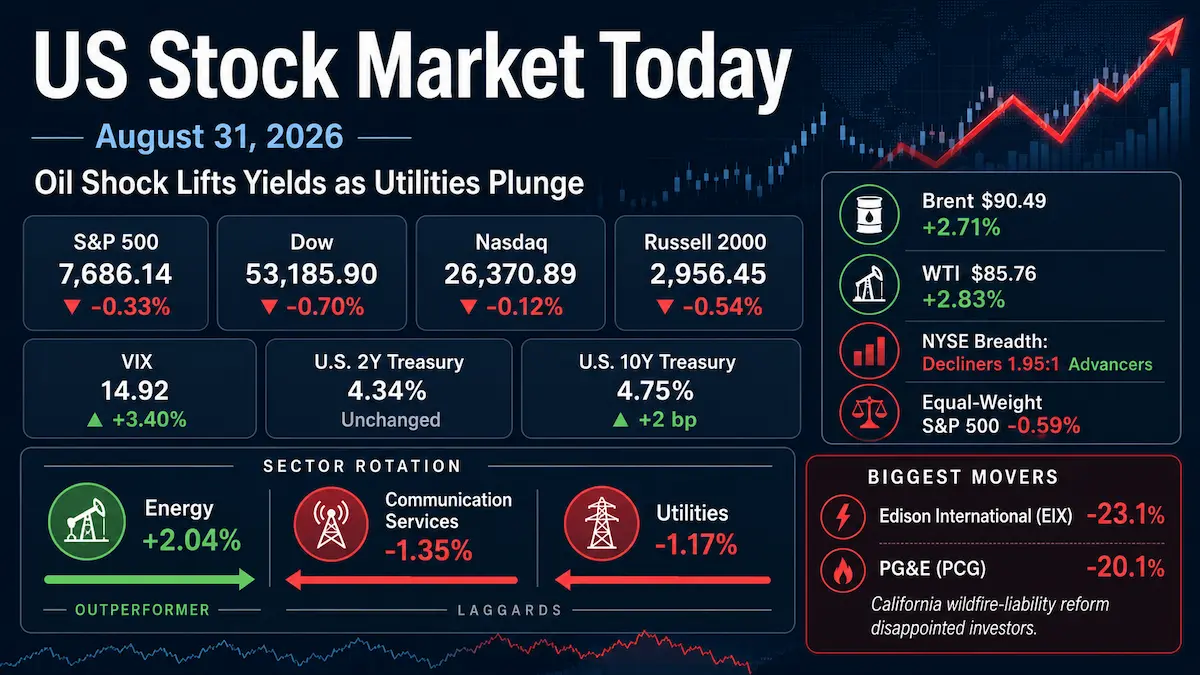
- The S&P 500 fell 0.33% to 7,686.14, the Dow dropped 0.70% to 53,185.90, the Nasdaq Composite slipped 0.12% to 26,370.89, and the Russell 2000 lost about 0.54% to 2,956.45.
- A renewed U.S.-Iran exchange of military strikes pushed Brent crude up 2.71% to $90.49 and WTI up 2.83% to $85.76, reviving inflation concerns and favoring energy shares over most of the market.
- The official U.S. Treasury closing curve showed the 2-year yield unchanged at 4.34% and the 10-year yield up 2 basis points to 4.75%, a modest steepening consistent with greater long-end inflation and term-premium sensitivity rather than a clean one-day repricing of the Fed path.
- Market breadth was weak: declining stocks outnumbered advancers by 1.95-to-1 on the NYSE, while the Invesco S&P 500 Equal Weight ETF fell 0.59%, underperforming the capitalization-weighted S&P 500.
- California utility risk was sharply repriced. Edison International fell 23.1% and PG&E fell 20.1% after the latest wildfire-liability compromise failed to deliver the durable financing framework investors and the companies had sought.
1. Market Capital Flows and Sector Rotation
Energy was the clear leadership group as crude prices jumped on renewed Middle East hostilities. On a close-to-close basis, the Energy Select Sector SPDR ETF, a liquid proxy for the S&P 500 energy sector, rose 2.04%. At the other end, the Communication Services Select Sector SPDR ETF fell 1.35%, while the Utilities Select Sector SPDR ETF lost about 1.17%. Technology was a notable relative winner, with its sector proxy up 0.44%, helping the growth-heavy Nasdaq limit its decline to 0.12%. The sector pattern was therefore not a conventional broad cyclical rally: energy gained on a commodity shock, but industrials fell 1.13% on their sector proxy and small caps underperformed. Defensive exposure also failed to provide uniform protection because utilities were hit by California-specific policy risk.
Size and style data reinforced the breadth message. The Russell 2000 fell roughly 0.54%, worse than the S&P 500’s 0.33% decline. The equal-weight S&P 500 ETF proxy lost 0.59%, indicating that the average large-cap stock performed worse than the headline index. Within S&P style indexes, S&P 500 Growth returned -0.29% versus -0.37% for S&P 500 Value, a small growth advantage rather than a decisive factor rotation. NYSE decliners led advancers 1.95-to-1, and total U.S. share volume was about 15.65 billion shares versus a 20-session average of 15.58 billion, suggesting the selling was broad enough to matter even though volatility remained contained.
Institutional Flow Insight: The tape is consistent with institutions protecting inflation-sensitive risk budgets while preserving exposure to earnings-visible technology franchises. The energy bid can reasonably be linked to higher realized commodity prices and stronger near-term cash-flow sensitivity, whereas utilities faced both higher discount rates and a sudden increase in regulatory financing uncertainty. The weaker equal-weight and small-cap performance also suggests investors were not embracing broad economic beta. Because August 31 was month-end, some rebalancing may have amplified flows, but the available market data do not establish month-end rebalancing as the primary cause.
2. Decoding the Biggest Market Movers
Edison International (EIX)
Edison International closed down 23.1%, one of the most severe S&P 500 moves of the session. The catalyst was California’s revised Senate Bill 492 wildfire package. Governor Gavin Newsom described the compromise as meaningful progress but explicitly said the system still requires full structural reform to secure the Wildfire Fund’s long-term durability. Southern California Edison said the amended bill did not provide the durable structural reform or stable financing framework utilities need.
The magnitude of the selloff is best understood as a cost-of-capital and tail-risk repricing rather than an earnings reset. In Edison International’s latest official second-quarter release, the company reported Q2 2026 GAAP EPS of $1.39 and core EPS of $1.54, and reaffirmed 2026 core EPS guidance of $5.90 to $6.20. More importantly, the CEO and CFO’s official prepared earnings-call remarks had already stated that the quality of wildfire legislation would influence the cost of capital and future capital deployment, and that an insufficiently predictable framework could make customer investments more expensive. Monday’s price action therefore reflected a materially higher required return on regulated utility equity despite intact near-term earnings guidance.
PG&E Corporation (PCG)
PG&E fell 20.1%, its largest percentage loss in more than six years. In an August 31 SEC filing, PG&E said it does not believe SB 492 adequately addresses the financing risks created by California’s wildfire-liability framework and said the measure falls short of the long-term durability needed to attract affordable investment. The company scheduled an investor update for September 2, 2026, at 8:30 a.m. ET to discuss its response.
Again, the move was not triggered by a new quarterly earnings miss. PG&E’s latest official Q2 2026 release reported GAAP EPS of $0.33 and non-GAAP core EPS of $0.40, while reaffirming full-year non-GAAP core EPS guidance of $1.64 to $1.66. That distinction matters for sector valuation: regulated utilities are often valued on earnings visibility and financing access, so a legislative outcome that raises uncertainty around catastrophic-liability funding can widen the equity risk premium even when the base earnings trajectory is unchanged. The simultaneous collapse in EIX and PCG shows that California wildfire policy became a sector-level valuation input, not merely an idiosyncratic headline.
3. Macro Indicators and Market Outlook
The Cboe VIX closed at 14.92, up 0.49 point or 3.40% from 14.43. The direction was consistent with the equity decline, but the absolute level remained below 15. That combination points to a moderate increase in demand for downside protection and event hedges rather than disorderly risk liquidation. The broader tape supports that interpretation: breadth was weak and equal-weight stocks underperformed, but the Nasdaq fell only modestly and implied volatility did not signal acute stress.
The U.S. Treasury’s official constant-maturity closing data showed the 2-year yield at 4.34%, unchanged from Friday, while the 10-year yield rose 2 basis points to 4.75%. The 2s10s spread therefore widened to about 41 basis points from 39 basis points. With crude prices rising sharply and the front end comparatively stable, the day’s curve move is more consistent with pressure on longer-run inflation compensation and term premium than with a simple, confirmed shift in the next Fed decision. Markets were also digesting Federal Reserve Chair Kevin Warsh’s hawkish Jackson Hole remarks, but a single day’s yield change should not be treated as proof of a particular September policy outcome.
Oil provided the clearest cross-asset explanation for equity rotation. Brent settled at $90.49 a barrel, up 2.71%, and WTI settled at $85.76, up 2.83%, after renewed U.S.-Iran military exchanges. Higher crude supported energy cash flows while simultaneously raising concerns about input costs, inflation persistence and the discount rate applied to long-duration equities.
Upcoming Economic Data & Catalysts:
- U.S. Employment Situation for August 2026 (Release date: September 4, 2026): Payroll growth, unemployment and wage data will be central to the market’s assessment of labor-market resilience and how much policy restraint the economy can absorb.
- U.S. Consumer Price Index for August 2026 (Release date: September 11, 2026): Headline and core inflation will be critical for determining whether the oil shock is reinforcing broader price pressure and for calibrating rate-sensitive equity valuations.
Only officially scheduled releases after the August 31 close are included above.
Market Insights:
The session was better characterized as broad but controlled risk reduction than as a selloff driven by a handful of mega-cap stocks. The equal-weight proxy fell more than the S&P 500, small caps underperformed, NYSE breadth was negative and most sectors were weak. Relative resilience in technology and the Nasdaq softened the capitalization-weighted index decline, while energy was an event-driven exception. A reversal of the current pattern would likely require some combination of lower oil prices, stabilization in long Treasury yields and improving breadth. Conversely, a renewed yield spike, weaker earnings revisions, further Middle East escalation, deterioration in breadth or a sustained move higher in implied volatility would argue for tighter risk budgets.
Trading & Investment Strategy:
Risk management should take priority over chasing Monday’s strongest or weakest groups. For diversified portfolios, staged entries are preferable to reacting to one-day geopolitical moves, particularly in energy after a sharp crude-price jump. Rate-sensitive utility exposure warrants selectivity until California’s financing framework is clearer, while higher-quality companies with durable free cash flow and earnings visibility remain better positioned if long yields stay elevated. Position sizes should reflect volatility, entry levels should be planned in tranches, and predetermined stop-loss or portfolio-risk limits can help prevent a policy or geopolitical headline from becoming an outsized drawdown. Investors should avoid using leverage to compensate for uncertain direction.
4. Key FAQs About the US Stock Market Today
Why did the US stock market move on August 31, 2026?
U.S. stocks fell as renewed U.S.-Iran military strikes pushed oil prices sharply higher, reviving inflation concerns and lifting long Treasury yields. Federal Reserve Chair Kevin Warsh’s hawkish Jackson Hole tone kept policy sensitivity elevated, while California wildfire-liability legislation triggered severe losses in Edison International and PG&E. The result was broad, though not disorderly, risk reduction.
Which sectors performed best and worst in the US stock market on August 31, 2026?
Energy was the strongest S&P 500 sector, confirmed by the broad market close and reflected in a 2.04% gain for the Energy Select Sector SPDR proxy. Communication Services was the weakest among the liquid sector ETF proxies at -1.35%, while Utilities fell about 1.17% as EIX and PCG collapsed on California wildfire-financing concerns. The rotation favored direct commodity beneficiaries rather than cyclicals as a whole.
What should investors watch after the US stock market close on August 31, 2026?
The next key checkpoints are PG&E’s September 2 investor update on SB 492, the August Employment Situation on September 4 and the August CPI on September 11. In markets, the most useful confirmation signals are whether the 10-year Treasury yield can stabilize near or below the current 4.75% area, whether equal-weight breadth improves, and whether the VIX remains contained in the mid-teens. Those indicators will help distinguish a temporary event-driven rotation from a more persistent tightening in financial conditions.
Selected Primary Sources
Disclaimer: This article is intended solely for the exchange of investment ideas and does not constitute investment advice of any kind.