

Key Takeaways
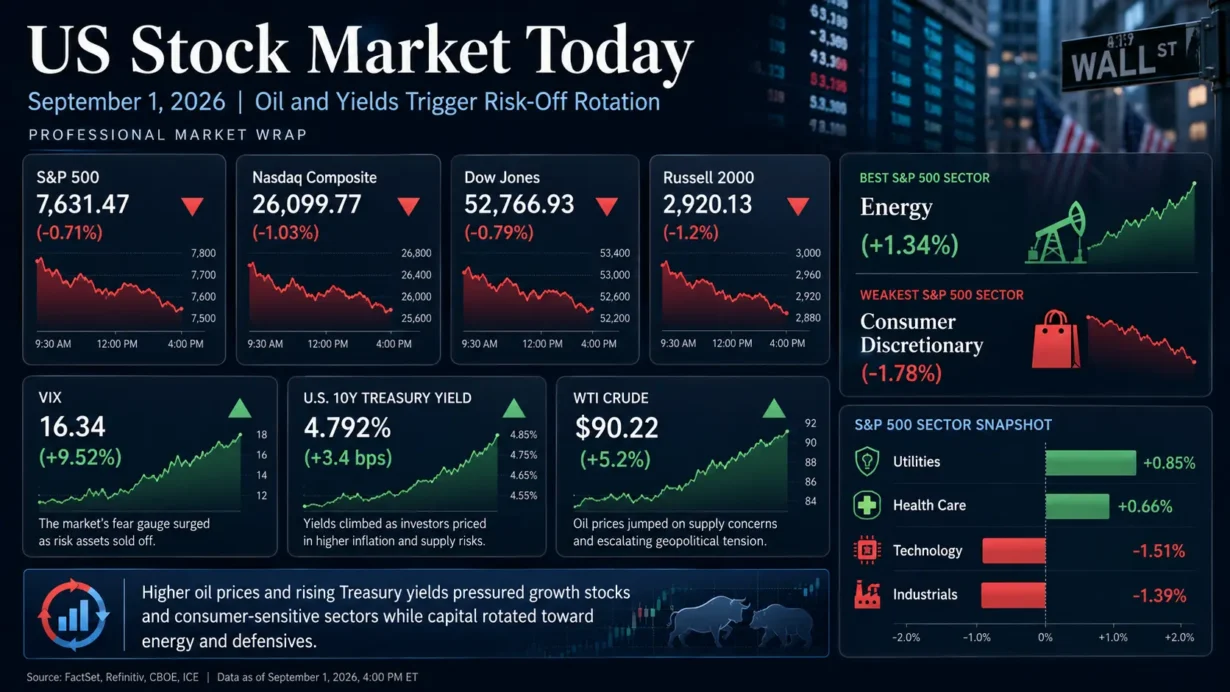
- The S&P 500 fell 0.71% to 7,631.47, the Dow Jones Industrial Average lost 0.79% to 52,766.93, and the Nasdaq Composite dropped 1.03% to 26,099.77 as higher oil prices and Treasury yields tightened financial conditions.
- Energy was the strongest S&P 500 sector at +1.34%, while consumer discretionary was the weakest at -1.78%; technology fell 1.51%, highlighting pressure on long-duration growth exposures.
- Market breadth was clearly negative: decliners outnumbered advancers by 2.8-to-1 on both the NYSE and Nasdaq, while total U.S. exchange volume of 14.38 billion shares remained below the 20-day average of 15.35 billion.
- WTI crude settled at $90.22, up 5.2%, while the 10-year Treasury yield rose 3.4 basis points to 4.792%, reinforcing inflation and valuation concerns.
- The Cboe VIX closed at 16.34, up 9.52%, signaling higher hedging demand but not a disorderly volatility event.
1. Market Capital Flows and Sector Rotation
The September opening session produced a classic inflation-sensitive rotation rather than an indiscriminate liquidation. S&P Dow Jones Indices data showed Energy up 1.34%, Utilities up 0.85%, Health Care up 0.66%, and Consumer Staples up 0.32%. At the other end, Consumer Discretionary fell 1.78%, Technology dropped 1.51%, Industrials lost 1.39%, and Materials declined 1.19%. Financials fell 0.88%, Communication Services lost 0.56%, and Real Estate slipped 0.13%.
The relative-performance pattern favored cash-flow visibility, defensive earnings and direct commodity exposure over long-duration growth and economically sensitive consumer demand. Large-cap growth was pressured by technology weakness and the Nasdaq’s 1.03% decline, while small caps were even softer, with the Russell 2000 down about 1.2%. Cyclicals were mixed rather than uniformly weak: energy benefited directly from the oil shock, but transportation and discretionary shares were hit by the combination of higher input costs, higher discount rates and weaker risk appetite. Defensive sectors generally held up better, suggesting investors were reducing portfolio beta rather than abandoning equities across the board.
Market breadth confirmed that the weakness extended beyond a handful of mega-cap names. Declining stocks outnumbered advancers by 2.8-to-1 on both the NYSE and Nasdaq. The S&P 500 recorded nine new 52-week highs and 13 new lows, while the Nasdaq posted 30 new highs and 161 new lows. U.S. exchange volume totaled 14.38 billion shares versus a 20-session average of 15.35 billion, indicating broad selling pressure without the exceptionally heavy turnover usually associated with capitulation.
Institutional Flow Insight: The sector pattern is consistent with institutions reducing duration and cyclical-consumption risk as nominal yields and energy costs rose simultaneously. Energy offered an immediate earnings sensitivity to higher crude prices, while utilities, health care and staples offered relatively steadier earnings visibility. The underperformance of technology and discretionary stocks can reasonably be interpreted as a valuation and risk-budget response to higher discount rates, but it should not be treated as proof of specific institutional order flow. The first trading day of September can also bring portfolio rebalancing, though the day’s macro shock was large enough that month-start mechanics were likely secondary.
2. Decoding the Biggest Market Movers
Medtronic (MDT)
Medtronic closed at $93.35, up 1.14%, after reporting fiscal first-quarter 2027 results before the market opened and raising full-year guidance. The company reported revenue of $9.756 billion, up 13.7% as reported and 13.7% organically. GAAP diluted EPS was $1.14 and non-GAAP diluted EPS was $1.45. GAAP operating margin was 18.1%, up 120 basis points year over year, while non-GAAP operating margin was 23.7%, up 10 basis points. Medtronic raised fiscal 2027 organic revenue-growth guidance to 7.25%-7.75% from 6.75%-7.25% and lifted non-GAAP diluted EPS guidance to $5.94-$6.00 from $5.90-$6.00.
The quality of the beat mattered as much as the headline numbers. Cardiovascular revenue reached $3.927 billion, with organic growth of 18.9%, including 88% growth in Cardiac Ablation Solutions. Management also highlighted continued investment in robotic surgery and cardiovascular technologies. The quarter benefited from an extra fiscal week, which the company estimated added roughly $570 million to organic growth, an important normalization point for investors assessing the underlying run rate.
For the health-care sector, Medtronic’s results reinforced a broader preference for companies with visible procedure demand, product-cycle support and company-specific earnings momentum. In a session when higher yields punished long-duration growth assets, a raised outlook and stronger operating execution gave investors a fundamental reason to maintain exposure to medical technology.
Apple (AAPL)
Apple rose 2.61% to $325.13, sharply outperforming the broader market on the day John Ternus formally became chief executive officer and Tim Cook moved to the executive chairman role. Apple had announced the succession in April, with the transition approved unanimously by the board and effective September 1. The stock’s gain therefore reflected the market’s response to a planned leadership handoff rather than a surprise announcement.
The strategic read-through is more important than the one-day price move. Ternus inherits a company with a massive installed base, a large recurring-services business and premium hardware economics, but also with high investor expectations around artificial intelligence, product innovation and capital efficiency. Apple’s resilience helped offset part of the technology sector’s broader decline and showed that company-specific catalysts could still overpower the day’s macro pressure. Even so, one session of leadership-transition optimism does not remove the valuation sensitivity that affects mega-cap technology when Treasury yields move materially higher.
3. Macro Indicators and Market Outlook
The Cboe VIX closed at 16.34, up 1.42 points or 9.52%. The move was directionally consistent with the equity selloff and reflected higher demand for near-term S&P 500 option protection. However, a mid-teens VIX still points to elevated caution rather than panic. The combination of a falling equity market, weaker breadth and a higher VIX indicates a genuine risk-off session, but not yet a volatility regime break.
Rates were the central transmission channel. The U.S. 10-year Treasury yield rose 3.4 basis points to 4.792%, after touching 4.798%, its highest level since January 2025. The 2-year yield rose to roughly 4.37% from about 4.34% in the prior session. The front-end move reflected increased sensitivity to the Federal Reserve’s inflation reaction function, while the elevated 10-year yield also embedded concerns about inflation persistence, fiscal supply and term premium. A single day’s increase should not be treated as definitive evidence of a future rate hike, but the direction of travel raised the hurdle rate for equity valuations, particularly for long-duration growth stocks.
Oil provided the clearest cross-asset explanation for the sector rotation. WTI crude rose $4.46, or 5.2%, to settle at $90.22 per barrel, while Brent gained 4.6% to $94.65. Renewed U.S. strikes on Iranian targets and continuing risks around the Strait of Hormuz lifted the inflation risk premium and directly supported energy equities. The simultaneous rise in crude and bond yields created a particularly difficult backdrop for consumer discretionary, transportation and technology shares.
Upcoming Economic Data & Catalysts:
- U.S. International Trade in Goods and Services, July 2026 (Release date: September 3, 2026): Investors will watch the trade balance and import-price implications for growth, inventories and the inflation outlook, particularly while energy prices and tariffs remain important macro variables.
- Employment Situation, August 2026 (Release date: September 4, 2026): Payroll growth, unemployment, wage growth and revisions will be critical for assessing labor-market resilience and the balance between inflation risk and growth risk in Federal Reserve policy expectations.
Market Insights:
The September 1 decline was broader than a mega-cap-only selloff. Negative breadth, a 2.1% decline in the Philadelphia Semiconductor Index and weakness in transports and small caps indicate that risk reduction spread across multiple parts of the market. At the same time, the strength in energy and defensive sectors shows that capital was rotating rather than simply exiting equities. The most important reversal risks are a renewed acceleration in Treasury yields, further oil-price gains, deterioration in market breadth, downward earnings revisions or a sustained VIX move above its recent range. Conversely, stabilization in crude and yields would reduce the valuation pressure currently concentrated in growth and consumer-sensitive equities.
Trading & Investment Strategy:
Risk management should take priority over chasing the strongest one-day sector moves. Investors can consider scaling into positions rather than deploying capital all at once, favoring companies with strong balance sheets, visible earnings and pricing power. Energy exposure may remain useful as an inflation hedge, but chasing vertical oil-driven moves can create poor entry points if geopolitical risk premiums reverse. In technology, higher yields argue for greater selectivity and valuation discipline. Position sizing, predefined exit levels and diversification across earnings drivers remain more important than making a binary call on the next Federal Reserve decision.
4. Key FAQs About the US Stock Market Today
Why did the US stock market move on September 1, 2026?
U.S. stocks fell because rising oil prices and higher Treasury yields tightened financial conditions and revived inflation concerns. Renewed Middle East hostilities pushed WTI crude above $90, while the 10-year Treasury yield approached 4.80%. The resulting increase in discount rates weighed on technology and consumer-sensitive stocks, while softer market breadth confirmed a broader reduction in risk appetite.
Which sectors performed best and worst in the US stock market on September 1, 2026?
Energy was the best-performing S&P 500 sector, rising 1.34% as crude prices surged. Utilities gained 0.85% and Health Care rose 0.66%, reflecting demand for defensive and earnings-resilient exposures. Consumer Discretionary was the weakest sector at -1.78%, followed by Technology at -1.51% and Industrials at -1.39%, as higher yields, input costs and weaker risk appetite pressured cyclical and long-duration assets.
What should investors watch after the US stock market close on September 1, 2026?
The key near-term signals are the direction of the 2-year and 10-year Treasury yields, whether WTI crude can sustain levels above $90, and whether market breadth improves after a 2.8-to-1 decliner-to-advancer session. Investors should also watch the September 3 U.S. trade report and the September 4 Employment Situation for evidence that could alter growth, inflation and Federal Reserve expectations. A sustained rise in the VIX or renewed weakness in semiconductors and small caps would indicate that risk reduction is becoming more persistent.
Selected Primary Sources
Disclaimer: This article is intended solely for the exchange of investment ideas and does not constitute investment advice of any kind.