

Key Takeaways
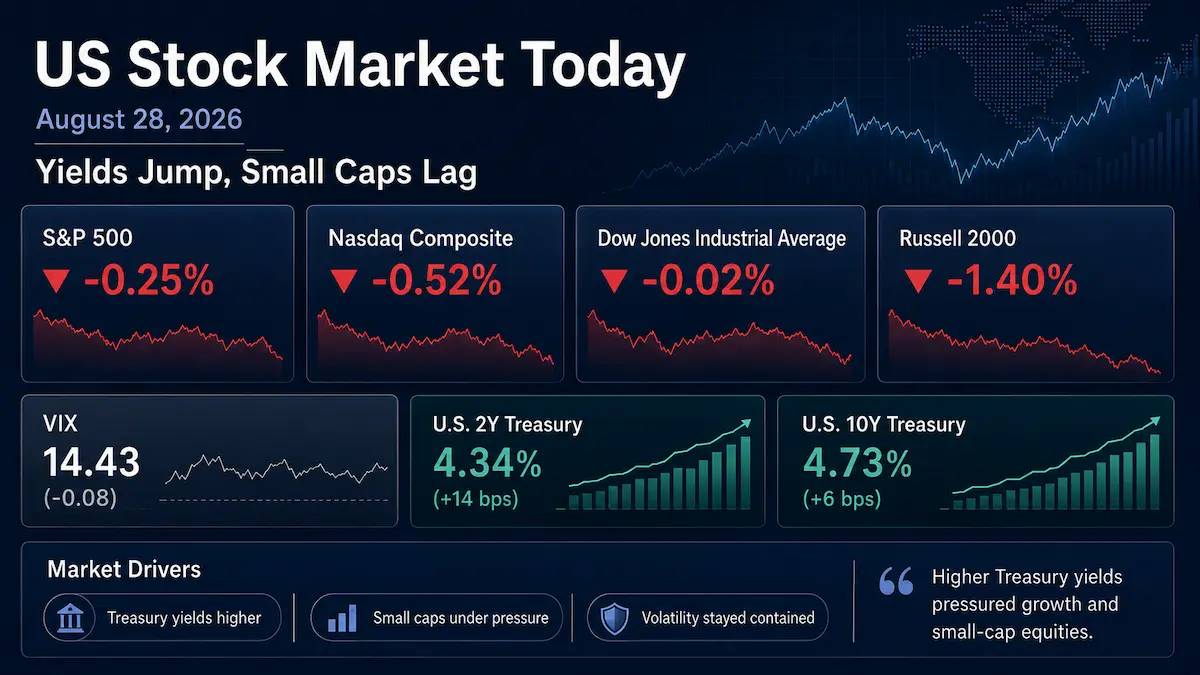
- US equities finished modestly lower on Friday, August 28, 2026: the S&P 500 fell 0.25% to 7,711.76, the Nasdaq Composite lost 0.52% to 26,402.42, and the Dow Jones Industrial Average slipped 0.02% to 53,559.99. The Russell 2000 dropped 1.4% to 2,972.37, showing materially weaker risk appetite below the mega-cap tier.
- Communication Services was the strongest S&P 500 sector, gaining 1.57%, while Information Technology was the weakest, falling 1.29%. The cross-section looked more like rate-duration de-risking than a clean risk-off move into defensives.
- Federal Reserve Chair Kevin Warsh reiterated that inflation remains too high and that policymakers need greater confidence that underlying inflation is moving toward the 2% objective. The Treasury curve bear-flattened: the official US Treasury daily curve showed the 2-year yield at 4.34%, up 14 basis points from August 27, and the 10-year at 4.73%, up 6 basis points.
- Risk aversion was selective rather than systemic. The Cboe VIX closed at 14.43, down 0.55%, even as market breadth weakened. Final August University of Michigan consumer sentiment was 51.7, down from 55.2 in July.
1. Market Capital Flows and Sector Rotation
Friday’s tape showed a sharp distinction between index-level resilience and weaker participation underneath. Communication Services led the S&P 500 with a 1.57% gain, helped by strength in large platform companies, while Information Technology fell 1.29% as semiconductors reversed part of the prior session’s earnings-driven rally. The S&P 500 declined only 0.25%, but the Russell 2000 fell 1.4%, indicating that smaller companies with greater financing sensitivity and less earnings visibility absorbed more of the rate shock. The Nasdaq’s 0.52% decline versus the Dow’s near-flat finish was consistent with relative resilience in lower-duration, value-leaning blue-chip exposure, although the session did not amount to a broad value rally. Likewise, the pattern was not a textbook cyclical-to-defensive rotation: the dominant factor was sensitivity to discount rates, balance-sheet strength, and company-specific earnings visibility.
Market breadth confirmed that the headline indexes understated the weakness. On the NYSE, declining issues outnumbered advancers by 1.77 to 1; on Nasdaq, decliners led by 2.19 to 1. US exchange volume was about 15.68 billion shares, close to but slightly below the 20-day average of 15.8 billion. That combination matters: the pullback was broad enough to warrant attention, but it did not come with the kind of volume expansion normally associated with disorderly liquidation.
Institutional Flow Insight: A reasonable interpretation is that institutions trimmed rate-sensitive duration rather than abandoning equity risk wholesale. The sharp increase in the 2-year Treasury yield raised the discount rate applied to long-duration growth assets, while small caps faced the additional burden of higher refinancing sensitivity. At the same time, the resilience of selected mega-cap communication-services names suggests continued preference for businesses with strong cash generation and earnings visibility. With one trading session still left in August, month-end rebalancing may have influenced individual flows, but public market data do not justify treating it as the primary driver. The lower VIX also argues against assuming a broad reduction in institutional risk budgets; the evidence is more consistent with selective repositioning.
2. Decoding the Biggest Market Movers
NVIDIA Corporation (NVDA)
NVIDIA closed down 4.6%, making it one of the most consequential drags on the major indexes because of its weight in both the S&P 500 and Nasdaq. The decline followed the prior session’s strong earnings reaction and coincided with a pronounced repricing in Treasury yields. The company’s underlying reported fundamentals remained exceptionally strong: NVIDIA’s official Investor Relations release for fiscal second-quarter 2027 reported revenue of $96.2 billion, up 106% year over year, including Data Center revenue of $89.0 billion, up 117%. GAAP gross margin was 75.0%, GAAP diluted EPS was $2.46, and non-GAAP diluted EPS was $2.22.
NVIDIA’s official outlook called for fiscal third-quarter revenue of $108.0 billion, plus or minus 2%, with GAAP and non-GAAP gross margin of 74.0%, plus or minus 50 basis points. The company explicitly stated that the outlook assumes no China Data Center compute revenue. In the corrected earnings-call transcript hosted on NVIDIA’s Investor Relations website, management also said it expects approximately 70% revenue growth in fiscal 2028 while remaining supply-constrained. Those are company-issued figures and guidance, not analyst estimates.
The transcript also broadened the market’s diligence agenda beyond near-term revenue. Management discussed nearly $50 billion invested in frontier AI labs and financing partnerships intended to mobilize more than $500 billion of third-party capital for AI infrastructure. Management directly addressed investor concerns about so-called circular financing and argued that the fungibility of computing capacity limits the risk. That is management’s assessment rather than an independently verified conclusion, and there is no evidence that one transcript remark alone caused Friday’s selloff.
For the broader market, NVIDIA’s 4.6% reversal reinforced the message that even superior earnings growth does not immunize high-multiple AI leaders from a higher discount-rate environment. Marvell Technology’s separate 10.3% decline added to semiconductor weakness, increasing pressure on sector multiples. The important portfolio implication is not that the AI earnings cycle has broken, but that valuation sensitivity rises when front-end yields reprice quickly. In that environment, investors are likely to demand more proof that extraordinary revenue growth can convert into durable free cash flow without an equally extraordinary increase in capital intensity.
3. Macro Indicators and Market Outlook
The Cboe VIX finished at 14.43, down 0.55% from 14.51 in the prior session. That divergence is informative: equities fell, yet implied volatility did not rise. The move therefore looked less like a panic-driven hedging event and more like a controlled repricing within equities. A low VIX does not eliminate risk, especially when breadth is weak, but Friday’s close did not show evidence of a broad rush for index-level downside protection.
Rates delivered the clearer macro signal. The US Treasury’s official August 28 daily par yield curve showed the 2-year yield at 4.34%, up 14 basis points from 4.20% on August 27, while the 10-year yield rose to 4.73% from 4.67%, a 6-basis-point increase. The 2s10s spread therefore narrowed to about 39 basis points from 47 basis points, a bear-flattening move driven by a larger rise at the front end. That is consistent with investors assigning more weight to the possibility that policy will need to remain restrictive, but a one-day move cannot be treated as proof of a specific September rate decision.
The catalyst was Fed Chair Kevin Warsh’s inflation message. In his August 28 speech, he reiterated that the Federal Reserve’s 2% PCE inflation objective is a firm target and noted that 12-month PCE inflation stood at 3.7%. He also said policymakers need confidence that underlying inflation is moving toward target clearly and at sufficient speed, otherwise “we have work to do.” The market response therefore reflected a reassessment of near-term policy risk rather than a definitive change in the Fed’s future path. Final August consumer sentiment at 51.7, down from 55.2 in July, added a softer demand signal, creating an uncomfortable mix of still-elevated inflation and weaker household confidence.
Upcoming Economic Data & Catalysts:
- Job Openings and Labor Turnover Survey, July 2026 (Release date: September 1, 2026): The market will focus on job openings, hiring, and quits as evidence of whether labor demand is cooling enough to reduce wage pressure without signaling an abrupt deterioration in growth.
- Employment Situation, August 2026 (Release date: September 4, 2026): Nonfarm payrolls, unemployment, and average hourly earnings will be central to the next round of rate repricing because they bear directly on labor-market resilience, inflation persistence, and the Fed’s policy trade-off.
Market Insights: Friday was not a broad risk-on session, but neither was it a conventional risk-off liquidation. Weak breadth, a 1.4% Russell 2000 decline, and a technology-led selloff point to selective de-risking, while the lower VIX and strength in Communication Services show that capital remained willing to own highly cash-generative mega-cap franchises. The next leg could reverse if front-end yields retreat and breadth improves, but the opposite risks are equally clear: another sharp yield spike, further narrowing in market participation, downward earnings revisions, policy surprises, or a sustained VIX breakout would challenge the current index-level resilience.
Trading & Investment Strategy: Portfolio construction should emphasize position sizing rather than directional conviction. Investors can scale new exposure in tranches, favor companies with visible free cash flow and balance-sheet flexibility, and avoid chasing post-earnings gaps when rates are repricing quickly. Rate-sensitive growth positions deserve tighter thesis-invalidation levels because duration risk can overwhelm otherwise strong fundamentals over short horizons. Diversification across sectors and factors remains preferable to concentrating risk in a single AI or mega-cap theme, and stop-loss or risk-reduction rules should be defined before volatility expands rather than after a drawdown is underway.
4. Key FAQs About the US Stock Market Today
Why did the US stock market move on August 28, 2026?
US stocks moved lower primarily because Fed Chair Kevin Warsh’s inflation-focused remarks triggered a sharp rise in Treasury yields, especially at the 2-year maturity. Higher discount rates pressured technology and small-cap stocks, while a post-earnings reversal in NVIDIA amplified weakness in the semiconductor complex. The decline remained orderly, however, because the VIX fell and selected mega-cap communication-services stocks held up.
Which sectors performed best and worst in the US stock market on August 28, 2026?
Communication Services was the best-performing S&P 500 sector, gaining 1.57%, while Information Technology was the worst, falling 1.29%. The rotation reflected selective preference for cash-generative platform businesses and pressure on more rate-sensitive technology exposure, rather than a simple shift from growth into traditional defensive sectors.
What should investors watch after the US stock market close on August 28, 2026?
The next near-term macro tests are the July JOLTS report on September 1 and the August Employment Situation on September 4. Investors should also monitor whether the 2-year Treasury yield holds above the levels reached after Warsh’s speech, whether market breadth stabilizes, and whether semiconductor weakness spreads into the broader index. A lower VIX alongside deteriorating breadth can persist for a time, but a simultaneous rise in yields and volatility would represent a more meaningful tightening in financial conditions.
Selected Primary Sources
Disclaimer: This article is intended solely for the exchange of investment ideas and does not constitute investment advice of any kind.