Key Takeaways
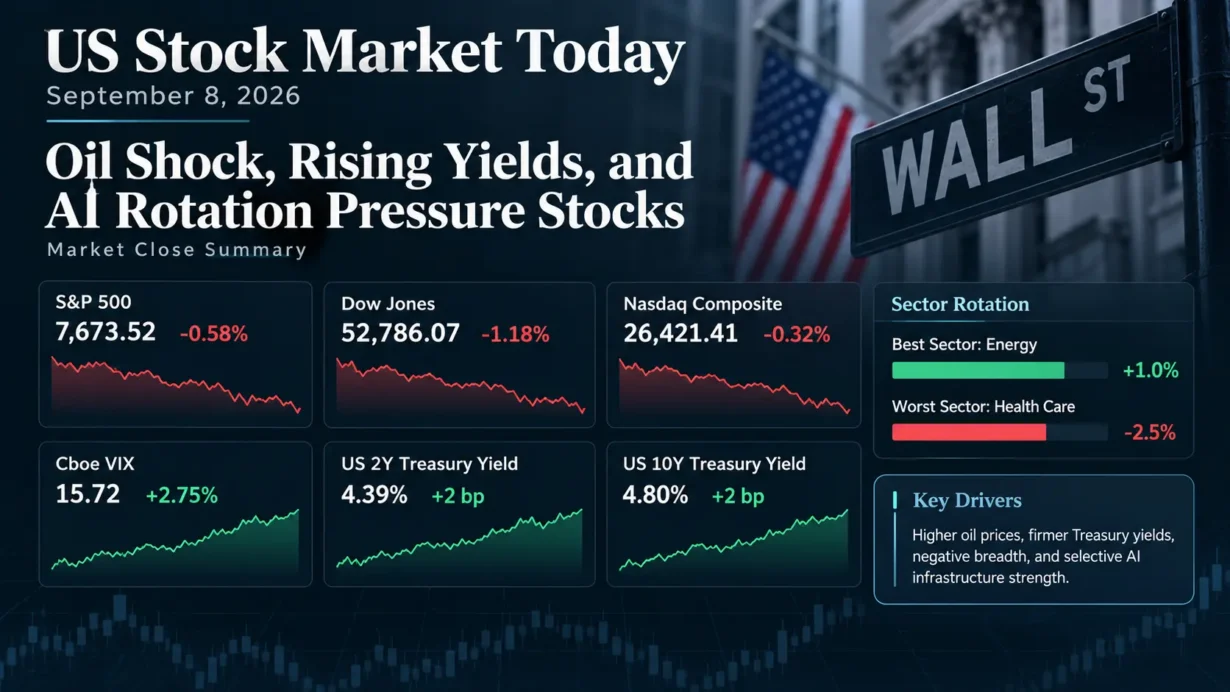
- The S&P 500 fell 0.58% to 7,673.52, the Dow Jones Industrial Average dropped 1.18% to 52,786.07, and the Nasdaq Composite declined 0.32% to 26,421.41 as higher oil prices and Treasury yields tightened financial conditions.
- Energy led the S&P 500 with a 1.0% gain as Brent crude rose 2.13% to $99.07 and U.S. crude gained 2.82% to $94.05. Health Care was the weakest major sector, falling roughly 2.5%, with sector-tracking XLV down 2.52%.
- Market breadth was clearly negative: declining S&P 500 stocks outnumbered advancers by about 2.4 to 1, while U.S. equity volume reached 15.7 billion shares versus a 14.9 billion 20-session average.
- AI-related leadership split sharply. Semiconductor and infrastructure names benefited from fresh commercial commitments, while software stocks weakened on competitive and disruption concerns.
- Cboe VIX closed at 15.72, up 2.75%, while the U.S. 2-year and 10-year Treasury yields both rose 2 basis points to 4.39% and 4.80%, respectively, keeping inflation and Federal Reserve policy risk in focus ahead of PPI and CPI.
1. Market Capital Flows and Sector Rotation
Energy was the strongest S&P 500 sector, with the S&P 500 Energy index up 1.0% as geopolitical risk lifted crude prices and improved near-term cash-flow expectations for producers and refiners. Health Care was the weakest major group, down roughly 2.5%, with the Health Care Select Sector SPDR Fund closing 2.52% lower as a sharp decline in Amgen amplified biotechnology and large-cap pharmaceutical risk aversion. The Russell 2000 fell about 0.5%, broadly in line with the S&P 500, so the session did not produce a decisive large-cap versus small-cap factor signal. The Nasdaq’s 0.32% decline was milder than the Dow’s 1.18% drop, but that relative resilience was driven more by semiconductor and AI-infrastructure strength than by a broad growth-stock rally. Cyclical Energy outperformed while defensive Health Care lagged, and software weakness prevented the session from fitting a simple growth-versus-value template.
Breadth was weaker than the headline index moves suggested. Decliners outnumbered advancers in the S&P 500 by approximately 2.4 to 1, and aggregate U.S. equity volume rose to 15.7 billion shares compared with a 14.9 billion average over the prior 20 sessions. That combination indicates that selling pressure was broader than a handful of mega-cap stocks, even though strength in selected semiconductor names cushioned the cap-weighted S&P 500 and Nasdaq.
Institutional Flow Insight: A plausible institutional interpretation is that portfolios were rewarding businesses with near-term commodity leverage or visible AI-capex demand while reducing exposure to duration-sensitive software and event-risk-heavy health care. Higher Treasury yields raise the discount-rate burden on long-duration equities, while crude near $100 increases the appeal of Energy as an earnings and inflation hedge. At the same time, company-specific AI infrastructure contracts can improve revenue visibility for chip suppliers even when the broader market de-rates. Public market data do not prove a coordinated institutional rebalance, however, and there is insufficient evidence to identify month-start or quarter-start rebalancing as the primary cause of the rotation.
2. Decoding the Biggest Market Movers:
Qualcomm (QCOM)
Qualcomm closed at $174.09, up 3.17%. The move followed an expanded multi-generation collaboration with Amazon focused on customized silicon for large AI data centers, including AI inference, high-speed optical connectivity and broader use of AWS AI infrastructure in Qualcomm’s chip-design workflows. An SEC filing also disclosed that Qualcomm issued an Amazon affiliate a warrant covering up to 25 million shares at an exercise price of $161.26, adding a potential dilution consideration if exercised. The commercial significance is that Qualcomm is attempting to diversify beyond handsets into data-center compute at a time when its latest fiscal third-quarter results showed $9.947 billion of revenue, down 4% year over year, GAAP EPS of $1.87 and non-GAAP EPS of $2.21. QCT revenue was $8.504 billion with a 26% EBT margin, while QTL revenue was $1.278 billion with a 69% EBT margin. Automotive revenue grew 61% to $1.588 billion and IoT revenue rose 9% to $1.830 billion, partially offsetting a 20% decline in handset revenue to $5.086 billion. Management’s official fiscal fourth-quarter guidance is $9.7 billion to $10.5 billion of revenue and $2.05 to $2.25 of non-GAAP diluted EPS. For the broader semiconductor complex, the Amazon agreement reinforced the market’s willingness to pay for companies with credible AI-infrastructure revenue pathways, helping offset weakness elsewhere in technology.
Amgen (AMGN)
Amgen closed at $393.17, down 10.08%, making it one of the most consequential large-cap losers of the session and a material drag on both Health Care and the price-weighted Dow. The primary read-through came from Novartis’ September 4 announcement that pelacarsen, an investigational treatment designed to lower lipoprotein(a), failed to meet the primary endpoint in the Phase III Lp(a)HORIZON cardiovascular outcomes trial despite lowering Lp(a). Because Amgen’s olpasiran also targets elevated Lp(a), investors repriced the probability that lowering the biomarker will translate into sufficiently strong cardiovascular outcomes, although pelacarsen and olpasiran are different therapies and the Novartis result does not determine Amgen’s trial outcome. Amgen also announced positive Phase III DeLLphi-305 results for IMDELLTRA plus durvalumab in extensive-stage small-cell lung cancer on September 8, but that favorable oncology update did not offset the Lp(a) concern. The selloff was not triggered by an earnings miss: Amgen’s latest second-quarter revenue was $10.1 billion, up 10% year over year, GAAP EPS was $4.37, non-GAAP EPS was $6.29, GAAP operating margin was 36.8%, and non-GAAP operating margin as a percentage of product sales was 48.4%. Its official 2026 guidance calls for revenue of $38.2 billion to $39.4 billion and non-GAAP EPS of $22.30 to $23.50. The market reaction therefore represented pipeline-duration and target-validation risk rather than a deterioration in reported quarterly fundamentals, with an immediate valuation spillover across biotechnology and cardiovascular drug developers exposed to similar clinical assumptions.
3. Macro Indicators and Market Outlook
Cboe VIX closed at 15.72, up 0.42 point or 2.75% from the prior close of 15.30. The rise was directionally consistent with weaker equities and increased event risk, but the absolute level remained contained rather than signaling disorderly hedging or broad market stress. The options market was paying more for protection, yet the move looked more like a modest repricing of macro and geopolitical risk than a volatility shock.
The U.S. Treasury’s official daily par yield curve showed the 2-year yield at 4.39% and the 10-year yield at 4.80% on September 8, both 2 basis points above the prior trading session. The 2s10s spread therefore remained near positive 41 basis points rather than materially steepening or flattening. Higher front-end yields were consistent with a market reassessing the likelihood that the Federal Reserve will need to remain restrictive as inflation risks persist, while the 10-year move also reflected growth, inflation and term-premium uncertainty. Rate futures assigned roughly a 60% probability to a September rate increase, but a single day’s yield move or futures price cannot be treated as confirmation of a policy decision.
Oil provided the clearest cross-asset explanation for the equity rotation. Brent crude rose 2.13% to $99.07 and U.S. crude gained 2.82% to $94.05 amid attacks on Saudi energy facilities, reduced shipping through the Strait of Hormuz and renewed regional escalation risk. That combination supported Energy earnings expectations while simultaneously increasing inflation sensitivity across rate markets and compressing valuation tolerance in longer-duration equities.
Upcoming Economic Data & Catalysts:
- Producer Price Index for August 2026 (Release date: September 10, 2026): Investors will focus on headline and core producer inflation for evidence on pipeline price pressure, particularly after the renewed oil shock. A hotter or broader inflation profile could keep upward pressure on Treasury yields and valuation-sensitive equities.
- Consumer Price Index for August 2026 (Release date: September 11, 2026): CPI will be the most important near-term test of whether inflation is broadening beyond energy-sensitive components. The report can materially affect rate expectations, equity risk premia and the relative performance of long-duration growth versus cash-flow-rich value sectors.
Both release dates are confirmed on the U.S. Bureau of Labor Statistics calendar and occur after the September 8 market close.
Market Insights:
The session was broader than a single-stock selloff because S&P 500 breadth was decisively negative and trading volume was above its recent average. Still, leadership was highly selective: semiconductor and AI-infrastructure beneficiaries limited Nasdaq weakness, while Amgen’s decline exaggerated pressure on the Dow and Health Care. The most important reversal risks are a further jump in Treasury yields, deterioration in market breadth, downward earnings revisions, renewed geopolitical escalation, a sustained VIX breakout, or valuation compression in crowded AI-linked trades.
Trading & Investment Strategy:
Risk management should take precedence over directional conviction ahead of PPI and CPI. Investors can keep position sizes calibrated to event risk, deploy capital in stages rather than chase one-day Energy or semiconductor moves, and favor companies where earnings visibility and balance-sheet strength justify valuation. Predefined loss limits are especially important around binary biotechnology and macro events. For longer-horizon portfolios, the better framework is to distinguish durable cash-flow improvement from temporary price momentum and to avoid adding leverage simply because volatility remains below stressed levels.
4. Key FAQs About the US Stock Market Today
Why did the US stock market move on 8 September 2026?
U.S. stocks fell as crude oil moved closer to $100, Treasury yields rose and investors faced renewed inflation and Federal Reserve policy uncertainty. Negative breadth showed that the weakness extended beyond a few large stocks, although semiconductor and AI-infrastructure strength helped the Nasdaq outperform the Dow. Amgen’s 10% decline also intensified pressure on Health Care and the price-weighted Dow.
Which sectors performed best and worst in the US stock market on 8 September 2026?
Energy was the best-performing S&P 500 sector, up 1.0%, as higher crude prices improved near-term earnings sensitivity for oil and gas companies. Health Care was the weakest major group, down roughly 2.5%, with XLV off 2.52%, as Amgen’s sharp fall triggered broader biotechnology and clinical-risk de-rating. The rotation was therefore driven more by commodity and company-specific catalysts than by a clean cyclical-versus-defensive factor trade.
What should investors watch after the US stock market close on 8 September 2026?
The next major catalysts are the August Producer Price Index on September 10 and Consumer Price Index on September 11. Investors should also monitor whether the 10-year Treasury yield can stabilize near 4.80%, whether VIX remains contained, whether negative breadth persists, and whether oil stays near levels that could reinforce inflation concerns. In equities, the durability of semiconductor leadership versus software weakness will be an important test of whether AI-linked capital is rotating within technology rather than leaving the sector altogether.
Disclaimer: This article is intended solely for the exchange of investment ideas and does not constitute investment advice of any kind.