

Key Takeaways
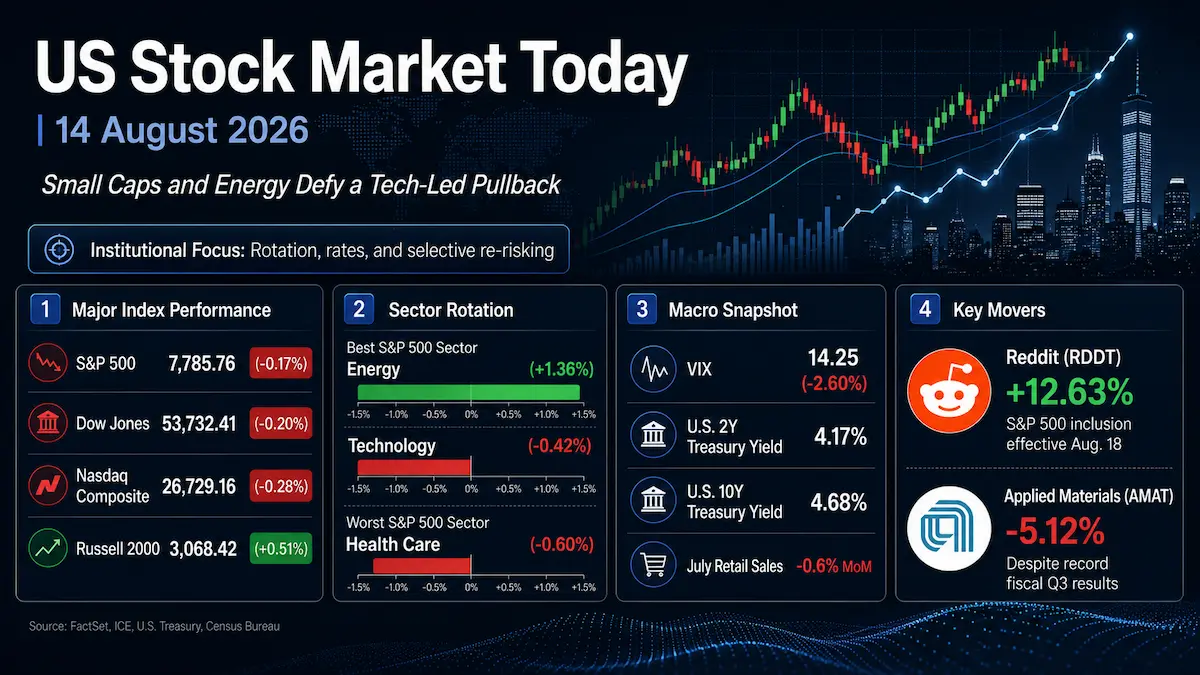
- The S&P 500 fell 0.17% to 7,785.76, the Dow slipped 0.20% to 53,732.41 and the Nasdaq Composite lost 0.28% to 26,729.16, while the Russell 2000 rose 0.51% to 3,068.42. The divergence points to rotation beneath a modestly weaker headline market rather than broad risk liquidation.
- Energy led the S&P 500 sectors with a 1.36% gain as oil strengthened amid elevated Middle East supply risk, while Health Care was the weakest sector at -0.60%. Technology fell 0.42%, reinforcing the session’s shift away from some large-cap growth exposure.
- July U.S. retail and food-services sales fell 0.6% month over month to $763.6 billion, while preliminary August consumer sentiment dropped to 51.0 from 55.2 in July. Even so, Treasury yields rose: the official U.S. Treasury par curve showed the 2-year at 4.17% and the 10-year at 4.68%.
1. Market Capital Flows and Sector Rotation
Friday’s tape was more constructive underneath the surface than the cap-weighted indexes suggested. Energy rose 1.36%, the best S&P 500 sector, while Health Care fell 0.60%, the weakest. Information Technology declined 0.42%. Seven of the 11 S&P 500 sectors nevertheless finished higher, and the Russell 2000 gained 0.51% even as the S&P 500 and Nasdaq fell. Large caps therefore lagged small caps, and the growth-heavy Nasdaq underperformed the broader market. Value-oriented exposure was relatively more resilient, but the rotation was not a clean value-versus-growth trade: energy, materials and industrials were firm, while consumer discretionary weakened; utilities and real estate also gained even as Health Care declined. Cyclicals and defensives were both internally mixed.
Market breadth also argued against labeling the session as indiscriminate risk-off. Advancers outnumbered decliners on the New York Stock Exchange, while Nasdaq breadth was slightly negative. Combined with small-cap strength and gains in a majority of S&P sectors, the pattern suggests that weakness was concentrated in selected large-cap and technology exposures rather than spread evenly across the market.
Institutional Flow Insight: The price action is consistent with selective de-concentration rather than a broad reduction in equity risk budgets. Rising Treasury yields made long-duration growth valuations less forgiving, while stronger oil prices improved the near-term cash-flow backdrop for energy producers. At the same time, gains in utilities and real estate despite higher yields show that rates alone did not explain the tape. With August 14 falling mid-month rather than at a typical month- or quarter-start rebalance point, calendar rebalancing is a less compelling explanation than relative valuation, earnings visibility, commodity sensitivity and position crowding. This is an inference from cross-asset and sector behavior, not confirmed institutional flow data.
2. Decoding the Biggest Market Movers
Reddit (RDDT)
Reddit surged 12.63% in the regular session to close at $178.09 after S&P Dow Jones Indices announced that the company will join the S&P 500 before the market opens on Tuesday, August 18, replacing AvalonBay Communities. The catalyst is important because index inclusion creates a mechanical rebalancing requirement for passive products and benchmark-aware portfolios. That can increase near-term demand and liquidity, but it should not be confused with an immediate change in Reddit’s underlying earnings power. Because Reddit was not yet an S&P 500 constituent on Friday, its rally did not contribute to the index’s August 14 return. For communication-services and internet peers, the move mainly reinforced the valuation premium investors can assign to index eligibility, liquidity and benchmark relevance.
Applied Materials (AMAT)
Applied Materials fell 5.12% to $507.18 despite reporting record fiscal third-quarter results. The company’s official Investor Relations release showed revenue of $9.115 billion, up 25% year over year; GAAP gross margin of 50.3%; non-GAAP gross margin of 50.4%; GAAP diluted EPS of $3.17; and non-GAAP diluted EPS of $3.50. Non-GAAP operating margin reached 34.0%. For fiscal Q4, Applied guided to revenue of $10.25 billion plus or minus $500 million and non-GAAP EPS of $4.02 plus or minus $0.20. Its official earnings-call published script also put Q4 non-GAAP gross margin at approximately 50.4%.
The selloff is therefore better read as an expectations and valuation event than as evidence of weak reported fundamentals. Applied’s prepared remarks described longer customer visibility, including rolling eight-quarter forecasts, and continued strength in DRAM, leading-edge foundry-logic and advanced packaging. Yet after a powerful 2026 share-price advance, the market’s hurdle rate was unusually high: record results and strong guidance were not enough to prevent profit-taking. The sector implication is important. Technology fell 0.42%, but the broader semiconductor complex was not uniformly weak, so AMAT’s decline looked more like company-specific expectation compression within a still-dispersed AI trade than a wholesale rejection of semiconductor capital spending.
3. Macro Indicators and Market Outlook
The Cboe VIX finished at 14.25, down 0.38 point or 2.60%. That decline in implied volatility was notable because the S&P 500 also fell. The divergence suggests that investors treated Friday’s equity weakness more as rotation and consolidation than as a sudden demand for broad downside protection. A low VIX does not eliminate event risk, particularly with Middle East tensions still affecting oil and shipping, but it does indicate that one-month S&P 500 option pricing did not show a broad volatility shock at the close.
The U.S. Treasury’s official August 14 par yield curve showed the 2-year yield at 4.17%, up 2 basis points from 4.15% on August 13, and the 10-year at 4.68%, up 5 basis points from 4.63%. The 2s10s spread therefore widened to roughly +51 basis points from +48 basis points. The combination of softer retail activity and higher yields sent a mixed macro signal: weaker consumption data can reduce pressure for tighter policy at the front end, while the larger rise in the 10-year was consistent with investors demanding more compensation for longer-horizon inflation, fiscal and term-premium risk. Friday’s move should not be interpreted as a definitive prediction of a Federal Reserve hike or cut.
Oil was directly relevant to equity rotation. Crude prices rose as disruption risk around the Strait of Hormuz and U.S.-Iran tensions remained elevated, helping explain Energy’s 1.36% sector gain while also keeping inflation sensitivity in the rates market alive. That cross-asset combination matters: softer consumption would normally support duration, but an oil-driven inflation risk premium can prevent long yields from falling in tandem.
Upcoming Economic Data & Catalysts:
- Industrial Production and Capacity Utilization (Release date: August 18, 2026): The Federal Reserve’s report will provide a fresh read on manufacturing, utilities and mining output. Markets will focus on whether real-economy production confirms or offsets the softer consumer signal from July retail sales.
- FOMC Minutes for the July 28–29 Meeting (Release date: August 19, 2026): Investors will examine the Committee’s discussion of inflation persistence, growth risks and the threshold for future policy changes. The minutes could affect front-end yields and rate-sensitive equity valuations without guaranteeing the next policy decision.
Market Insights:
The session was not driven by a broad retreat from risk. The S&P 500, Dow and Nasdaq closed modestly lower, but small caps advanced, seven S&P sectors gained, NYSE breadth was positive and the VIX declined. That points to a rotation-led pullback with concentrated pressure in selected large-cap growth exposures. The setup would become less constructive if the 10-year yield extends sharply higher, market breadth deteriorates, earnings revisions turn down, oil-driven inflation pressure intensifies, policy communication surprises the market, or the VIX breaks materially higher from its current low level. Valuation remains an important amplifier: richly priced stocks can sell off even on objectively strong earnings when expectations are already elevated.
Trading & Investment Strategy:
Risk management should take priority over chasing Friday’s winners. Investors can use staged entries rather than full-size purchases after sharp single-day moves, especially in index-addition names such as Reddit where part of the catalyst is mechanical. In technology, distinguish between deteriorating fundamentals and expectation compression before buying weakness; Applied Materials illustrates why a strong earnings print alone does not guarantee a positive price reaction. Sector exposure should be sized around earnings visibility, balance-sheet quality and sensitivity to rates or commodities. Predefined stop-loss or thesis-failure levels can limit damage if volatility expands, while position sizes should remain small enough that a gap move does not impair portfolio-level risk limits.
4. Key FAQs About the US Stock Market Today
Why did the US stock market move on 14 August 2026?
Major indexes slipped as investors absorbed a 0.6% monthly decline in July retail sales, weaker preliminary consumer sentiment, higher Treasury yields and renewed oil-related geopolitical risk. Technology weakness, including Applied Materials’ post-earnings decline, weighed on the cap-weighted indexes, while energy and small caps outperformed. The result was a rotation-driven decline rather than a uniform selloff.
Which sectors performed best and worst in the US stock market on 14 August 2026?
Energy was the best-performing S&P 500 sector, up 1.36%, supported by higher oil prices and supply-risk concerns. Health Care was the weakest, down 0.60%. Technology also lagged, falling 0.42%, while gains in several non-technology sectors helped keep overall market breadth healthier than the headline indexes implied.
What should investors watch after the US stock market close on 14 August 2026?
The next major macro checkpoints are the Federal Reserve’s Industrial Production and Capacity Utilization report on August 18 and the July 28–29 FOMC meeting minutes on August 19. Investors should also monitor whether the 10-year Treasury yield can stabilize near the official August 14 level of 4.68%, whether small-cap and sector breadth remains firm, and whether the VIX stays subdued near 14.25. A reversal in breadth, a renewed yield spike or a volatility breakout would challenge Friday’s relatively benign rotation signal.
Selected Primary Sources
Disclaimer: This article is intended solely for the exchange of investment ideas and does not constitute investment advice of any kind.