

Key Takeaways
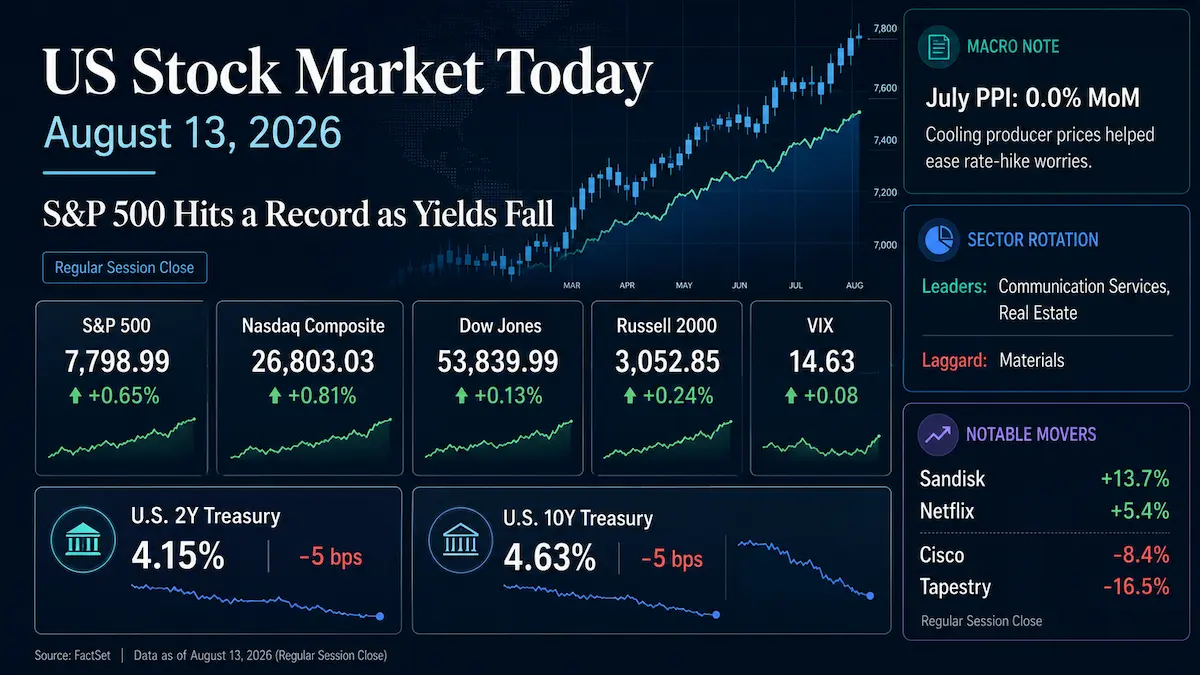
- The S&P 500 rose 0.65% to a record close of 7,798.99, while the Nasdaq Composite gained 0.81% to 26,803.03. The Dow advanced 0.13% to 53,839.99 and the Russell 2000 added 0.24% to 3,052.85.
- July final-demand PPI was unchanged month over month, helping Treasury yields move lower. The U.S. Treasury’s official August 13 constant-maturity marks put the 2-year yield at 4.15% and the 10-year at 4.63%, both 5 basis points below August 12.
- Communication Services led the S&P 500 sectors with a 1.56% gain, followed by Real Estate at 1.34%; Materials was the weakest sector, down 0.74%. The pattern favored duration-sensitive growth and rate-sensitive real estate over traditional cyclicals.
- Market breadth was constructive rather than purely megacap-driven: the S&P 500 Equal Weight Index rose about 0.74%, slightly ahead of the cap-weighted benchmark, while S&P advancers outnumbered decliners by roughly 1.7 to 1. Trading volume, however, remained below its recent 20-day average.
- Cisco fell 8.4% and Tapestry dropped 16.49% in the regular session, underscoring that strong reported results were not enough where forward margin economics or the breadth of growth failed to clear elevated expectations.
1. Market Capital Flows and Sector Rotation
The session was risk-on, but the capital-flow signal was more nuanced than a simple chase into high-beta assets. Communication Services gained 1.56% and Real Estate rose 1.34%, while Information Technology advanced about 0.96%. At the other end, Materials fell 0.74%, Energy slipped 0.09%, and Health Care and Industrials each edged about 0.05% lower. That mix points to a preference for earnings visibility and duration sensitivity rather than a broad reflation trade.
Large caps outperformed small caps, with the S&P 500 up 0.65% versus a 0.24% gain for the Russell 2000. Growth also held the advantage over value as the Nasdaq and growth-heavy Communication Services and Technology sectors led. Traditional cyclicals were softer, while defensives were mixed rather than dominant. Importantly, the S&P 500 Equal Weight Index gained about 0.74%, modestly beating the cap-weighted S&P 500, and advancing S&P 500 issues outnumbered decliners by approximately 1.7 to 1. U.S. exchange volume was about 16.1 billion shares versus a roughly 17.5 billion 20-day average, so participation broadened without the kind of volume surge that would imply indiscriminate risk-taking.
Institutional Flow Insight: A reasonable interpretation is that falling yields encouraged incremental allocation toward long-duration quality growth and rate-sensitive real estate, while investors remained selective on companies where AI or consumer-growth narratives carried margin or execution risk. The equal-weight outperformance argues against describing the rally as solely a handful of megacaps, but lighter-than-average volume suggests the move was better characterized as selective risk expansion than a wholesale increase in portfolio beta. There is no need to invoke month-end or quarter-end rebalancing to explain the tape; the day’s inflation and rate sensitivity provided a more direct mechanism.
2. Decoding the Biggest Market Movers
Cisco Systems (CSCO)
Cisco fell 8.4% in the regular session despite reporting strong fiscal fourth-quarter operating results and issuing higher fiscal 2027 revenue guidance. The company reported Q4 revenue of $17.3 billion, up 18% year over year, and non-GAAP EPS of $1.22, up 23%. Non-GAAP gross margin was 66.3%, down from 68.4% a year earlier, while product gross margin fell to 64.8% from 67.5%. Cisco reported $4.0 billion of hyperscaler AI-infrastructure orders in Q4 and $9.3 billion for fiscal 2026, but the economics of that mix remained central to the market reaction. Management guided Q1 fiscal 2027 revenue to $18.0 billion-$18.2 billion, non-GAAP gross margin to 65%-66%, and non-GAAP EPS to $1.32-$1.34; full-year fiscal 2027 revenue guidance was $72.2 billion-$73.4 billion.
The investment signal was not that AI networking demand had weakened; Cisco’s order data argued the opposite. Rather, the selloff reflected an expectations-versus-economics reset: investors appeared unwilling to reward accelerating hardware and AI exposure at any price when mix and memory costs were pressuring product margins. The fact that the broader Technology sector still rose on the day is important. It suggests the market was differentiating among AI beneficiaries based on margin durability and monetization rather than de-rating the theme indiscriminately. Cisco’s decline also helped explain why the price-weighted Dow materially lagged the Nasdaq and S&P 500.
Tapestry (TPR)
Tapestry closed at $128.39, down 16.49% in the regular session, even though fiscal fourth-quarter results showed strong profitability. Q4 net sales were $1.8766 billion, up 9% reported and 11% on a pro forma constant-currency basis. Non-GAAP EPS rose 28% to $1.32, non-GAAP gross margin expanded 180 basis points to 78.1%, and non-GAAP operating margin expanded 250 basis points to 19.3%. Coach remained the growth engine, with Q4 constant-currency sales up 14%, while Kate Spade fell 7% on the same basis. For fiscal 2027, Tapestry guided revenue to $8.4 billion-$8.5 billion, representing mid-single-digit growth, and non-GAAP EPS to $7.80-$7.90.
The sharp share-price reaction shows how strongly the market is discounting forward growth concentration. Tapestry’s quarter was profitable and margin-accretive, but the outlook did not eliminate concern that Coach is carrying too much of the portfolio while the Kate Spade recovery remains gradual. For the Consumer Discretionary sector, which still finished modestly higher, the move looked company-specific rather than a sector-wide collapse in consumer risk appetite. The broader read-through is that premium consumer names with elevated valuations need both margin resilience and a sufficiently broad growth engine to sustain multiple expansion.
3. Macro Indicators and Market Outlook
The Cboe VIX finished at 14.63. Cboe historical data show that was up 0.08 point, or about 0.55%, from 14.55 on August 12. The small rise in implied volatility alongside a record S&P 500 close was a mild divergence, not a sign of broad stress. At that absolute level, the VIX still reflected relatively contained expected volatility, while the slight increase was consistent with investors retaining some options hedges against event, policy, or geopolitical risk rather than fully removing protection into the rally.
The U.S. Treasury’s official August 13 constant-maturity rates put the 2-year yield at 4.15% and the 10-year at 4.63%, each down 5 basis points from August 12. The 10-year-minus-2-year spread therefore remained near 48 basis points, indicating a broadly parallel bond rally rather than a major one-day curve-shape repricing. The immediate macro catalyst was July PPI: final demand was unchanged month over month, but it was still up 4.7% year over year. More importantly, final demand excluding foods, energy and trade services rose 0.4% month over month and 4.7% year over year. That distinction matters. The headline was friendly to duration assets and reduced near-term pressure on yields, but the underlying inflation signal was not uniformly benign. A single day’s Treasury move should therefore not be treated as confirmation of a specific Federal Reserve rate path.
Oil reinforced the disinflationary direction of the session. U.S. crude fell about 2.4% to $81.25 and Brent declined about 2.1% to $87.07 even as U.S.-Iran tensions and curtailed Strait of Hormuz traffic remained geopolitical risks. Lower oil prices helped reduce the immediate energy-inflation impulse and were consistent with the Energy sector’s slight underperformance, although the geopolitical backdrop leaves that benefit vulnerable to reversal.
Upcoming Economic Data & Catalysts:
- Advance Monthly Sales for Retail and Food Services, July 2026 (Release date: August 14, 2026): The Census Bureau release at 8:30 a.m. ET will be a direct test of household demand. A material surprise could move front-end yields and alter earnings expectations for consumer discretionary, retail and payments companies.
- New Residential Construction, July 2026 (Release date: August 18, 2026): Housing starts and building permits, scheduled for 8:30 a.m. ET, will provide another read on rate-sensitive demand and supply. The data are relevant for Treasury yields, homebuilders, banks and real estate exposures.
Market Insights:
The August 13 advance was broader than a narrow megacap squeeze: equal-weight performance slightly exceeded the cap-weighted S&P 500 and breadth was positive. Still, leadership remained concentrated in rate-sensitive growth areas, with the Nasdaq, Communication Services and Technology outperforming while several cyclical sectors lagged. The most important reversal risks are a renewed jump in Treasury yields, deterioration in breadth, earnings-guidance cuts, a sharp rebound in oil on geopolitical escalation, or a sustained rise in implied volatility. At record index levels, valuation support becomes more dependent on earnings delivery and stable discount rates.
Trading & Investment Strategy:
Risk management should take priority over chasing a record close. Investors can preserve core exposure while adding incrementally rather than all at once, especially in rate-sensitive growth names that have already repriced quickly. Within Technology, favor companies where AI demand is translating into durable margins and cash flow rather than treating every infrastructure beneficiary as equivalent. Real estate can remain sensitive to lower yields, but positions should be sized around the risk of a rate reversal. In Consumer Discretionary, forward guidance and brand-level growth breadth deserve more weight than backward-looking headline beats. Single-stock earnings risk should be kept proportionate to portfolio risk budgets, and stop or exit levels should be tied to thesis invalidation and realized volatility rather than arbitrary leverage-driven targets.
4. Key FAQs About the US Stock Market Today
Why did the US stock market move on August 13, 2026?
U.S. equities rose primarily because July headline PPI was unchanged month over month, easing immediate inflation pressure and pulling Treasury yields lower. That supported duration-sensitive sectors and growth stocks, while strong AI-related demand remained a positive earnings theme. The rally was broad enough to lift the equal-weight S&P 500, although company-specific disappointments such as Cisco and Tapestry still produced severe selloffs.
Which sectors performed best and worst in the US stock market on August 13, 2026?
Communication Services was the best-performing S&P 500 sector, up 1.56%, followed by Real Estate at 1.34%. Materials was the weakest, down 0.74%. The rotation favored growth and rate-sensitive assets as yields fell, while traditional cyclical exposure was comparatively soft.
What should investors watch after the US stock market close on August 13, 2026?
The immediate macro catalyst is the July retail sales report on August 14, followed by July housing starts and permits on August 18. Investors should also watch whether 2-year and 10-year Treasury yields continue to fall, whether market breadth remains supportive near record highs, and whether the VIX’s small divergence from the equity rally develops into a more persistent rise in hedging demand. Company guidance and margin quality remain critical stock-selection filters.
Selected Primary Sources
- Cisco Q4 and FY2026 results
- Tapestry Q4 and FY2026 results
- BLS July 2026 Producer Price Index release
Disclaimer: This article is intended solely for the exchange of investment ideas and does not constitute investment advice of any kind.