

Key Takeaways
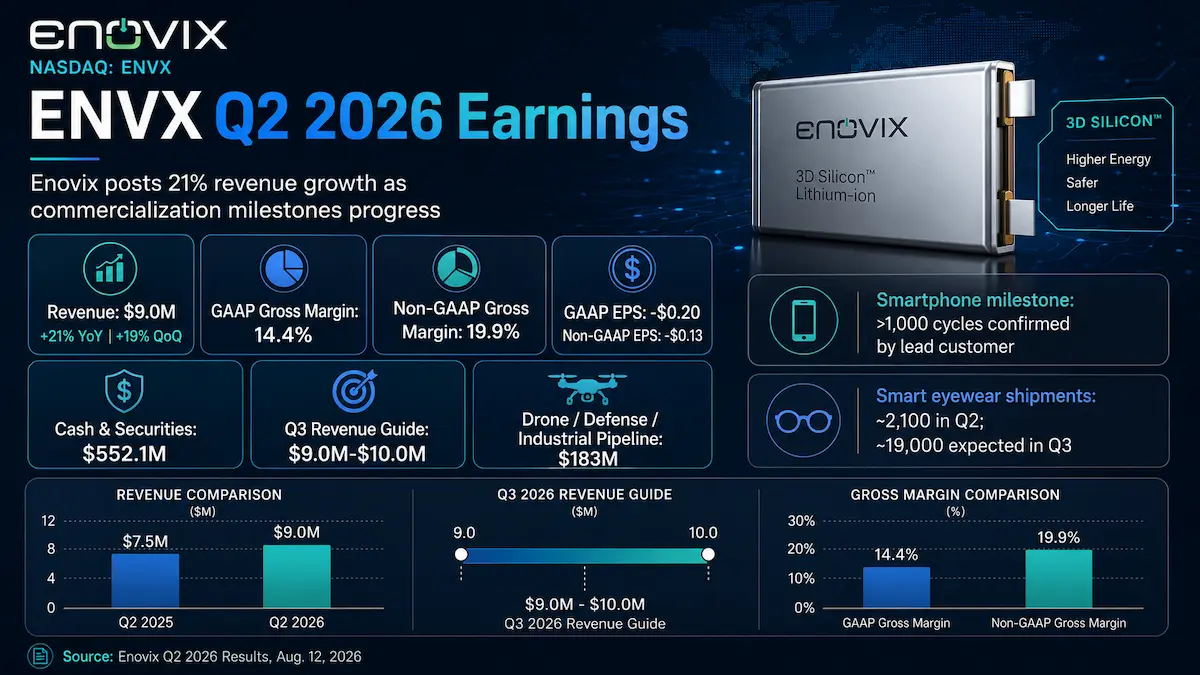
- Enovix reported Q2 2026 revenue of $9.024 million, up about 21% year over year and 19% sequentially, while non-GAAP EPS of -$0.13 beat the widely cited -$0.15 analyst consensus.
- The headline beat was overshadowed by Q3 revenue guidance of $9.0 million to $10.0 million. The $9.5 million midpoint is about 7.8% below the $10.3 million public consensus cited immediately after the release.
- The lead smartphone program moved materially closer to qualification after the customer confirmed more than 1,000 cycles under the 0.2C discharge test, but one final accelerated cycle-life test still stands between Enovix and system-level field testing.
- Smart eyewear is now commercial, with approximately 2,100 packs shipped in Q2 and about 19,000 expected in Q3, but management said the business should carry negative gross margin through the balance of 2026 as volume remains below efficient scale.
- The drone, defense and industrial pipeline reached approximately $183 million, yet only about $5 million was classified as design wins. The gap between pipeline size and mature wins remains one of the most important variables in the ENVX valuation.
1. Core Earnings Breakdown
Revenue and Profitability Analysis
Enovix reported Q2 2026 revenue of $9.024 million, versus approximately $7.5 million a year earlier, representing about 21% year-over-year growth. Revenue also increased 19% sequentially from Q1 2026 and landed at the high end of the company’s prior $8.0 million to $9.0 million guidance range. First-half 2026 revenue reached $16.6 million, up 32% year over year, marking continued commercial progress from a still-small revenue base.
Profitability was more mixed. GAAP gross profit was $1.3 million and GAAP gross margin was 14.4%, down 11.6 percentage points year over year. Non-GAAP gross profit was $1.8 million and non-GAAP gross margin was 19.9%, down 10.9 percentage points. Management attributed the quarterly compression primarily to the mix of battery products sold through the South Korea operation rather than a broad deterioration in manufacturing execution. On a first-half basis, non-GAAP gross margin was 22.8%, up from 21.3% in the first half of 2025, which supports management’s argument that one quarter should not automatically be extrapolated into a new structural margin trend.
GAAP operating expenses were $44.6 million and GAAP operating loss was $43.3 million. Non-GAAP operating expenses were $30.6 million and non-GAAP operating loss was $28.8 million. Adjusted EBITDA was -$18.9 million. GAAP EPS was -$0.20 and non-GAAP EPS was -$0.13. Free cash flow was an outflow of $31.4 million in Q2, compared with an outflow of $33.8 million a year earlier.
Enovix does not disclose Q2 revenue by smartphone, smart eyewear, drone, defense and industrial end market as separate audited revenue segments. Therefore, assigning precise revenue percentages to those categories would be unsupported. The most defensible business mix assessment is qualitative and based on the company’s own disclosures:
- Defense and industrial / South Korea operations: Management said defense shipments from South Korea were the largest revenue contributor and that Q2 growth was primarily supported by defense. Investment view: this legacy and acquired production base is currently doing the financial heavy lifting while the higher-profile consumer silicon-anode programs remain early in commercialization.
- Smart eyewear: Enovix recognized initial product revenue after shipping approximately 2,100 AI-1 battery packs. Management characterized the revenue contribution as modest. Investment view: the economic value today is not the Q2 revenue amount; it is the proof that a 100% silicon-anode product has moved through certification, customer reliability testing and commercial shipment.
- Smartphones: No material smartphone product revenue was disclosed for Q2 because the lead program remains in qualification. Investment view: smartphone remains the largest potential valuation catalyst, but investors should treat it as a probability-weighted future revenue opportunity rather than current operating revenue.
- Drones: The opportunity is visible mainly in the pipeline rather than current disclosed segment revenue. Drone opportunities exceeded $100 million and represented the largest source of pipeline growth. Investment view: the addressable demand signal is strong, but the investment case depends on conversion into design wins and on South Korea capacity becoming available on schedule.
Expectations vs. Actual Results
- Revenue: $9.024 million actual versus approximately $8.43 million analyst consensus. Result: ✅ Beat by about $0.594 million, or roughly 7.0%.
- Non-GAAP EPS: -$0.13 actual versus approximately -$0.15 consensus. Result: ✅ Beat by $0.02 per share.
- GAAP EPS: -$0.20. A directly comparable public GAAP EPS consensus was not consistently available in the sources reviewed, so a GAAP beat/miss label would be misleading.
- Non-GAAP operating margin: approximately -318.7%, calculated as -$28.759 million non-GAAP operating loss divided by $9.024 million revenue. A reliable public Street operating-margin consensus was not available. Using the company’s prior Q2 guidance only as a benchmark, the $29 million to $32 million non-GAAP operating-loss range against $8 million to $9 million revenue implied an arithmetic operating-margin range of roughly -322% to -400%. Result: ✅ Actual operating loss was slightly better than the favorable end of company guidance, but absolute operating leverage remains deeply negative.
- Gross margin: 14.4% GAAP and 19.9% non-GAAP. The year-over-year decline was material even though management attributed it mainly to product mix.
The beat came from two places rather than from a sudden inflection in the highest-value smartphone program. First, defense shipments from South Korea continued to support revenue. Second, operating loss came in slightly better than company guidance, allowing non-GAAP EPS to land at the favorable end of management’s range and above the public analyst consensus. Smart eyewear contributed its first revenue, but management described the amount as modest, so it was not the principal source of the quarterly financial beat.
For Q3 2026, Enovix guided to revenue of $9.0 million to $10.0 million, non-GAAP operating loss of $29.0 million to $32.0 million, non-GAAP EPS of -$0.13 to -$0.17 and capital expenditures of $8.0 million to $12.0 million. The EPS range brackets the approximately -$0.15 public consensus, but the $9.5 million revenue midpoint is about 7.8% below the $10.3 million public consensus cited after the release. That revenue gap matters because Q3 is supposed to include roughly a ninefold sequential increase in smart-eyewear pack shipments.
In other words, the market is likely to place more weight on guidance, smartphone qualification, gross-margin progression, manufacturing yield and pipeline conversion than on a two-cent quarterly EPS beat. ENVX is still in a commercialization phase where one design qualification, one manufacturing bottleneck or one delayed capacity addition can alter the forward revenue curve more than a small quarterly variance in reported EPS.
The initial stock reaction reflected that hierarchy of concerns. ENVX fell 3.4% in after-hours trading to $4.57 on August 12 after closing the regular session at $4.75, and the shares closed at $4.39 on August 14, 2026. The post-earnings weakness was therefore not well explained by a generic “sell the news” narrative. The more fundamental explanation is that Q3 revenue guidance came in below the cited consensus while management simultaneously warned that smart-eyewear gross margin should remain negative for the rest of 2026. The lead smartphone customer still has one qualification test remaining, and the larger drone revenue opportunity is tied to pipeline conversion and additional South Korea capacity expected around mid-2027.
There was no newly announced Q2 acquisition that would explain the immediate price reaction through merger dilution. However, dilution remains relevant to the longer-term per-share framework: Q2 weighted-average shares were 218.5 million versus 204.8 million a year earlier, an increase of approximately 6.7%. Convertible debt also remains a potential future dilution or refinancing consideration. The immediate post-print reaction, however, appears more closely linked to guidance, near-term margin pressure and commercialization timing than to a new financing event.
Earnings Call Highlights
“The lead smartphone customer independently confirmed more than 1,000 cycles under the 0.2C discharge test; one final accelerated cycle-life test remains before the next qualification stage.”
💡 Reading Between the Lines: The smartphone thesis has shifted from proving basic cell capability toward clearing a customer-specific qualification gate. That is meaningful de-risking, but it is not the same as a production award; valuation models should still probability-weight 2027 smartphone revenue until the final test, customer acceptance and field testing are completed.
“Smart-eyewear shipments are expected to rise from roughly 2,100 packs in Q2 to about 19,000 in Q3, while management is prioritizing market incumbency over near-term gross margin.”
💡 Reading Between the Lines: Management is deliberately optimizing for becoming a default battery supplier in an emerging device category rather than maximizing early unit economics. That can be rational if customer pull-through scales rapidly, but the strategy transfers near-term execution risk to volume adoption because management expects smart-eyewear gross margin to remain negative through the rest of 2026.
“The drone, defense and industrial pipeline reached approximately $183 million, with more than $40 million already in active testing and design-win stages; added Korea capacity is targeted for mid-2027.”
💡 Reading Between the Lines: The pipeline is large enough to become a second major valuation pillar, but investors should not capitalize the full $183 million as backlog. Revenue conversion depends on qualification cycles, customer awards and a capacity build that management says should support roughly one million drone-battery units annually when the new equipment is online.
“Fab2 Zone 1 dicing yield improved to approximately 84% from roughly 80% in Q1, but Zone 1 remains the primary throughput bottleneck.”
💡 Reading Between the Lines: This may be more important to intrinsic value than a few hundred thousand dollars of quarterly revenue variance. The hybrid laser-and-mechanical dicing approach must translate the yield gain into higher throughput and lower unit cost; otherwise smartphone and eyewear demand could arrive before Enovix has an economically efficient production process.
2. Deep Business Insights
Hidden Metrics That Matter
Hidden metric #1 is pipeline maturity, not headline pipeline size. Enovix’s earnings deck showed approximately $119 million of prospects, $23 million of new-design opportunities, $36 million in technical validation and $5 million of design wins, totaling approximately $183 million. The more advanced technical-validation-plus-design-win pool therefore equals ($36 million + $5 million) / $183 million = approximately 22.4%, calculated from company-reported figures. Formal design wins alone equal $5 million / $183 million = approximately 2.7%, calculated from company-reported figures.
This distinction matters because a $183 million “pipeline” can sound similar to contracted demand even though the company explicitly defines the figure as its estimate of peak annual production value for identified opportunities, not backlog. The bullish interpretation is that more than $40 million is already in active evaluation or design stages and drone qualification cycles can be shorter than smartphones. The cautious interpretation is that nearly four-fifths of the pipeline is still earlier than technical validation or design win, leaving substantial conversion risk.
Hidden metric #2 is the combination of manufacturing yield and commercial shipment velocity. Zone 1 dicing step yield improved from approximately 80% in Q1 to approximately 84% in Q2, a 4-percentage-point sequential gain, while almost every process step outside Zone 1 was at or above 95%, with some as high as 99.6%. At the same time, smart-eyewear shipments are expected to increase from approximately 2,100 packs in Q2 to approximately 19,000 in Q3, or about 19,000 / 2,100 = 9.0x sequentially, calculated from company-reported shipment figures.
Those two metrics need to be analyzed together. A ninefold shipment ramp is strategically valuable only if yield, cycle time and overhead absorption improve fast enough to prevent each incremental unit from extending negative gross margin. The next proof point is therefore not simply “did Enovix ship 19,000 packs?” but “did it ship them with evidence that the bottleneck and cost curve are moving in the right direction?”
Customers have a credible reason to evaluate Enovix because its architecture addresses a problem that is unusually important in compact AI devices: usable energy inside a fixed physical volume. The company’s AI-1 platform is positioned around high volumetric energy density, while management said smart-eyewear customers are seeing longer battery life from the energy density available in a small form factor, especially with AI workloads running on the glasses. In smartphones, Enovix is targeting premium or leadership devices where battery capacity, thickness and thermal constraints have more economic value than in low-end handsets.
The drone proposition is different but equally specific. The MX platform emphasizes gravimetric energy density and high-power performance, while Enovix’s South Korea site has an established battery-production history and is located in a TAA-compliant country. Management is also pursuing an NDAA-compliant path across multiple SKUs. For defense and drone customers, that combination of energy per unit weight, power, safety, domestic-allied sourcing requirements and available production infrastructure can matter more than simply buying the lowest-cost commodity cell.
Industry Chain Reactions
- ✅ Potential benefit — Meta Platforms (NASDAQ: META): This is a category-level read-through, not a disclosed Enovix customer relationship. Meta continues to expand AI-glasses products where battery life is a visible product constraint. If suppliers such as Enovix can deliver higher energy density in a small form factor at commercial scale, AI-glasses platform companies could gain more freedom to add on-device AI features, cameras, displays and longer usage time without materially enlarging the frame or battery compartment.
- ❌ Potential pressure — Amprius Technologies (NYSE: AMPX): Amprius is already generating materially higher revenue from silicon-anode batteries and has meaningful drone exposure. Enovix’s expanding drone pipeline, TAA positioning, planned NDAA path and additional South Korea capacity create another high-energy battery option for drone and defense customers. The pressure is incremental rather than immediate: Amprius entered Q2 2026 with stronger commercial scale, while Enovix still needs to convert most of its pipeline into design wins and production revenue.
Valuation Framework and Key Risks
ENVX closed at $4.39 on August 14, 2026, with a market capitalization of roughly $0.96 billion based on the latest market data reviewed. At that price, the equity is not being valued on current earnings because Enovix remains loss-making; it is being valued on the probability and eventual economics of three commercialization paths: smartphone qualification, smart-eyewear scale and drone/defense conversion.
A simple trailing-revenue multiple illustrates how much future success is already required. Using company-reported quarterly revenue of $7.990 million in Q3 2025, $11.265 million in Q4 2025, $7.600 million in Q1 2026 and $9.024 million in Q2 2026, trailing-12-month revenue is approximately $35.879 million, calculated from company-reported figures. A roughly $959 million market capitalization therefore equals about 26.7x trailing revenue before adjusting for cash and debt. That is an intentionally crude metric for an early commercialization company, but it highlights that investors are paying for future scale, not the present revenue base.
Liquidity is a meaningful cushion but should not be treated as evidence that execution risk has disappeared. Enovix ended Q2 with approximately $552.1 million in cash, cash equivalents and marketable securities, including restricted cash. First-half free cash flow was -$67.7 million. Annualizing that first-half burn purely as a sensitivity gives approximately $135.4 million, and $552.1 million / $135.4 million = roughly 4.1 years of gross liquidity coverage, calculated from company-reported figures. This is not a company forecast or a true runway calculation: it ignores changes in working capital, future capital requirements, restricted cash, debt service, potential revenue scaling and any financing activity.
The central valuation question is therefore whether 2027 can become the year when technical milestones turn into a steeper revenue curve faster than the cost base expands. If the lead smartphone program clears final qualification, a second OEM begins progressing on a similar framework, smart-eyewear volumes scale toward meaningful overhead absorption and Korea converts a larger share of the $183 million pipeline, today’s revenue multiple can compress rapidly through denominator growth. If those events slip, the same valuation can remain demanding even after the stock’s large decline from prior highs.
Key risks include smartphone qualification delay or failure; customer concentration in early commercial programs; slower-than-expected downstream adoption of smart eyewear; persistent negative gross margin during the eyewear ramp; inability to lift Zone 1 throughput and yields fast enough for 2027 production; drone and defense pipeline failing to convert into firm awards; South Korea capacity delays; competition from other advanced battery suppliers; continued free-cash-flow burn; and per-share dilution from equity issuance, stock compensation or convertible securities.
The most constructive variant of the thesis is that Enovix is simultaneously reducing technology risk in smartphones, proving commercial manufacturability in smart eyewear and opening a faster-cycle defense/drone market that can diversify the revenue base. The most important counterargument is that all three opportunities still require additional execution before they can support the valuation with recurring, high-margin cash flows. Q2 2026 improved the probability of success, but it did not eliminate that gap.
3. Key FAQs
Did ENVX beat Q2 2026 earnings expectations?
Yes. Enovix reported Q2 2026 revenue of $9.024 million versus approximately $8.43 million consensus and non-GAAP EPS of -$0.13 versus approximately -$0.15 consensus. Revenue therefore beat by roughly $0.594 million, or about 7.0%, while adjusted EPS beat by $0.02. The more important issue for investors was that Q3 revenue guidance of $9.0 million to $10.0 million came in below the approximately $10.3 million public consensus.
Why did ENVX stock fall after Q2 2026 earnings despite a revenue and EPS beat?
The decline was more consistent with a forward-expectations reset than with a simple “sell the news” event. Q3 revenue guidance was below the cited consensus, management expects smart-eyewear gross margin to remain negative for the rest of 2026, smartphone qualification still has one final accelerated cycle-life test, and the largest drone opportunities require both pipeline conversion and new Korea capacity. Those issues affect the timing and quality of future revenue more than the modest Q2 beat.
What is the biggest catalyst for ENVX stock after Q2 2026 earnings?
The highest-impact catalyst remains successful completion of the lead smartphone customer’s final accelerated cycle-life qualification test, which Enovix expects in Q4 2026, followed by customer acceptance and system-level field testing. Secondary catalysts include execution of the roughly 19,000-pack Q3 smart-eyewear shipment plan, further Zone 1 dicing improvements, sample deliveries to a second smartphone OEM and conversion of the $183 million drone/defense/industrial pipeline into larger design wins ahead of the planned mid-2027 Korea capacity expansion.
Source methodology: Enovix’s official Investor Relations website provides the Q2 2026 press release, earnings deck, financial supplement and official earnings-call webcast. As of August 15, 2026, the IR event page does not provide a standalone text transcript. Management statements above were cross-checked against the official company materials wherever the same facts were disclosed and against a public text transcript for call-only commentary; the third-party transcript is not presented as an official Enovix document.
Primary source: Enovix Q2 2026 official earnings release, with supporting materials on the Enovix Quarterly Results page and the official Q2 2026 earnings-call event page. Call-only language was cross-checked with this public Q2 2026 transcript, which is a secondary source rather than an Enovix IR transcript.
Disclaimer: This article/chart is for educational and informational purposes only and does not constitute investment advice of any kind. Past performance is not indicative of future results. Investors should independently evaluate their own risks.