

Key Takeaways
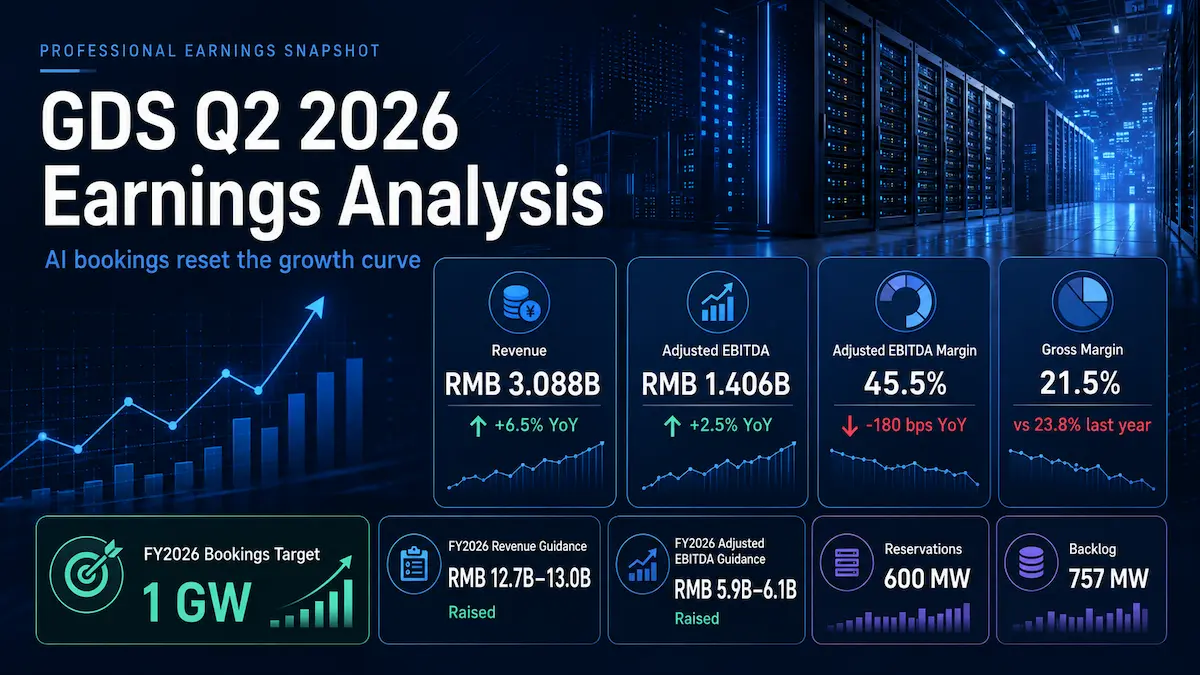
- GDS reported Q2 2026 net revenue of RMB3.088 billion, up 6.5% year over year, while adjusted EBITDA rose only 2.5% to RMB1.406 billion and adjusted EBITDA margin fell 180 basis points to 45.5% as utility costs consumed a larger share of revenue.
- The quarter’s most important development was not the income statement: management raised its full-year 2026 bookings target to 1 GW after approximately 470 MW of first-half bookings and disclosed 600 MW of customer reservations, materially extending forward demand visibility.
- GDS raised FY2026 revenue guidance to RMB12.7-13.0 billion and adjusted EBITDA guidance to RMB5.9-6.1 billion, while increasing capex guidance to about RMB10.0 billion. The company did not issue separate Q3 2026 revenue or earnings guidance.
- GAAP net income of RMB837.6 million and diluted ADS EPS of US$0.52 were heavily influenced by RMB959.9 million of income from equity-method investees, mainly a DayOne dilution gain. Investors should therefore avoid treating headline EPS as a clean measure of recurring China data-center profitability.
- GDS ADRs rose 6.2% on the August 13 earnings day to US$34.77, then slipped 1.0% to US$34.41 on August 14, still about 5.1% above the August 12 pre-report close. The reaction suggests investors placed more weight on bookings, backlog conversion and higher guidance than on the Q2 margin shortfall.
1. Core Earnings Breakdown
Revenue and Profitability Analysis
GDS Holdings reported Q2 2026 total net revenue of RMB3,087.95 million, or US$455.11 million, up 6.5% from RMB2,900.29 million a year earlier. Management attributed the year-over-year increase mainly to the continued ramp-up of data centers. The top line therefore remained healthy, but the quarter exposed an important gap between demand growth and near-term earnings conversion.
GDS does not report multiple operating segments for the quarter in a way that supports a fabricated hyperscale-versus-AI revenue split. The cleanest company-reported revenue mix is the service-versus-equipment line-item disclosure:
- Service revenue was RMB3,086.67 million versus RMB2,898.40 million a year ago, implying approximately 6.5% year-over-year growth. It represented 99.96% of Q2 net revenue, calculated as RMB3,086.67 million ÷ RMB3,087.95 million; calculated from company-reported figures. Investment view: the economics remain overwhelmingly tied to recurring data-center services rather than hardware resale, which makes committed capacity, move-in timing, utilization and pricing far more important than product mix.
- Equipment sales were RMB1.28 million versus RMB1.89 million a year ago, a decline of approximately 32.1%, and represented only about 0.04% of revenue, calculated as RMB1.28 million ÷ RMB3,087.95 million; calculated from company-reported figures. Investment view: this line is immaterial to the equity story and should not drive a valuation conclusion.
Profitability was more mixed. Gross profit fell 3.6% year over year to RMB664.2 million even as revenue grew, and gross margin declined to 21.5% from 23.8%. Adjusted gross profit slipped 0.7% to RMB1,498.9 million, with adjusted gross margin falling to 48.5% from 52.0%. GDS explicitly attributed the deterioration mainly to utility costs rising as a percentage of net revenue.
Adjusted EBITDA increased 2.5% to RMB1,406.0 million, but adjusted EBITDA margin contracted to 45.5% from 47.3%. GAAP income from operations was RMB439.17 million, producing a 14.22% operating margin, calculated as RMB439.17 million ÷ RMB3,087.95 million; calculated from company-reported figures. The interesting offset is that operating expenses were tightly controlled: general and administrative expense fell to RMB185.8 million from RMB231.5 million. In other words, corporate cost discipline helped absorb part of the utility-cost pressure, but it could not prevent compression in the more economically relevant adjusted gross and EBITDA margins.
GAAP net income swung to RMB837.6 million from a RMB70.6 million loss a year earlier, and net income margin reached 27.1%. That headline improvement should be normalized. Share of results of equity-method investees contributed RMB959.9 million of income, mainly from a dilution gain on GDS’s investment in DayOne following DayOne’s Series C convertible preferred share issuance. DayOne is an equity-method investment, not a consolidated Q2 revenue segment. Investment view: the accounting gain strengthens reported earnings but does not represent recurring operating profitability from GDS’s core China data-center platform.
Expectations vs. Actual Results
Consensus comparisons require unusual care this quarter because public data vendors used inconsistent currency and EPS definitions. Rather than force a false apples-to-apples comparison, the following separates verified company results from the most clearly identifiable public consensus references.
- Revenue: actual RMB3.088 billion versus a FactSet estimate of approximately RMB3.09 billion cited around the release. Result: ≈ In line, with the difference within rounding. A separate Zacks feed expressed consensus in U.S. dollars at roughly US$463.2 million, which would imply a modest miss versus the company’s US$455.1 million translation. The discrepancy is a reminder that vendor timing and FX conventions matter for ADR consensus data.
- EPS: official GAAP diluted income was US$0.07 per ordinary share and US$0.52 per ADS. Result: ⚠️ No clean GAAP beat/miss label is assigned here because public feeds mix ordinary-share, ADS and vendor-adjusted EPS conventions. Zacks reported a standardized quarterly earnings figure of US$0.56 versus a US$1.35 consensus, but that vendor-defined figure is not identical to GDS’s company-reported GAAP diluted ADS EPS and should not be presented as if it were.
- GAAP operating margin: actual 14.22%, calculated as RMB439.17 million of operating income ÷ RMB3,087.95 million of revenue; calculated from company-reported figures. Result: ⚠️ No verified public pre-release operating-margin consensus was located, so assigning a beat or miss would require inventing a benchmark.
- Adjusted EBITDA: actual RMB1.406 billion versus approximately RMB1.49 billion of S&P Global Visible Alpha consensus reported after the release. Result: ❌ Miss by about 5.6%, calculated as RMB1.406 billion ÷ RMB1.49 billion − 1; calculated from the reported consensus and company-reported actual figure.
The real source of the operating miss was not weak demand. Revenue continued to expand as data centers ramped, while committed capacity, utilized area and new bookings all increased. The pressure came from cost conversion: higher utility costs reduced gross margin and adjusted EBITDA margin. At the same time, GAAP EPS looked much stronger than the operating picture because DayOne-related equity-method income lifted the bottom line. That combination makes adjusted EBITDA, margins and forward capacity monetization more informative than GAAP EPS for this quarter.
The market also had a clear forward-looking signal. GDS revised FY2026 revenue guidance upward to RMB12.7-13.0 billion from RMB12.4-12.9 billion, implying 11.1%-13.7% year-over-year growth. It raised adjusted EBITDA guidance to RMB5.9-6.1 billion from RMB5.75-6.0 billion, implying 9.2%-12.9% growth. Capex guidance increased to approximately RMB10.0 billion from approximately RMB9.0 billion because stronger sales and the sales outlook require more development activity. The revised full-year guidance includes one-time items disclosed in Q1 2026: RMB429 million of revenue and RMB518 million of adjusted EBITDA.
There was no standalone Q3 2026 revenue, EPS or margin guidance. Investors should not manufacture a next-quarter target from the annual range. The useful forward anchors are management’s FY2026 guidance, its 1 GW bookings target, the disclosed move-in schedule and the expected acceleration in 2027.
What mattered most to the market was therefore pipeline quality rather than the superficial scorecard. GDS ADRs closed at US$34.77 on August 13, up 6.2% on the earnings day from the US$32.74 August 12 close. The stock then eased 1.0% to US$34.41 on August 14 but remained approximately 5.1% above the pre-report close, calculated as US$34.41 ÷ US$32.74 − 1; calculated from market closing prices. This is not a classic “sell the news” setup. The initial rerating suggests the market rewarded the jump in bookings visibility, backlog, the higher annual outlook and management’s 2027 move-in trajectory even though Q2 adjusted EBITDA fell short of one widely cited consensus and margins compressed.
Earnings Call Highlights
- “AI is transforming our business.”
💡 Reading Between the Lines: Management is signaling that AI is no longer a distant optionality case for GDS; it is already changing order volume, campus planning and capital deployment. The valuation debate should increasingly center on whether AI-driven bookings convert into billable capacity at acceptable returns, not simply on whether AI demand exists. - “Strategic point — accurate paraphrase: GDS raised its FY2026 bookings target to 1 GW after roughly 470 MW of first-half bookings and 600 MW of reservations.”
💡 Reading Between the Lines: This is the strongest forward-demand signal in the quarter. Bookings are contractual take-or-pay commitments, while reservations give customers future site capacity within the same sales framework; together they improve GDS’s ability to build against visible demand rather than speculative capacity. - “Strategic point — accurate paraphrase: backlog increased from 450 MW at the start of 2026 to 757 MW at mid-year, with management estimating roughly RMB2.2 million of adjusted EBITDA per MW from that backlog.”
💡 Reading Between the Lines: The earnings story is becoming a timing story. The contractual backlog has already been sold, but its financial contribution depends on delivery and customer ramp schedules, which shifts the key modeling question from order capture to the pace at which booked megawatts become billable. - “Strategic point — accurate paraphrase: 2027 move-in is expected to exceed twice the 2026 level and to be heavily weighted toward the second half of 2027.”
💡 Reading Between the Lines: Management is effectively pointing to a back-end-loaded earnings inflection. That creates upside if execution is smooth, but it also increases duration risk: construction, power, customer deployment or hardware delays can push a meaningful portion of the anticipated growth into later periods. - “Strategic point — accurate paraphrase: GDS plans to finance new projects at roughly 60% debt and 40% equity, targeting 10%-11% stabilized cash yields while capex rises to about RMB10 billion.”
💡 Reading Between the Lines: Management is trying to preserve equity returns while scaling quickly, but higher growth is capital intensive. The investment case therefore depends not only on demand but also on funding cost, asset monetization, leverage discipline and the ability to keep project economics above the cost of capital.
2. Deep Business Insights
Hidden Metrics That Matter
First, the backlog has a measurable embedded earnings value that is easy to miss when focusing on Q2 margins. Management reported 757 MW of backlog and estimated average adjusted EBITDA of RMB2.2 million per MW from that backlog. A simple multiplication gives approximately RMB1.665 billion of booked-but-not-billed adjusted EBITDA: 757 MW × RMB2.2 million per MW = RMB1,665.4 million; calculated from company-reported figures. Management rounded this to “around RMB1.6 billion.” This does not mean RMB1.665 billion will appear immediately or in a single year; it quantifies the earnings capacity attached to contracted but not yet fully billed load. The distinction is critical because it creates forward visibility while leaving timing risk intact.
Second, customer concentration is both a moat signal and a risk factor. GDS’s Q2 presentation showed the five largest customers by net revenue at 34.9%, 8.8%, 8.6%, 6.8% and 4.9%. Adding those figures gives 64.0% of Q2 net revenue: 34.9% + 8.8% + 8.6% + 6.8% + 4.9% = 64.0%; calculated from company-reported figures. The largest revenue customer alone accounted for 34.9%. Concentration gives GDS unusually deep exposure to hyperscale demand and can support large multi-campus wins, but it also means customer capex cycles, negotiation leverage and contract repricing have an outsized impact on revenue quality.
Why do customers choose GDS despite that concentration risk? The company combines several scarce capabilities: strategically located facilities across key Chinese demand hubs, high power capacity and density, multiple layers of redundancy, carrier- and cloud-neutral connectivity, access to major telecom networks and public clouds, and a 26-year service-delivery record. The call added another increasingly valuable dimension: access to developable power and land in a regulatory environment where approvals are selective. Management said GDS had roughly 3 GW of developable capacity not yet committed or reserved at mid-year, mostly in new markets, while established-market capacity was largely reserved. For hyperscalers and AI customers, the scarce product is not just a building; it is deliverable megawatts, approved power, execution certainty and financing capacity on a required timetable.
The contractual architecture strengthens that proposition. Management described bookings as binding take-or-pay commitments with specified delivery dates, while reservations secure future capacity for customers at the same site. This lets large customers plan multi-stage infrastructure deployments and lets GDS allocate capex against a clearer demand signal. The competitive advantage is strongest when power availability is constrained and customers value certainty more than marginal price differences.
Industry Chain Reactions
- ✅ Benefit — Vertiv Holdings (NYSE: VRT): GDS’s higher capex plan, rapidly expanding AI-related bookings and emphasis on high-density compute are a constructive read-through for the broader data-center power and thermal-management ecosystem. More megawatts of high-density capacity generally require more sophisticated electrical, cooling and infrastructure equipment. This is an industry-chain inference only; GDS did not disclose a direct VRT supplier relationship in the Q2 materials reviewed here.
- ❌ Face Pressure — VNET Group (NASDAQ: VNET): GDS’s 1 GW bookings ambition, deep hyperscaler relationships, large reservation pipeline and access to developable capacity could intensify competition for major Chinese cloud and AI contracts, as well as scarce power and project approvals. VNET can still benefit from the same structural AI demand tailwind, so the pressure is relative competitive intensity rather than a claim that sector demand is weakening.
Valuation Framework and Key Risks
GDS closed at US$34.41 on August 14, 2026. At that price, the market is no longer valuing the company solely on current-quarter earnings. The stock’s positive net reaction to Q2 indicates that investors are paying for contracted demand, future move-ins and a potential 2027-2028 growth acceleration.
An illustrative enterprise-value framework helps clarify what is embedded. MarketScreener showed GDS enterprise value at approximately US$11.53 billion around the post-earnings period. The midpoint of company-reported FY2026 adjusted EBITDA guidance is RMB6.0 billion. Converting that midpoint at the RMB6.7851 per US$1.00 exchange rate used in GDS’s Q2 earnings release gives approximately US$884 million, implying roughly 13.0x EV/FY2026 adjusted EBITDA: US$11.53 billion ÷ US$0.884 billion = 13.0x; calculated from company-reported figures and current market data.
That 13.0x figure is not the full story because FY2026 guidance includes Q1 one-time items. GDS’s own presentation shows a pro forma FY2026 adjusted EBITDA midpoint of RMB5.470 billion after removing one-time items, related-party recurring income and EBITDA from monetized assets before deconsolidation. At the same exchange rate, that is approximately US$806 million, implying an illustrative 14.3x EV/pro forma FY2026 adjusted EBITDA: US$11.53 billion ÷ US$0.806 billion = 14.3x; calculated from company-reported figures and current market data. On normalized 2026 earnings, the stock therefore requires more than a low-growth utility-style valuation: investors are underwriting the backlog-to-billing conversion and the 2027 acceleration.
GAAP P/E is a poor primary valuation tool for this quarter because the DayOne dilution gain materially boosted net income and EPS. A more useful framework is to track normalized adjusted EBITDA growth, return on incremental capex, move-in conversion, leverage and eventual free cash flow after development spending.
The key risks are:
- Margin pressure: Q2 gross margin fell to 21.5% from 23.8% and adjusted EBITDA margin to 45.5% from 47.3%, primarily because utility costs increased as a percentage of revenue. Strong bookings do not automatically guarantee attractive incremental margins.
- Pricing and mix: management said Q4 2026 MSR is expected to be about 3% lower than Q4 2025 and could decline by a similar amount in the following year, partly because of new-market mix and roughly another 18 months needed to transition legacy contracts toward current market pricing.
- Execution timing: 2027 move-in is expected to be more than double 2026 and heavily weighted to the second half. A back-end-loaded ramp increases sensitivity to construction schedules, power readiness, customer deployments and compute-hardware availability.
- Capital intensity: capex guidance rose to approximately RMB10 billion, and management indicated unit capex for new capacity averages around RMB20 million per MW. Growth requires substantial funding before the associated EBITDA is fully realized.
- Leverage and refinancing: GDS reported RMB9.21 billion of short-term debt and RMB36.92 billion of long-term debt at June 30. The presentation showed reported net debt to last-quarter annualized adjusted EBITDA of 5.5x and pro forma leverage of 4.7x after including time deposits. Lower financing costs help, but the capital structure remains an important part of the equity risk.
- Customer concentration: the top five revenue customers represented a calculated 64.0% of Q2 revenue. Large customers improve visibility but can increase bargaining power and amplify the impact of any customer-specific slowdown.
- Regulatory and power-allocation risk: management described power approvals as selective and involving local, provincial and central processes. Capacity scarcity can be a moat for incumbents with approvals, but it can also delay development if policy or permitting conditions change.
- Accounting noise: DayOne equity-method gains and Q1 one-time items make reported net income and headline full-year growth less representative of underlying recurring operating performance. Investors should reconcile reported results with GDS’s pro forma disclosures.
The bull case is therefore not “Q2 margins were strong” — they were not. The bull case is that GDS has entered a demand regime in which AI and cloud customers are reserving and contractually committing far more capacity, while the company has enough land, power access, financing channels and operating credibility to convert those commitments into a multi-year billable ramp. The bear case is that the conversion takes longer, costs more, or earns lower margins than the current backlog narrative implies. At the current valuation, execution quality matters at least as much as order growth.
3. Key FAQs
Did GDS beat Q2 2026 earnings expectations?
The answer depends on the metric and the data provider. GDS reported RMB3.088 billion of revenue, essentially in line with a FactSet estimate of about RMB3.09 billion cited around the release, while adjusted EBITDA of RMB1.406 billion was about 5.6% below the roughly RMB1.49 billion S&P Global Visible Alpha consensus reported after the release. EPS comparisons are less clean because public feeds mix ordinary-share, ADS and vendor-adjusted definitions. The official company figure was US$0.52 diluted EPS per ADS and US$0.07 diluted EPS per ordinary share. For investment purposes, the more important surprise was the stronger bookings outlook and raised FY2026 guidance.
Why did GDS stock rise after Q2 2026 earnings?
GDS shares rose because the forward demand picture improved more than the Q2 margin picture deteriorated. Management raised its FY2026 bookings target to 1 GW, disclosed roughly 600 MW of reservations at mid-year, reported 757 MW of backlog and forecast 2027 move-in at more than twice the 2026 level. It also raised full-year revenue and adjusted EBITDA guidance. The ADR gained 6.2% on the earnings day, indicating that investors prioritized future capacity monetization and guidance over the adjusted EBITDA miss and margin compression.
What is GDS’s 2026 revenue and adjusted EBITDA guidance after Q2?
GDS now expects FY2026 total revenue of RMB12.7-13.0 billion, up from the previous RMB12.4-12.9 billion range, and adjusted EBITDA of RMB5.9-6.1 billion, up from RMB5.75-6.0 billion. Capex guidance increased to approximately RMB10.0 billion from approximately RMB9.0 billion. The revenue and adjusted EBITDA ranges include one-time items disclosed in Q1 2026. GDS did not provide separate Q3 2026 revenue, EPS or margin guidance.
Primary company sources: GDS Holdings Investor Relations — Quarterly Results, including the verified Q2 2026 results release, earnings presentation and earnings-call transcript. Additional market-data and consensus references were cross-checked against MarketScreener, StockAnalysis historical prices, and Investing.com.
Disclaimer: This article/chart is for educational and informational purposes only and does not constitute investment advice of any kind. Past performance is not indicative of future results. Investors should independently evaluate their own risks.