Key Takeaways
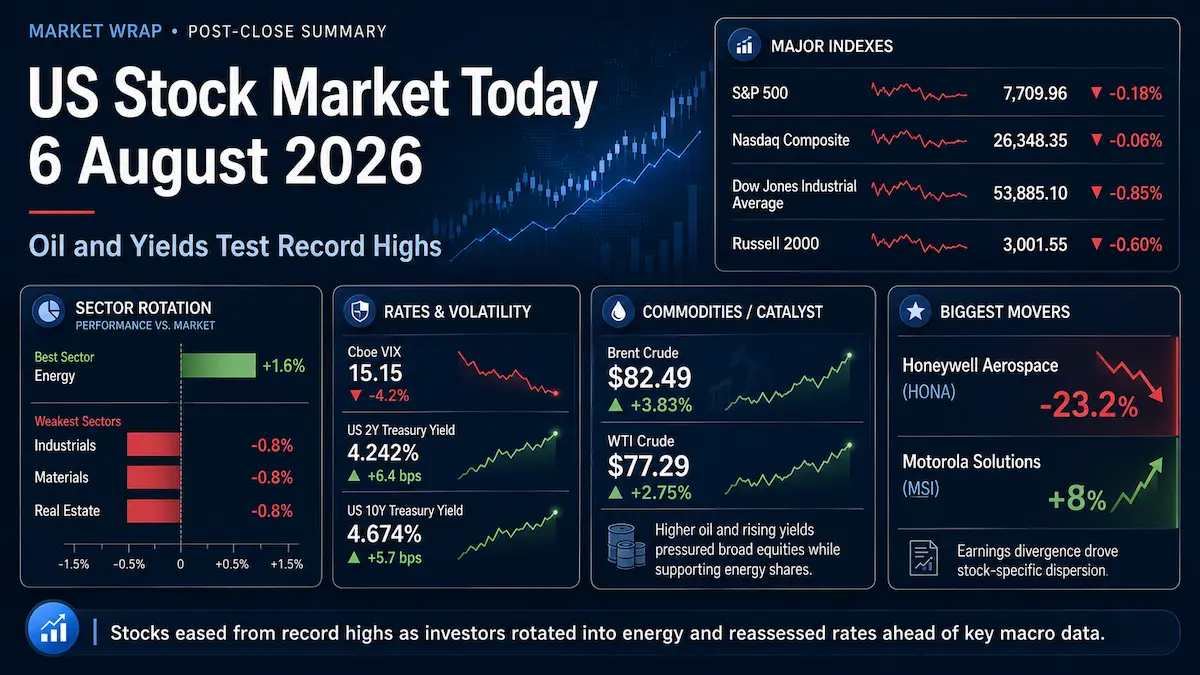
- The S&P 500 fell 0.18% to 7,709.96, the Nasdaq Composite slipped 0.06% to 26,348.35, and the Dow Jones Industrial Average dropped 0.85% to 53,885.10 as investors reduced risk ahead of the July employment report.
- Small caps lagged: the Russell 2000 declined 0.6% to 3,001.55, reinforcing a session in which higher Treasury yields weighed more heavily on rate-sensitive and domestically oriented equities than on the megacap-heavy Nasdaq.
- Energy was the clear sector winner, rising 1.6% as Brent crude gained 3.83% to $82.49 a barrel and WTI rose 2.75% to $77.29. Industrials, materials and real estate each fell about 0.8%, while eight of the 11 S&P 500 sectors finished lower.
- Treasury yields moved higher, with the 2-year yield at 4.242%, up 6.4 basis points, and the 10-year yield at 4.674%, up about 5.7 basis points. The move modestly flattened the 2s10s curve and kept valuation pressure on rate-sensitive assets.
- The Cboe VIX closed at 15.15, down about 4.2% from 15.81 a day earlier. Falling implied volatility despite lower equity indexes argued against a broad panic and instead pointed to concentrated event, rate and earnings risk.
1. Market Capital Flows and Sector Rotation
Thursday’s tape was more nuanced than the headline index declines suggested. The S&P 500 and Nasdaq Composite lost only 0.18% and 0.06%, respectively, but eight of 11 S&P 500 sectors closed lower. The Dow’s 0.85% decline was materially worse, while the Russell 2000 fell 0.6%. That combination indicates a market that was still supported by the largest growth franchises but was less forgiving toward smaller companies, rate-sensitive businesses and stocks facing company-specific execution risk.
Energy was the principal exception. The sector gained 1.6% as crude prices jumped on renewed concern over potential restrictions affecting traffic through the Strait of Hormuz. Brent rose 3.83% to $82.49 and WTI advanced 2.75% to $77.29. The move gave energy producers a direct earnings and cash-flow tailwind, even as the same oil shock complicated the inflation and rate outlook for the broader market.
The weakest sector group was more dispersed. Industrials, materials and real estate each declined about 0.8%. Higher yields are an obvious headwind for real estate because they raise financing costs and reduce the relative appeal of bond-like equity cash flows. For materials and industrials, the pressure was less uniform: higher oil can raise input and transportation costs, while Honeywell Aerospace’s severe post-earnings selloff added an unusually large company-specific drag to industrial sentiment.
Relative index performance also cautioned against describing the session as a simple growth-versus-value rotation. The Nasdaq held up best, but energy rallied strongly at the same time. The Dow underperformed partly because of its more cyclical composition and individual constituent effects, while small caps lagged as the front end of the Treasury curve repriced higher. In other words, investors were separating businesses by balance-sheet sensitivity, earnings visibility and exposure to the oil shock rather than making one clean factor trade.
Institutional Flow Insight
The price action is consistent with institutions trimming risk around a major macro catalyst rather than abandoning equities wholesale. With the July employment report due the next morning, record-high index levels gave portfolio managers an incentive to reduce exposure where valuations or financing sensitivity left less room for error. At the same time, energy offered a near-term fundamental hedge against a geopolitical oil shock. This is an inference from cross-asset price behavior, not confirmation of specific institutional order flow.
2. Decoding the Biggest Market Movers
Honeywell Aerospace (HONA)
Honeywell Aerospace fell 23.2% to $156.47 after its first quarterly report as a standalone public company exposed a sharp gap between healthy end demand and the company’s ability to convert that demand into profitable output. The official second-quarter release reported sales of $4.522 billion, up 5% year over year, and backlog of $18.154 billion, up 9%. Net income was $256 million, adjusted EBIT was $995 million, and adjusted EPS was $1.87.
The problem was not a collapse in orders. Commercial original-equipment sales rose 6%, commercial aftermarket sales increased 8%, and defense and space sales grew 3%. Instead, supply constraints limited output and forced management to recalibrate the 2026 outlook. The company reduced its expected organic sales growth range to 4%-5% from 7%-9% and lowered pro forma standalone adjusted EBIT guidance to $4.35-$4.45 billion from $4.65-$4.75 billion. Expected adjusted EBIT growth was cut to flat-to-3% from 7%-10%, while pro forma standalone adjusted EPS was guided to $7.60-$7.90.
That distinction matters for valuation. A demand slowdown can sometimes be modeled through a normal cyclical reset; an execution bottleneck is harder because it weakens confidence in the timing and margin quality of future revenue conversion. Management’s post-earnings commentary emphasized that supply-chain actions had not yet produced the required output inflection. For investors, the 9% backlog growth therefore became less reassuring than it would normally be because the market had to apply a larger discount to near-term earnings visibility.
The stock’s decline also had broader read-through for industrials. It highlighted that aerospace demand can remain robust while supplier availability, production sequencing and mix still constrain margins. That raised the hurdle for other richly valued industrial companies whose investment cases depend on smooth backlog conversion rather than merely strong orders.
Motorola Solutions (MSI)
Motorola Solutions moved in the opposite direction, rising about 8% after a quarter that reinforced the value of visible, mission-critical demand. The company’s official second-quarter release reported revenue of $3.133 billion, up 13%, with Products and Systems Integration sales up 15% and Software and Services revenue up 10%. GAAP EPS increased 10% to $3.33, while non-GAAP EPS rose 24% to $4.41. Record ending backlog reached $15.6 billion, up 11% year over year.
Management also raised its full-year outlook. Motorola now expects approximately $12.975 billion of 2026 revenue, up from the prior $12.8 billion view, and non-GAAP EPS of $17.62-$17.72, versus $16.87-$16.99 previously. The company guided third-quarter revenue growth to roughly 8% and non-GAAP EPS to $4.39-$4.44.
The contrast with Honeywell Aerospace was instructive. Both companies participate in long-cycle, mission-critical end markets, but Motorola’s quarter showed backlog converting into double-digit revenue growth and a higher earnings outlook. That supported the market’s willingness to pay for execution visibility even on a day when Industrials as a sector fell 0.8%. The dispersion also suggests that investors are rewarding demonstrated conversion of demand into earnings rather than treating a large order book as sufficient on its own.
3. Macro Indicators and Market Outlook
The Cboe VIX closed at 15.15, down from 15.81 on August 5, a decline of roughly 4.2%. That divergence from the lower equity indexes is important. If Thursday’s selling had reflected a broad escalation in systemic equity risk, implied volatility would typically be expected to rise. Instead, the VIX decline suggested that investors were not aggressively paying up for index-level protection even as they reduced exposure in rate-sensitive sectors and punished individual earnings disappointments.
Treasury yields told a different story. The 2-year yield finished around 4.242%, up 6.4 basis points, while the 10-year yield was around 4.674%, up about 5.7 basis points. Because the 2-year yield rose slightly more, the 2s10s curve bear-flattened modestly to a spread of roughly 43 basis points. The move was consistent with a market assigning somewhat greater weight to near-term inflation and policy-rate risk after firmer oil prices and generally stable labor-market indicators.
It would be a mistake to translate one day’s yield move directly into a confirmed Federal Reserve decision. The more defensible interpretation is that investors demanded a slightly higher rate path and inflation-risk premium ahead of the employment report. The 10-year move also reflected the interaction between expected short rates, growth expectations and term premium, all of which can change quickly when incoming labor or inflation data surprise.
Oil was the cross-asset variable with the clearest equity read-through. Renewed concern about the Strait of Hormuz lifted crude sharply, benefiting energy shares while raising potential cost and inflation pressure elsewhere. The dollar also strengthened and the Treasury curve bear-flattened, a combination that generally tightens financial conditions at the margin. Gold was little changed, which further argued against interpreting the session as a broad flight to safety.
Upcoming Economic Data & Catalysts
- Employment Situation for July 2026 (Release date: August 7, 2026): The Bureau of Labor Statistics is scheduled to release nonfarm payrolls, unemployment and wage data at 8:30 a.m. ET. Investors will focus on whether labor demand is cooling enough to relieve inflation pressure without signaling a sharper growth downturn.
- Consumer Price Index for July 2026 (Release date: August 12, 2026): The Bureau of Labor Statistics is scheduled to publish July CPI at 8:30 a.m. ET. Core inflation and any energy-related acceleration will be central to the next repricing of Treasury yields, rate-sensitive equity valuations and the expected policy path.
Market Insights
Thursday was not simply a decline driven by one or two megacap technology stocks. Sector participation was weak, with eight S&P 500 groups lower, and the Russell 2000’s 0.6% loss showed that risk appetite softened below the largest-cap tier. At the same time, the limited S&P 500 and Nasdaq declines, the 1.6% gain in energy and the fall in the VIX argue that the session was a rotation and event-risk adjustment rather than a broad liquidation.
The most important reversal risks are therefore identifiable. A further surge in oil or a decisive rise in the 10-year Treasury yield could pressure equity multiples and rate-sensitive sectors. A deterioration in breadth, especially if small caps continue to lag while fewer large stocks hold up the indexes, would weaken the market’s internal structure. Downward earnings revisions after high-profile execution misses would add a separate fundamental risk. Conversely, stable labor and inflation data that stop yields from rising would reduce one of the main cross-asset constraints on equities.
Trading & Investment Strategy
Investors should treat the current environment as one that rewards selectivity more than index-level chasing. Position sizes should reflect the fact that major indexes remain near record territory while the rate and oil backdrop can change quickly around macro releases. Staggered entries are preferable to committing full risk immediately before event catalysts, and stop-loss or thesis-review levels should be defined before entering a position.
At the sector level, energy can provide earnings sensitivity to higher oil, but investors should avoid assuming that a geopolitical price spike will persist indefinitely. Rate-sensitive areas such as real estate and smaller-cap equities warrant closer scrutiny when front-end yields are rising. Within industrials, the Honeywell-Motorola divergence reinforces the importance of execution, backlog conversion and earnings visibility. The objective should be to preserve flexibility rather than chase the strongest one-day move after the market has already repriced the catalyst.
4. Key FAQs About the US Stock Market Today
Why did the US stock market move on August 6, 2026?
U.S. stocks eased as Treasury yields rose, oil prices jumped on renewed Strait of Hormuz concerns, and investors reduced risk ahead of the July employment report. Earnings dispersion also mattered: Honeywell Aerospace’s guidance reset weighed heavily on industrial sentiment, while Motorola Solutions rallied after raising its outlook.
Which sectors performed best and worst in the US stock market on August 6, 2026?
Energy was the best-performing S&P 500 sector, up 1.6%, as Brent and WTI crude rallied sharply. Industrials, materials and real estate were among the weakest groups, each down about 0.8%. The pattern reflected a mix of oil sensitivity, higher Treasury yields and company-specific earnings risk rather than a single broad factor trade.
What should investors watch after the US stock market close on August 6, 2026?
The immediate catalyst is the July Employment Situation on August 7, followed by July CPI on August 12. Investors should watch whether the 2-year and 10-year Treasury yields continue to rise, whether small-cap and sector breadth deteriorate further, and whether the VIX begins to confirm a broader increase in risk rather than remaining subdued.
Disclaimer: This article is intended solely for the exchange of investment ideas and does not constitute investment advice of any kind.