

Key Takeaways
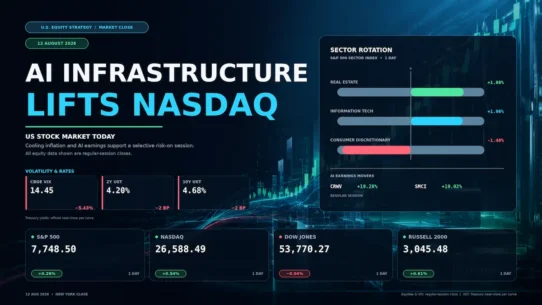
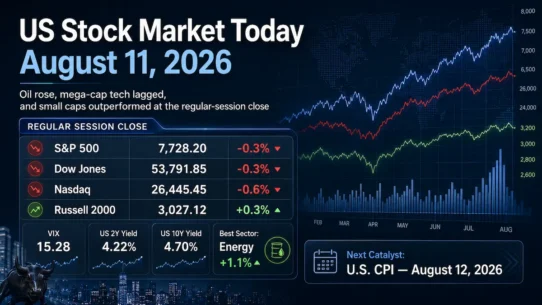
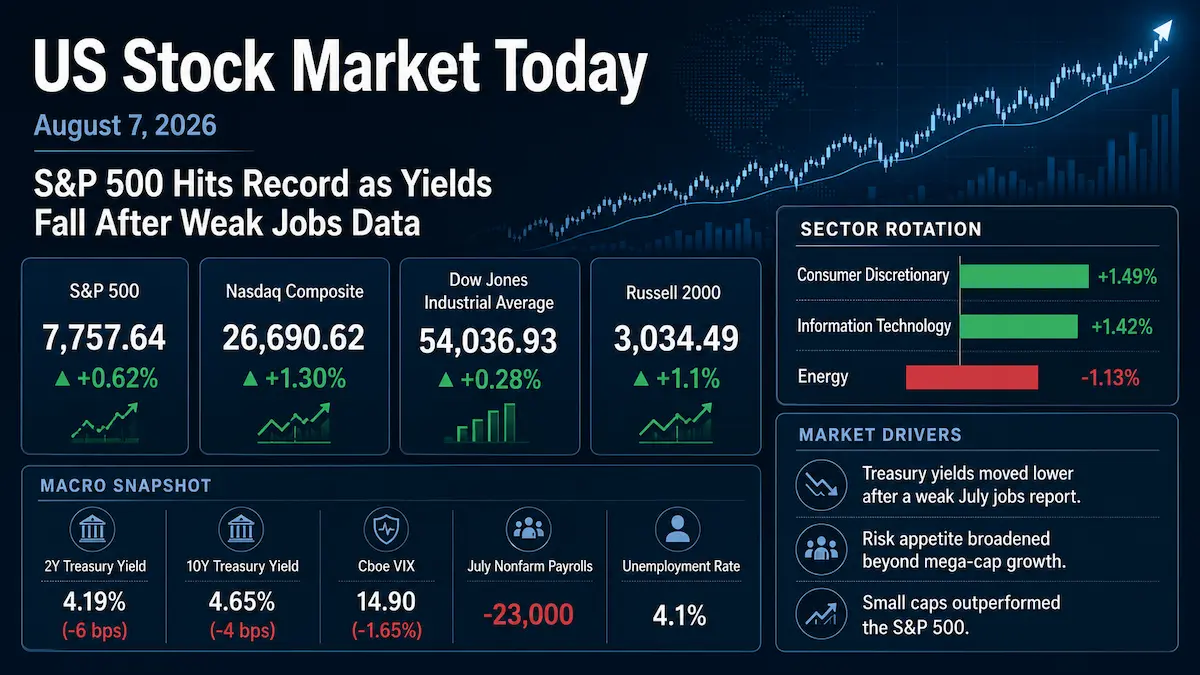
- The S&P 500 rose 0.62% to a record close of 7,757.64, the Nasdaq Composite gained 1.30% to 26,690.62, and the Dow Jones Industrial Average added 0.28% to 54,036.93. The Russell 2000 advanced 1.1% to 3,034.49, confirming broader participation beyond mega-cap growth.
- July nonfarm payrolls fell by 23,000, while May and June payrolls were revised down by a combined 103,000. The unemployment rate was 4.1%, labor-force participation was 61.4%, and average hourly earnings were 3.2% higher from a year earlier.
- The U.S. Treasury’s official daily par yield curve showed the 2-year yield at 4.19%, down 6 basis points from August 6, and the 10-year yield at 4.65%, down 4 basis points. The rates move favored duration-sensitive equities without confirming any future Federal Reserve action.
- Using the Select Sector SPDRs as verified close-to-close proxies, consumer discretionary rose 1.49% and technology gained 1.42%, while energy fell 1.13%. Doximity surged 32.62% in the regular session after its latest earnings release, but finished far below its $40 intraday high.
- The Cboe VIX closed at 14.90, down 1.65%, indicating that the weak labor report did not produce a broad end-of-day volatility shock. The next major macro tests are July CPI on August 12 and July PPI on August 13.
1. Market Capital Flows and Sector Rotation
Friday’s close was a risk-on session, but the leadership pattern was more informative than the index headline. Using State Street’s Select Sector SPDRs as liquid, close-to-close proxies for the corresponding S&P 500 sectors, Consumer Discretionary (XLY) led with a 1.49% gain and Information Technology (XLK) rose 1.42%, while Energy (XLE) was the weakest at -1.13%. These are ETF proxy returns rather than the official S&P sector-index returns. The mix was consistent with stronger demand for duration-sensitive growth and consumer cyclicality as Treasury yields fell, while energy lost relative support as some of the geopolitical inflation premium eased.
Size and style performance reinforced the rotation. The Nasdaq Composite’s 1.30% gain substantially outpaced the Dow’s 0.28%, indicating stronger demand for growth-heavy exposure than for more traditional value-oriented large caps. At the same time, the Russell 2000’s 1.1% advance exceeded the S&P 500’s 0.62% gain, showing that smaller companies participated meaningfully as financing conditions became less restrictive at the margin. Cyclicals were not uniformly strong: consumer discretionary led, but energy lagged, while defensive leadership was absent. Market breadth was constructive, with advancing stocks outnumbering decliners by 2.49-to-1 on the NYSE and 2.07-to-1 on Nasdaq. Total U.S. exchange volume was 16.94 billion shares, below the 17.56 billion-share average over the prior 20 full sessions, suggesting broad participation without unusually heavy turnover.
Institutional Flow Insight: The tape is consistent with investors increasing exposure to rate-sensitive growth, discretionary names and selected smaller companies as front-end yields declined, while reducing relative exposure to energy and lower-beta defensives. That is an inference from market behavior, not confirmed institutional fund-flow data. Lower discount rates improve the present value of longer-duration cash flows and can reduce the financing headwind for smaller companies. However, the payroll decline also weakens the growth signal, so the session should not be read as an unconditional endorsement of cyclicality. Month-start rebalancing may have amplified positioning changes, but there is insufficient verified flow evidence to identify it as a confirmed driver.
2. Decoding the Biggest Market Movers
Doximity (DOCS)
Doximity rose 32.62% in the regular session to $27.40 after its August 6 fiscal first-quarter 2027 earnings release materially improved the market’s view of revenue momentum and AI engagement. The company’s SEC-filed press release reported revenue of $156.6 million, up 7% year over year; net income of $24.3 million, with a 15.5% net margin; adjusted EBITDA of $74.8 million, with a 47.7% margin; GAAP diluted EPS of $0.13; and non-GAAP diluted EPS of $0.29. Revenue and adjusted EBITDA exceeded Doximity’s own prior official first-quarter guidance of $151 million-$152 million and $68.5 million-$69.5 million, respectively. Management guided fiscal second-quarter revenue to $170 million-$171 million and adjusted EBITDA to $80.5 million-$81.5 million.
The full-year outlook was more nuanced than the headline rally suggested. Doximity raised its fiscal 2027 revenue range to $671 million-$681 million from its prior $664 million-$676 million range, while updating full-year adjusted EBITDA guidance to $309 million-$329 million from the previously issued $323 million-$335 million range. The quarter also showed margin and cash-flow pressure: adjusted EBITDA margin declined from 54.7% a year earlier to 47.7%, and free cash flow fell 34% year over year to $39.6 million. At the operating level, CEO Jeff Tangney said workflow active prescribers grew more than 30% year over year and AI Search queries increased more than 25% quarter over quarter. The company also highlighted Doximity Ask’s performance in the NOHARM clinical-AI benchmark.
The price action itself carried an important message for the health-care technology group. DOCS opened at $38.87 and traded as high as $40.00 before closing at $27.40; all of those prices were from the regular session. The 32.62% close still represented a major re-rating, but the steep fade from the intraday high suggests investors were balancing faster AI engagement and better revenue momentum against lower profitability and cash-flow conversion. For digital-health and physician-platform peers, the read-through is that AI engagement can support a higher strategic option value, but durable valuation expansion is more likely to require evidence that usage converts into revenue without structurally eroding margins.
3. Macro Indicators and Market Outlook
The Cboe VIX closed at 14.90 on August 7, down from 15.15 on August 6, a decline of about 1.65%. That move was directionally consistent with the equity rally. Despite a payroll decline that raised questions about labor-market momentum, the close did not show a broad volatility shock or an urgent end-of-day scramble for S&P 500 protection. A VIX below 15 also means implied volatility was relatively contained heading into next week’s inflation data, leaving the market vulnerable to a faster repricing if yields reverse sharply higher. The VIX close therefore indicates contained hedging demand, not the absence of event risk.
The U.S. Treasury’s official daily par yield curve showed the 2-year yield at 4.19% and the 10-year yield at 4.65% on August 7, versus 4.25% and 4.69%, respectively, on August 6. The 2-year fell 6 basis points and the 10-year fell 4 basis points, producing a modest bull-steepening in the 2s10s curve to roughly 46 basis points. The front end moved more because it is more sensitive to changes in expectations for Federal Reserve policy. The weak labor report reduced the market’s perceived urgency for additional tightening, but a single session of lower yields should not be equated with a confirmed future rate decision.
The labor report was more complicated than a simple dovish signal. Nonfarm payrolls fell 23,000 in July, and May and June payrolls were revised down by a combined 103,000. The unemployment rate was 4.1%, labor-force participation was 61.4%, and average hourly earnings were still 3.2% higher than a year earlier. That combination softens the growth impulse and reduces immediate pressure for tighter policy, but it does not eliminate inflation risk. Reuters also reported that progress toward a possible Iran peace deal had helped cool oil prices and inflation concerns during the week. That geopolitical channel remains unstable and should not be treated as a permanent disinflation force.
Upcoming Economic Data & Catalysts:
- U.S. Consumer Price Index for July 2026 (Release date: August 12, 2026): The Bureau of Labor Statistics will release CPI at 8:30 a.m. ET. Investors will focus on whether inflation is cooling enough to support Friday’s lower-yield reaction. A renewed inflation impulse could reverse part of the duration trade and pressure high-multiple growth equities.
- U.S. Producer Price Index for July 2026 (Release date: August 13, 2026): The Bureau of Labor Statistics will release PPI at 8:30 a.m. ET. Pipeline pricing will matter for the rates market and for corporate margin assumptions, particularly where tariff, energy or other input-cost pass-through remains relevant.
Market Insights:
Friday’s advance was broader than a narrow mega-cap rally. Positive NYSE and Nasdaq breadth, together with Russell 2000 outperformance, show that lower yields supported a wider risk budget. Yet the Nasdaq still led decisively and technology was among the strongest sector exposures, so duration-sensitive growth remained the center of gravity. The main reversal risks are a sharp rebound in Treasury yields, weaker breadth beneath new index highs, downward earnings revisions, a renewed geopolitical or energy shock, a policy surprise, or a sustained VIX break higher. Valuation risk also remains asymmetric: when multiples are elevated, even modest changes in growth or margin expectations can create outsized single-stock volatility.
Trading & Investment Strategy:
Risk management should take priority over chasing Friday’s gaps. Investors can consider scaling into positions rather than deploying full size immediately ahead of CPI, with preference for companies that combine earnings visibility, balance-sheet strength and identifiable catalysts. Within growth, businesses with demonstrated demand and cash-flow durability offer a more defensible setup than names relying primarily on multiple expansion; within small caps, financing sensitivity makes balance-sheet quality especially important. For tactical positions, define invalidation levels before entry and maintain stop-loss discipline. After a large one-day gap, allow price discovery to develop rather than assuming momentum must continue, and preserve liquidity for volatility around the inflation releases.
4. Key FAQs About the US Stock Market Today
Why did the US stock market move on August 7, 2026?
Stocks rose because the July payroll decline and sharp downward revisions to prior months pulled Treasury yields lower and reduced the market’s perceived urgency for additional Federal Reserve tightening. That improved the discount-rate backdrop for equities, while strong company-specific earnings reactions supported risk appetite. The move was broad enough to include small caps, although Nasdaq leadership showed that rate-sensitive growth remained the primary beneficiary.
Which sectors performed best and worst in the US stock market on August 7, 2026?
Using the Select Sector SPDRs as verified liquid proxies for S&P 500 sector performance, Consumer Discretionary (XLY) was strongest at +1.49%, followed closely by Information Technology (XLK) at +1.42%. Energy (XLE) was weakest at -1.13%. The rotation was consistent with lower yields supporting growth and discretionary exposure while energy lost relative support as part of the near-term inflation risk premium eased.
What should investors watch after the US stock market close on August 7, 2026?
The next major macro tests are July CPI on August 12 and July PPI on August 13. Investors should also monitor whether the 2-year Treasury yield holds its post-jobs decline, whether small-cap and market-breadth participation persist, and whether the VIX remains contained. A reversal higher in yields or deterioration in breadth would weaken the quality of the record-high signal, while earnings-guidance cuts could reintroduce stock-specific volatility even if the broad index remains firm.
Selected Primary Sources
Disclaimer: This article is intended solely for the exchange of investment ideas and does not constitute investment advice of any kind.