

Key Takeaways
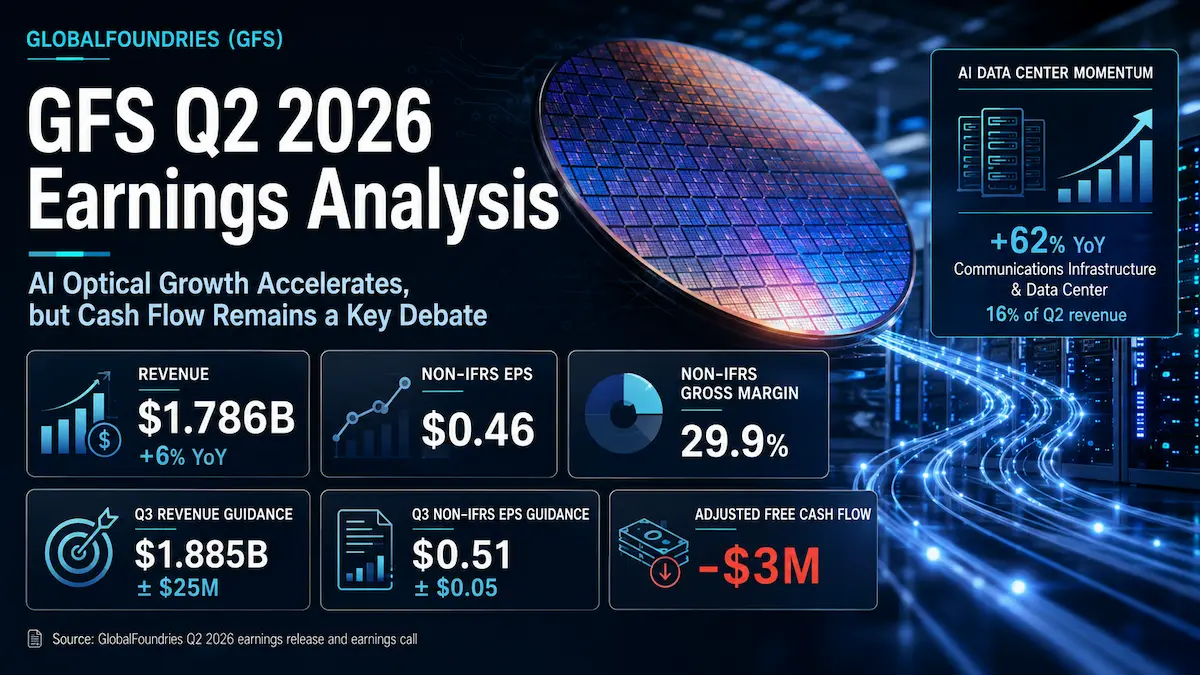
- GlobalFoundries reported Q2 2026 revenue of $1.786 billion and Non-IFRS diluted EPS of $0.46, above Reuters/LSEG consensus of $1.77 billion and $0.44, respectively. Revenue also finished $1 million above the high end of the company’s prior guidance range.
- Communications Infrastructure and Data Center was the standout: about 16% of Q2 revenue, up 62% year over year. Management raised its full-year 2026 growth outlook for the end market to 50%–60% and now expects silicon photonics revenue to more than double in 2026.
- Non-IFRS gross margin expanded 470 basis points year over year to 29.9%, driven by richer manufacturing and technology-services mix, structural cost improvement and utilization. Yet adjusted EBITDA margin fell 180 basis points to 32.9%, showing that higher R&D and strategic investment are absorbing part of the gross-profit gain.
- Adjusted free cash flow was negative $3 million as net capital expenditures reached $408 million, or roughly 23% of revenue. That cash-flow profile is the main counterweight to the stronger AI optical-networking story.
- Q3 guidance was not an obvious disappointment: the $1.885 billion revenue midpoint was roughly in line with $1.88 billion consensus, while the $0.51 Non-IFRS EPS midpoint was above a $0.49 consensus feed. The post-earnings stock decline therefore looks more like a debate over earnings quality, spending and valuation than a simple guidance miss.
Accounting note: GlobalFoundries reports under International Financial Reporting Standards (IFRS), not U.S. GAAP. Accordingly, this analysis compares IFRS results with the company’s Non-IFRS measures rather than using a generic GAAP/non-GAAP framework.
1. Core Earnings Breakdown
Revenue and Profitability Analysis
GlobalFoundries generated Q2 2026 revenue of $1.786 billion, up 6% year over year and 9% sequentially. Wafer shipments were approximately 625,000 300mm-equivalent wafers, up 8% both year over year and sequentially. The combination is important: growth was not merely an accounting or acquisition effect. Physical wafer output increased, while a richer mix of higher-value manufacturing and technology services lifted gross profit faster than revenue.
The end-market mix showed a company increasingly pulled in two directions: accelerating AI infrastructure and recovering IoT on one side, and weaker mobile plus timing-related automotive softness on the other.
- Communications Infrastructure and Data Center: approximately 16% of Q2 revenue, up 62% year over year and 20% sequentially. This was the highest-quality growth bucket because silicon photonics and silicon germanium are capacity-constrained, strategically differentiated technologies with attractive margin characteristics. Management raised full-year 2026 growth expectations for this end market to 50%–60% from a prior high-30s percentage outlook.
- Automotive: approximately 19% of Q2 revenue, down 10% year over year and 13% sequentially, primarily because of customer shipment timing. Management nevertheless maintained low-double-digit full-year growth, weighted more heavily to Q4. The investment question is therefore execution and timing rather than an explicit change in long-term automotive demand.
- Smart Mobile Devices: approximately 36% of Q2 revenue, down 6% year over year but up 15% sequentially. Management now expects a low-teens percentage full-year decline as handset forecasts were reduced amid memory pricing and shortage pressures. Because mobile remains the largest disclosed end-market bucket, it is still large enough to offset part of the AI data-center acceleration.
- Home and Industrial IoT: approximately 19% of Q2 revenue, up 10% year over year and 30% sequentially. Management raised its 2026 growth outlook to 10%–15% from mid-single digits as inventories normalize and next-generation products ramp. The improvement broadens the recovery beyond AI infrastructure and reduces reliance on one growth engine.
Those four end markets account for approximately 90% of Q2 revenue based on management’s rounded mix disclosures. The call did not assign the residual percentage to another named bucket in the same discussion, so it would be inappropriate to manufacture a segment label for the remainder.
Profitability was stronger on an adjusted basis but more mixed on the statutory IFRS line. IFRS gross margin was 28.3%, up 410 basis points year over year, while Non-IFRS gross margin reached 29.9%, up 470 basis points. IFRS operating margin was 9.7%, down 190 basis points year over year, whereas Non-IFRS operating margin was 16.7%, up 140 basis points. IFRS diluted EPS was $0.30 versus $0.41 a year earlier; Non-IFRS diluted EPS was $0.46 versus $0.42.
The gap matters. The 7.0 percentage-point difference between IFRS and Non-IFRS operating margin is calculated from company-reported figures (16.7% minus 9.7%). Share-based compensation, acquisition-related charges and other items included in the company’s reconciliation make the adjusted operating picture materially stronger than the statutory one. Investors should therefore avoid treating the 16.7% operating margin as interchangeable with reported IFRS profitability.
Another quality check is adjusted EBITDA. It was $587 million, only $2 million above Q2 2025, while adjusted EBITDA margin declined to 32.9% from 34.7%. That does not negate the gross-margin progress; it shows that the company is simultaneously increasing R&D and strategic spending. The core debate is whether those investments convert today’s gross-profit improvement into structurally higher operating earnings later.
Expectations vs. Actual Results
- Revenue: $1.786 billion actual versus $1.77 billion Reuters/LSEG consensus — ✅ beat by approximately $16 million, or about 0.9%. It was also $1 million above the $1.785 billion high end of GlobalFoundries’ prior guidance range.
- Non-IFRS diluted EPS: $0.46 actual versus $0.44 Reuters/LSEG consensus — ✅ beat by $0.02, or about 4.5%. The result also landed at the high end of the company’s prior $0.38–$0.48 range.
- Non-IFRS gross margin: 29.9% actual versus the company’s prior 28.5% ± 100 basis-point guidance — ✅ 40 basis points above the top of the range.
- Non-IFRS operating margin: 16.7% actual versus the company’s prior 15.7% midpoint — ✅ 100 basis points above the midpoint. A reliable like-for-like Wall Street operating-margin consensus was not identified in the verified sources, so this article does not present an invented Street comparison.
The beat was fundamentally a mix-and-execution beat. Communications Infrastructure and Data Center grew 62% year over year, technology services reached approximately 11% of revenue, utilization was in the high-80% range, and management credited structural manufacturing-cost improvements. The company’s CFO also said technology-services growth provided roughly one percentage point of gross-margin benefit year over year.
For Q3 2026, GlobalFoundries guided to revenue of $1.885 billion ± $25 million, IFRS gross margin of 29.5% ± 100 basis points, Non-IFRS gross margin of 30.5% ± 100 basis points, IFRS operating margin of 12.7% ± 170 basis points, Non-IFRS operating margin of 16.7% ± 170 basis points, IFRS diluted EPS of $0.37 ± $0.05 and Non-IFRS diluted EPS of $0.51 ± $0.05. The revenue midpoint was roughly in line with a $1.88 billion consensus estimate, while the Non-IFRS EPS midpoint was above a $0.49 consensus cited by The Fly/TipRanks.
What the market appears to care about most is no longer simply whether GFS can beat quarterly EPS by a few cents. The higher-value variables are the durability of silicon-photonics demand, the speed at which technology services become a meaningful high-margin revenue stream, the path from roughly 30% adjusted gross margin toward the company’s longer-term model, and whether heavy capacity investment can still produce the targeted full-year adjusted free-cash-flow margin of approximately 10%.
The stock reaction exposed that tension. GFS closed at $49.46 on August 5, down 4.92% from the prior day’s $52.02 close, even though it traded as high as $52.64 intraday. It then rebounded 1.82% to $50.36 on August 6. The decline is difficult to explain as a conventional guidance miss because Q3 revenue was approximately in line with consensus and EPS guidance was above one widely cited consensus figure. A more defensible interpretation is that investors discounted part of the earnings beat because adjusted free cash flow fell to negative $3 million from positive $277 million a year earlier, smart-mobile expectations weakened, and second-half Non-IFRS operating expenses are expected to remain around the Q3 level as R&D and acquisition integration accelerate. Post-earnings price-target changes were also mixed rather than uniformly bullish, reinforcing that the argument is about medium-term conversion, not the headline quarter alone.
Earnings Call Highlights
- Management strategic point: GlobalFoundries secured seven new optical-networking design wins in Q2, is engaged with four of the top five optical-transceiver players, and now expects silicon-photonics revenue to more than double in 2026. 💡 Reading Between the Lines: This moves the AI thesis from a generic semiconductor-demand story toward a capacity-and-design-win story. If customer engagements convert into volume, silicon photonics can raise both growth and mix; the risk is that capacity has to arrive fast enough without permanently depressing free-cash-flow returns.
- Management strategic point: Technology services represented about 11% of Q2 revenue, and MIPS plus the acquired Synopsys ARC Processor IP business are now expected to contribute roughly $100 million–$120 million to full-year 2026 technology-services revenue. 💡 Reading Between the Lines: GF is deliberately moving earlier in the customer design cycle, where IP, software, licensing and engineering can influence the eventual manufacturing decision. The strategic value is not only the stand-alone revenue; it is the potential to pull future wafer volume into GF’s fabs while carrying a gross-margin profile above the corporate average.
- Management strategic point: GF has started four customer-specific quantum engagements since launching Quantum Technology Solutions and expects near-term quantum revenue to come mainly from engineering work, with manufacturing revenue ramping closer to the end of the decade. 💡 Reading Between the Lines: Quantum should not be modeled as a near-term wafer-volume windfall. The investable option is a services-led relationship today that could create high-volume manufacturing exposure later; the expected $375 million U.S. government grant is a strategic enabler, but it remains an expected award tied to a letter of intent rather than cash that investors should assume is already secured.
- Management strategic point: Price increases negotiated across several technology corridors in Q2 are expected to begin appearing in revenue in 2027, while second-half R&D and operating expenses will rise as GF integrates ARC and Photeon’s IVR business. 💡 Reading Between the Lines: Management is trying to fund a broader technology stack with both richer mix and better pricing rather than relying only on volume. That is constructive for long-run margins, but it also means near-term operating leverage can look less impressive than gross-margin expansion until the new revenue streams scale.
- Management strategic point: Utilization was in the high-80% range, and management said it still has room to grow into existing capacity while adding targeted data-center capacity inside current fab footprints. 💡 Reading Between the Lines: This is a better capital-efficiency setup than building entirely new fabs for every growth corridor. The key modeling question is whether targeted tooling and capacity additions can generate enough incremental high-margin revenue to restore free-cash-flow conversion after Q2’s investment spike.
2. Deep Business Insights
Hidden Metrics That Matter
Metric 1 — AI data-center growth appears to have generated more than 100% of the company’s net year-over-year revenue increase. This is calculated from company-reported figures and rounded end-market mix: Q2 Communications Infrastructure and Data Center revenue was approximately 16% × $1.786 billion = $286 million. If that figure was 62% above the prior year, the comparable Q2 2025 level was approximately $286 million ÷ 1.62 = $176 million. The implied increase is therefore about $109 million. Total company revenue increased by only $98 million ($1.786 billion minus $1.688 billion), so the approximate CID contribution equals $109 million ÷ $98 million = 112% of total net growth. Because the 16% mix is rounded, this is an analytical approximation, not a company-reported segment dollar figure.
The implication is powerful: AI/data-center strength did more than contribute to growth; it appears to have offset contraction elsewhere. That makes the quality of the silicon-photonics and SiGe pipeline disproportionately important to the consolidated growth rate. It also means a slowdown in this one high-momentum end market would be more damaging than its 16% revenue mix might initially suggest.
Metric 2 — Adjusted gross-profit flow-through was unusually strong. Non-IFRS gross profit increased to $534 million from $425 million, a $109 million increase, while revenue rose by $98 million. Calculated from company-reported figures, incremental Non-IFRS gross profit divided by incremental revenue was approximately $109 million ÷ $98 million = 111%. This is not a sustainable “incremental margin” assumption for a long-term model; it reflects a favorable combination of mix, technology-services growth, manufacturing productivity and utilization. The CFO independently described the quarter as roughly $100 million of revenue growth accompanied by roughly $100 million of adjusted gross-profit growth.
Why are customers choosing GF? The differentiated proposition is not leading-edge CPU/GPU logic. It is the combination of specialty process technologies, 300mm manufacturing, secure multi-region supply, long product lifecycles and increasingly integrated IP-to-manufacturing capabilities. Silicon photonics and SiGe address the optical interconnect bottleneck inside AI infrastructure; BCD and IVR address power delivery; FDX supports differentiated low-power and automotive applications; ARC and MIPS move GF closer to software and architecture decisions. For customers, that can reduce the number of handoffs between design, specialty process development and volume manufacturing — a strategic advantage if GF can execute consistently across the stack.
Industry Chain Reactions
- ✅ Potential beneficiary — Marvell Technology (NASDAQ: MRVL): GF’s 62% growth in Communications Infrastructure and Data Center, seven new optical-networking design wins and expectation for more than 2× silicon-photonics revenue are positive read-throughs for the broader AI optical-interconnect market. This is an industry-demand inference, not a claim that Marvell was one of the unnamed GF customers or that GF’s quarter directly adds to Marvell revenue.
- ❌ Potential competitive pressure — Tower Semiconductor (NASDAQ: TSEM): GF is expanding silicon-photonics and SiGe capacity, pursuing U.S. funding and pushing deeper into specialty optical technologies while also litigating against Tower over alleged patent infringement. That combination raises competitive and legal intensity in specialty foundry markets. It is not evidence that Tower lost share in Q2, and the lawsuit allegations should not be treated as adjudicated facts.
Valuation Framework and Key Risks
Using the August 6 regular-session close of $50.36, GlobalFoundries carried a market capitalization of approximately $27.63 billion and enterprise value of approximately $25.95 billion. Third-party market data showed a trailing P/E of roughly 39.4×, forward P/E of roughly 22.6×, EV/EBITDA of roughly 12.7× and price-to-free-cash-flow of roughly 34.7×. The stock was also well below its 52-week high of $92.55.
That valuation is neither a distressed-foundry multiple nor an unquestioned AI premium. At roughly 22.6× forward earnings, the market is still assigning value to the transition toward higher-margin data-center, technology-services, power and specialty platforms. The multiple becomes easier to defend if three things happen together: Communications Infrastructure and Data Center sustains the raised 50%–60% 2026 growth trajectory, Non-IFRS gross margin holds around or above 30% while R&D scales efficiently, and adjusted free-cash-flow margin recovers toward management’s approximately 10% full-year target.
The downside framework is equally clear. If mobile weakness persists, AI optical growth decelerates after capacity is added, or R&D and acquisition integration consume more operating leverage than expected, the forward earnings multiple can compress even if reported revenue continues to grow. A company that is spending heavily to create a differentiated specialty platform ultimately has to prove returns on invested capital through cash flow, not only design wins.
- Cash-flow and capital-intensity risk: Q2 net CapEx was $408 million, roughly 23% of revenue, leaving adjusted free cash flow at negative $3 million. Management still targets approximately 10% adjusted FCF margin for full-year 2026, making second-half cash conversion a critical proof point.
- End-market concentration risk: Smart mobile remained about 36% of Q2 revenue and is expected to decline by a low-teens percentage in 2026. The AI/data-center ramp is strong, but it is still fighting a large cyclical drag.
- Adjusted-versus-IFRS risk: Q2 Non-IFRS operating margin exceeded IFRS operating margin by 7.0 percentage points. Investors should track whether stock compensation, acquisition costs and other adjustments remain structurally elevated as the portfolio expands.
- Investment and integration risk: GF expects second-half operating expenses near its Q3 level as it integrates ARC and Photeon’s IVR assets and accelerates R&D across AI data center, physical AI, quantum and advanced packaging.
- Government-funding risk: The announced $300 million silicon-photonics support and $375 million quantum support are described as expected awards under letters of intent. Timing, conditions and final funding realization should not be modeled as unconditional cash.
- Execution risk in new growth corridors: Seven optical wins, quantum engineering engagements and software-to-silicon ambitions increase the addressable market, but design wins must convert into qualified production at acceptable yield and utilization.
- Competitive and legal risk: Specialty foundry competition remains intense, and the Tower Semiconductor patent dispute adds uncertainty. Allegations in litigation are not proven outcomes.
The cleanest valuation test is therefore not “Is GFS an AI stock?” It is whether AI optical networking and higher-margin technology services can raise the normalized earnings and free-cash-flow base enough to justify a premium over a conventional cyclical foundry. Q2 moved that thesis forward on mix and design wins, but the cash-flow result shows the proof is incomplete.
3. Key FAQs
Did GFS beat Q2 2026 earnings expectations?
Yes. GlobalFoundries reported Q2 2026 revenue of $1.786 billion versus $1.77 billion Reuters/LSEG consensus and Non-IFRS diluted EPS of $0.46 versus $0.44 consensus. Non-IFRS gross margin of 29.9% also exceeded the high end of the company’s prior guidance range. The more nuanced point is that IFRS operating margin was 9.7%, compared with 16.7% on a Non-IFRS basis, so the adjusted beat should not be treated as identical to statutory profitability.
Why did GFS stock fall after Q2 2026 earnings?
GFS fell 4.92% on August 5 despite beating headline revenue and adjusted EPS estimates. Q3 revenue guidance was roughly in line with consensus and the Non-IFRS EPS midpoint was above one cited consensus estimate, so a simple “guidance miss” explanation is not well supported. The more plausible concerns were negative Q2 adjusted free cash flow, heavy capital spending, weaker full-year smart-mobile expectations, rising R&D and operating expenses, and uncertainty over how quickly new AI and IP investments will convert into cash earnings.
What is GFS Q3 2026 guidance and what matters most for AI data centers?
GlobalFoundries guided Q3 revenue to $1.885 billion ± $25 million, Non-IFRS gross margin to 30.5% ± 100 basis points, Non-IFRS operating margin to 16.7% ± 170 basis points and Non-IFRS diluted EPS to $0.51 ± $0.05. For the AI thesis, the more important indicators are the raised 50%–60% full-year growth outlook for Communications Infrastructure and Data Center, the expectation that silicon-photonics revenue will more than double in 2026, the pace of capacity additions, and whether those investments translate into improving free-cash-flow conversion.
Primary financial data and guidance were verified against the official GlobalFoundries Q2 2026 financial results and the GlobalFoundries Investor Relations website. Market-consensus figures were cross-checked with Reuters. The official release links to the company webcast and replay; conference-call wording was also cross-checked against a Quartr-sourced transcript hosted by StockAnalysis. Stock-price and valuation figures use the latest completed U.S. regular session available for this analysis, August 6, 2026.
Disclaimer: This article/chart is for educational and informational purposes only and does not constitute investment advice of any kind. Past performance is not indicative of future results. Investors should independently evaluate their own risks.