


Key Takeaways
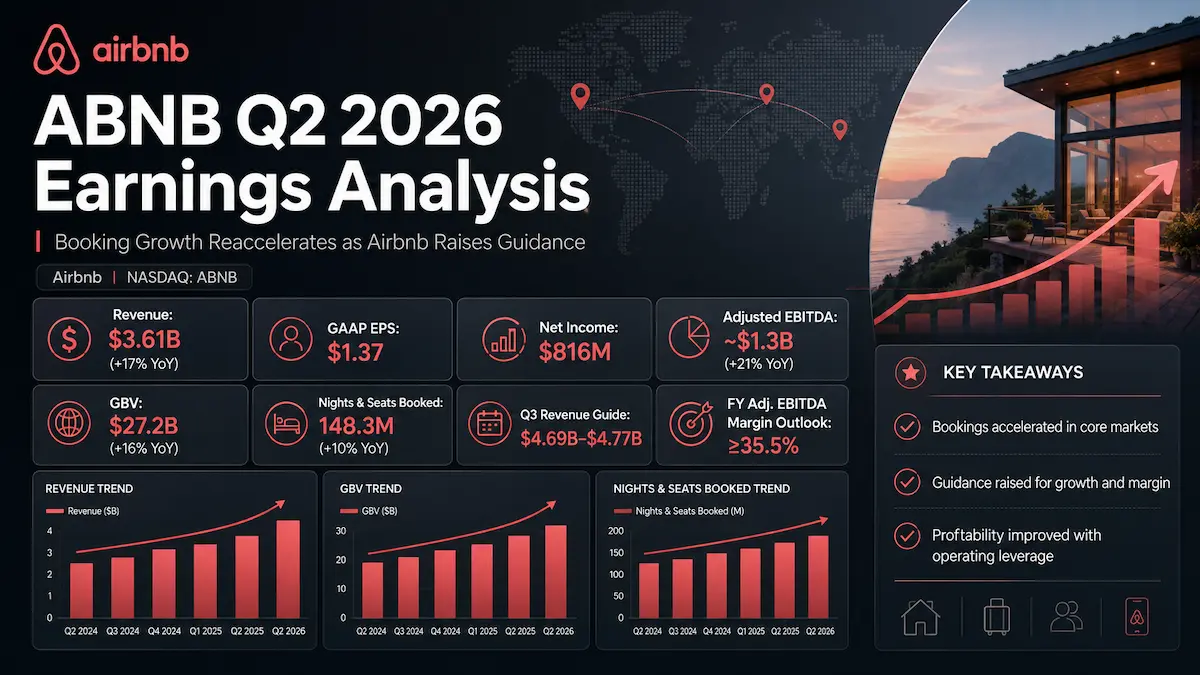
- Airbnb reported Q2 2026 revenue of $3.61 billion, up 17% year over year, ahead of the roughly $3.57 billion to $3.58 billion Wall Street consensus range. GAAP diluted EPS was $1.37 versus $1.03 a year ago and approximately $1.26 expected.
- Operational momentum was stronger than the small top-line beat suggests: Nights and Seats Booked rose 10% to 148.3 million, while Gross Booking Value increased 16% to $27.2 billion. Both exceeded consensus, and booking growth accelerated in several large core markets.
- Profit quality improved. GAAP net income reached $816 million, while adjusted EBITDA rose 21% to about $1.3 billion, ahead of consensus. The company also raised its full-year adjusted EBITDA margin outlook to at least 35.5%.
- Guidance was the biggest positive surprise. Q3 revenue is expected at $4.69 billion to $4.77 billion, or 15% to 17% growth, versus Wall Street expectations around $4.61 billion. Full-year revenue growth was raised to at least the mid-teens.
- The strategic debate is shifting from whether Airbnb can reaccelerate its core marketplace to whether faster product shipping, hotels, services and selective M&A can extend mid-teens growth without compromising the margin structure.
1. Core Earnings Breakdown
Revenue and Profitability Analysis
Airbnb delivered a strong Q2 2026 print, but the quality of the quarter is better understood through the gap between reported revenue growth and operational activity. Revenue increased 17% year over year to $3.61 billion from roughly $3.10 billion. That reported growth rate benefited from currency relative to the prior year; management had entered the quarter expecting foreign exchange to contribute roughly three percentage points to Q2 revenue growth. For investors, the cleaner operating read-through is therefore the combination of transaction volume, booking value and geographic acceleration rather than the headline revenue percentage alone.
Nights and Seats Booked increased 10% to 148.3 million, accelerating from Q1. Gross Booking Value, or GBV, rose 16% to $27.2 billion, reflecting both higher booking volume and a moderate increase in average daily rate. The spread between 16% GBV growth and 10% Nights and Seats growth indicates that price, trip mix, geography and currency contributed meaningfully in addition to pure unit growth.
GAAP net income was $816 million, up from $642 million a year ago, while GAAP diluted EPS rose 33% to $1.37 from $1.03. Adjusted EBITDA, a non-GAAP measure, increased 21% to approximately $1.3 billion. That combination matters: revenue grew in the high teens, but adjusted EBITDA and GAAP earnings grew faster, which points to operating leverage rather than a quarter driven solely by promotional demand or lower-quality volume.
Airbnb has one operating segment and one reportable segment, so it does not disclose separate revenue or profit lines for Homes, Hotels, Services or Experiences. Assigning formal segment revenue shares to those categories would therefore be misleading. The more useful framework is to separate the accounting segment from the operating mix signals management does disclose.
- Homes remain the economic core of the platform. The important Q2 development was not just emerging-market growth; net origin nights accelerated in major core markets including the U.S., France, the U.K. and Australia. That broadening reduces the risk that recent growth is being carried only by smaller expansion markets.
- Hotels are still a small part of the platform, representing only a single-digit percentage of total nights booked, but hotel nights grew nearly three times faster than homes. The investment implication is asymmetric: hotels are not yet large enough to drive the consolidated model, but they can meaningfully improve Airbnb’s relevance for urban, short-duration and traditional accommodation use cases if supply quality and conversion continue to improve.
- Services and Experiences remain strategically important but are not separately disclosed as financial segments. Investors should therefore treat them as emerging option value rather than assign material stand-alone revenue contribution before Airbnb provides enough data to underwrite adoption, repeat usage and unit economics.
North America was another notable operating signal. Bookings in the region grew at a high-single-digit rate, the strongest growth in nearly three years. Because North America represented more than 40% of Airbnb’s 2025 revenue, reacceleration in this mature market has more earnings significance than an equivalent growth rate in a smaller geography. At the same time, Brazil and India continued to support expansion-market growth, while management noted recovery in Middle East demand despite disruption to long-haul travel from the regional conflict.
Expectations vs. Actual Results
- ✅ Revenue: $3.61 billion versus approximately $3.57 billion to $3.58 billion expected. The beat was roughly 1%, so the quarter was not a major revenue surprise in isolation.
- ✅ GAAP diluted EPS: $1.37 versus approximately $1.26 expected, an earnings beat of roughly 9%.
- ✅ GAAP net income: $816 million versus approximately $764 million expected.
- ✅ Adjusted EBITDA: about $1.3 billion, up 21% year over year, versus approximately $1.23 billion expected.
- ✅ Gross Booking Value: $27.2 billion versus approximately $26.45 billion expected, a beat of about 2.8%.
- ✅ Nights and Seats Booked: 148.3 million versus approximately 145.8 million expected, a beat of about 1.7%.
- GAAP operating margin: not scored against consensus. At the time of the release, the most widely cited consensus reports did not provide a consistent, directly comparable GAAP operating-margin estimate. Using an inferred or stale figure would be less reliable than the verified adjusted EBITDA comparison above.
For Q3 2026, Airbnb guided revenue to $4.69 billion to $4.77 billion, representing 15% to 17% year-over-year growth. The midpoint of $4.73 billion is about 2.6% above the roughly $4.61 billion Wall Street expectation cited immediately after the release. Management expects GBV growth in the mid-teens, driven by low-double-digit growth in Nights and Seats Booked and a moderate increase in ADR. Adjusted EBITDA is expected to increase year over year, although adjusted EBITDA margin is expected to decline slightly because of the timing of investments.
For the full year, Airbnb raised revenue growth guidance to at least the mid-teens from its prior low-to-mid-teens framework and raised adjusted EBITDA margin guidance to at least 35.5%. The wording matters. This was not simply a quarterly beat followed by unchanged expectations; the company moved both the growth floor and the profitability floor higher.
The true source of the beat was therefore broader than EPS. Revenue beat by only around 1%, but the marketplace indicators were stronger: GBV, Nights and Seats Booked and adjusted EBITDA all exceeded expectations, while Q3 revenue guidance came in above consensus and the full-year outlook improved. The market was right to focus more on the forward booking trajectory and margin durability than on the modest revenue beat itself.
The stock reaction confirms that interpretation. ABNB closed at $151.64 on August 6 before the earnings release, rose more than 10% in extended trading, and remained roughly 7% higher in August 7 premarket trading. That is a meaningful positive reaction to what superficially looks like only a small top-line beat. The disconnect is explained by the simultaneous reacceleration in core-market demand, stronger forward guidance and higher full-year margin expectations.
Earnings Call Highlights
- “We’ve delivered some of the strongest results in years.” 💡 Reading Between the Lines: Management is signaling that the current acceleration is not being framed as a one-event anomaly. The valuation implication is that investors may begin underwriting a higher medium-term growth floor if core-market booking momentum persists after major-event tailwinds normalize.
- Management said more new guests are trying Airbnb than it has seen in years. 💡 Reading Between the Lines: New-customer acquisition is strategically more important than a one-quarter ADR lift because it expands the future repeat-booking pool. The key test is whether World Cup-acquired and expansion-market users retain at attractive rates once event-driven demand fades.
- Hotel nights are growing nearly three times faster than home nights, although hotels remain only a single-digit share of total nights. 💡 Reading Between the Lines: Airbnb is using hotels to close inventory gaps rather than replace its differentiated home supply. If the category scales, the company can capture more trip occasions, but the competitive set shifts closer to Booking Holdings and Expedia, where inventory breadth and performance marketing are mature capabilities.
- Airbnb says its AI-native operating model has reduced concept-to-delivery time by as much as 60%. 💡 Reading Between the Lines: The investable AI thesis is not the label itself; it is whether faster product cycles improve conversion, support efficiency and host productivity without forcing a structurally higher cost base. If that happens, AI can support both growth and margin rather than becoming a separate spending narrative.
- Management sees substantial M&A optionality and described a long-term path from a travel marketplace toward broader living and connection use cases. 💡 Reading Between the Lines: Airbnb has strategic currency in both cash generation and equity, but investors should resist capitalizing distant platform phases before product-market fit is proven. Acquisitions can accelerate supply or capabilities, yet they also introduce integration risk, potential dilution and the danger of weakening the simplicity that made the core marketplace powerful.
2. Deep Business Insights
Hidden Metrics That Matter
Two calculated metrics help separate the operating signal from the headline revenue beat.
- Implied GBV per Night and Seat: $27.2 billion divided by 148.3 million equals approximately $183.4 in Q2 2026. Using the prior-year company-reported figures of approximately $23.45 billion of GBV and 134 million Nights and Seats Booked gives roughly $175.0. That implies an increase of about 4.8%. This is calculated from company-reported figures. The result indicates that the 16% GBV increase was not just a unit-volume story; price, mix and currency also lifted the value of each booked unit.
- GAAP net income margin: $816 million divided by $3.61 billion equals approximately 22.6%, versus $642 million divided by $3.096 billion, or approximately 20.7%, in Q2 2025. That is an improvement of roughly 190 basis points. This is calculated from company-reported figures. Because net income includes non-operating items, it should not be treated as a pure operating-margin substitute, but the direction is consistent with the stronger adjusted EBITDA result and improving earnings conversion.
One additional ratio deserves caution rather than celebration. Revenue divided by GBV was roughly 13.3% in Q2 2026. It is tempting to call this a take rate, but Airbnb recognizes revenue when a guest checks in while GBV is recorded when a booking occurs. The numerator and denominator therefore do not represent the same booking cohort. Investors should use the ratio only as a rough directional monetization check, not as a precise fee-rate measure.
Why do customers continue to choose Airbnb despite intense travel competition? The core advantage is not simply lower price. Airbnb combines differentiated home inventory with a two-sided global marketplace and a consumer brand built around discovering stays that are difficult to replicate in a standardized hotel search. Hotels can make the platform more complete, while services and experiences can increase trip relevance. The strategic opportunity is to broaden use cases without making the product feel like a generic online travel agency.
That distinction matters for hosts and supply partners as well. Airbnb can offer access to global demand across homes and increasingly adjacent accommodation categories, while the platform’s product, payments and trust infrastructure reduces the friction of matching fragmented supply with travelers. The more Airbnb expands demand without diluting host economics or search quality, the more defensible the marketplace becomes.
Industry Chain Reactions
- ✅ Benefit — Booking Holdings (BKNG): Airbnb’s Q2 confirms that global accommodation demand remains resilient, with strong booking growth across core and expansion markets. That is a positive industry read-through for Booking Holdings, particularly because the demand strength is broad rather than confined to one geography. The benefit is macro and category-level, not a direct transfer of economics from Airbnb.
- ❌ Face Pressure — Expedia Group (EXPE): Airbnb’s push into boutique hotels and a broader one-stop travel proposition increases overlap with Expedia’s hotel marketplace and Vrbo. If Airbnb can use its brand and direct customer relationships to add hotel inventory without materially increasing acquisition costs, Expedia faces more competition for both supply and traveler attention.
Valuation Framework and Key Risks
ABNB’s valuation should be anchored to the pre-earnings close of $151.64 on August 6 and the roughly 7% to 11% post-release re-rating, rather than a stale trailing multiple. The market is now discounting more than a one-quarter earnings beat. It is assigning greater probability to sustained mid-teens revenue growth, low-double-digit booking growth and a mid-30s adjusted EBITDA margin profile.
The central valuation question is therefore duration. If Nights and Seats Booked can remain around low double digits after World Cup-related demand normalizes, and if hotels plus product improvements increase conversion without requiring a step-change in marketing intensity, Airbnb can support a higher long-term earnings-growth assumption. If growth reverts toward high single digits while the company continues investing aggressively in new categories, the current re-rating would leave less room for execution error.
A practical framework is to separate the business into three valuation layers. The first is the proven core Homes marketplace, which deserves most of the present value because it already generates scale, cash and high adjusted EBITDA margins. The second is the near-term growth layer — hotels, international expansion, conversion improvements and AI-enabled product velocity — which can reasonably influence medium-term estimates if operating evidence continues to build. The third is long-dated optionality around broader living, connection and M&A. That third layer should carry a high discount rate until management demonstrates repeat usage, unit economics and capital efficiency.
Key risks remain material:
- Major-event normalization: the World Cup helped attract first-time users and supported North American demand. Investors should not annualize an event-driven acquisition spike.
- Foreign exchange: reported revenue growth can differ meaningfully from underlying operating growth, so constant-currency trends and booking volume remain important.
- Geopolitical disruption: conflict in the Middle East has already affected long-haul travel patterns and can influence both demand and travel costs.
- Regulation: short-term rental restrictions, local taxes and housing-policy interventions can constrain supply or raise compliance costs in important cities.
- Product-mix execution: hotels and services can broaden the addressable market, but they may also increase competitive intensity and operational complexity.
- Margin reinvestment: Q3 adjusted EBITDA margin is expected to decline slightly year over year because of investment timing. The key risk is that temporary reinvestment becomes structurally higher spending before new categories generate adequate returns.
- M&A discipline: management’s willingness to consider acquisitions expands strategic options, but overpaying, issuing equity at the wrong point in the cycle or integrating businesses poorly could dilute per-share value.
The Q2 report improves the fundamental setup, but the investment case now carries a higher bar. The next phase of upside requires proof that reacceleration persists beyond event demand and that Airbnb can convert broader product ambition into incremental bookings and profit rather than simply a larger cost base.
3. Key FAQs
Did ABNB beat Q2 2026 earnings expectations?
Yes. Airbnb reported Q2 2026 revenue of $3.61 billion versus roughly $3.57 billion to $3.58 billion expected, and GAAP diluted EPS of $1.37 versus approximately $1.26 expected. GBV, Nights and Seats Booked, net income and adjusted EBITDA also exceeded widely cited consensus estimates. The more important positive surprise was the stronger Q3 outlook and higher full-year guidance.
What is Airbnb’s Q3 2026 revenue guidance after the Q2 earnings report?
Airbnb expects Q3 2026 revenue of $4.69 billion to $4.77 billion, representing 15% to 17% year-over-year growth. The $4.73 billion midpoint was above the roughly $4.61 billion Wall Street expectation reported immediately after Q2 earnings. Management also expects mid-teens GBV growth and low-double-digit growth in Nights and Seats Booked.
Why did ABNB stock rise after Q2 2026 earnings?
The stock rose because the report changed forward expectations, not because the revenue beat was unusually large. Booking growth accelerated, major core markets improved, Q3 revenue guidance exceeded consensus, and Airbnb raised both its full-year revenue-growth outlook and adjusted EBITDA margin floor. Shares rose more than 10% in extended trading after the August 6 report and were still roughly 7% higher in August 7 premarket trading.
Official company source hub: Airbnb Investor Relations. For historical segment-reporting definitions and GAAP/non-GAAP methodology, see Airbnb’s official filings through the U.S. Securities and Exchange Commission.
Disclaimer: This article/chart is for educational and informational purposes only and does not constitute investment advice of any kind. Past performance is not indicative of future results. Investors should independently evaluate their own risks.