

Key Takeaways
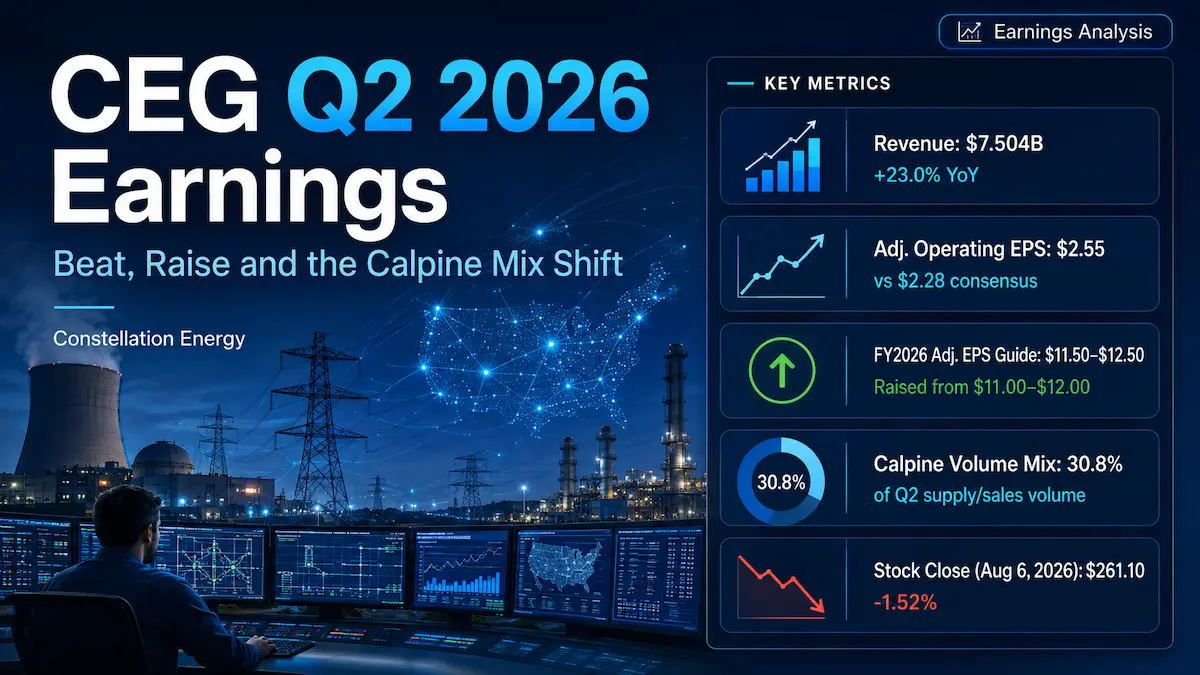
- Constellation Energy reported Q2 2026 adjusted operating EPS of $2.55, up 33.5% year over year and 11.8% above the $2.28 LSEG consensus cited by Reuters. Full-year adjusted operating EPS guidance was raised to $11.50-$12.50 from $11.00-$12.00.
- Revenue rose 23.0% to $7.504 billion, but the quarter was not a clean top-line beat: Investor’s Business Daily, citing FactSet, reported that revenue was about 3% below analyst expectations.
- GAAP and adjusted earnings moved in opposite directions. GAAP EPS fell 46.8% to $1.42 and GAAP operating margin fell to 7.7% from 15.6%, while adjusted operating EPS increased. Investors should therefore separate the underlying commercial and Calpine contribution from fair-value, acquisition-accounting and integration effects.
- Calpine is already a material part of the earnings architecture: 27,642 GWh of Q2 supply/sales volume came from Calpine, equal to 30.8% of total company supply/sales volume, calculated from company-reported figures.
- The stock initially traded higher after the release but closed August 6 down 1.52% at $261.10. At that price, CEG traded at roughly 21.8 times the midpoint of revised 2026 adjusted EPS guidance, leaving less room for delays in data-center load, nuclear contracting or regulatory execution.
1. Core Earnings Breakdown
Revenue and Profitability Analysis
Constellation Energy’s Q2 2026 operating revenue increased to $7.504 billion from $6.101 billion a year earlier, a reported growth rate of 23.0%. The headline growth rate, however, should not be interpreted as an organic growth rate because the January 2026 acquisition of Calpine materially changed the consolidated revenue and generation base. The more useful analytical question is whether the enlarged portfolio is producing higher-quality earnings and whether the Calpine contribution is being converted into durable commercial margin rather than simply adding volume.
On profitability, the quarter was unusually bifurcated. GAAP net income attributable to common shareholders fell to $513 million from $839 million, and GAAP EPS fell to $1.42 from $2.67. GAAP operating income fell to $580 million from $951 million even as revenue grew, which reduced the GAAP operating margin to 7.7% from 15.6%, a decline of approximately 786 basis points. In contrast, adjusted operating earnings rose to $920 million from $599 million and adjusted operating EPS increased to $2.55 from $1.91.
The gap between GAAP and adjusted results is economically important. The Q2 reconciliation included a $340 million after-tax adjustment for unrealized fair-value losses, a $149 million adjustment for amortization of acquired commodity contracts and $84 million of Calpine merger and integration costs, partly offset by a $221 million adjustment related to decommissioning activities. These are not all equivalent in quality. Acquisition integration costs and purchase-accounting amortization are directly tied to the Calpine transaction, while hedge and fair-value movements are a recurring source of GAAP volatility for a merchant generation and commercial power platform. The adjusted number is therefore more useful for evaluating operating performance, but investors should not treat every reconciliation item as economically irrelevant.
Constellation does not disclose Q2 revenue by nuclear, natural-gas and purchased-power segment in a way that supports a clean revenue-mix bridge. Company-reported supply/sales volume is therefore the more defensible operating-mix proxy:
- Nuclear generation was 44,160 GWh versus 45,170 GWh, down 2.2% year over year, and represented 49.2% of total Q2 supply/sales volume. The decline reflects a heavier planned refueling schedule rather than a deterioration in unplanned reliability: planned refueling outage days rose to 86 from 41, while non-refueling outage days fell to 20 from 22. Investment implication: the lower nuclear output is more timing-related than structural, but it shows that outage cadence can still create meaningful quarterly noise even for a high-quality fleet.
- Natural gas, oil and renewables generation increased to 30,649 GWh from 5,560 GWh, a 451% reported increase dominated by the addition of Calpine. Excluding the 24,914 GWh of Calpine generation, the legacy portfolio produced 5,735 GWh, up about 3.1% from the prior-year period. Investment implication: reported growth is acquisition-driven, but the acquired gas fleet materially broadens Constellation’s ability to monetize power scarcity and serve load in markets such as ERCOT.
- Purchased power was 15,006 GWh versus 14,911 GWh, up 0.6%, and represented 16.7% of total supply/sales volume. Investment implication: the company is not merely a generation owner; its commercial platform can source power externally and optimize around a much larger physical portfolio, which is relevant to customer retention, risk management and margin capture.
Operationally, Constellation’s nuclear fleet produced 44,160 GWh with a 93.0% capacity factor excluding Salem and South Texas Project, versus 94.8% a year earlier. Management’s presentation quantified that additional planned outage days reduced the Q2 capacity factor by about 1.8 percentage points versus Q2 2025. For the natural-gas, oil and pumped-storage hydro fleet, the company reported a 6.2% equivalent forced outage factor, while renewable energy capture was 96.0% versus 96.1% a year earlier. These metrics support the view that the earnings beat was driven more by portfolio scale, capacity revenue and commercial execution than by an unusually favorable generation-availability quarter.
Expectations vs. Actual Results
- Adjusted operating EPS: $2.55 actual versus $2.28 LSEG consensus cited by Reuters — ✅ beat by $0.27, or 11.8%.
- Revenue: $7.504 billion actual — ❌ approximately 3% below the FactSet analyst expectation described by Investor’s Business Daily. Public data vendors published different pre-release revenue estimates, so presenting one universal consensus number would create false precision.
- GAAP operating margin: 7.7% actual versus 15.6% in Q2 2025. No sufficiently reliable public Q2 operating-margin consensus was identified, so a beat/miss label would not be justified.
- Full-year 2026 adjusted operating EPS guidance: $11.50-$12.50 versus the prior $11.00-$12.00 range — ✅ raised by $0.50 at both ends. The midpoint increased from $11.50 to $12.00, or 4.3%.
- Next-quarter guidance: Constellation did not issue a standalone Q3 2026 revenue or EPS guidance range in the Q2 release or presentation. The actionable guidance change was the full-year EPS increase.
The real source of the EPS beat was not a single commodity-price tailwind. Management identified contribution from Calpine, higher capacity revenue, portfolio optimization and higher realized customer margins as positive year-over-year drivers. These were partly offset by lower revenue recognition from banked Illinois zero-emission credits and the heavier nuclear refueling schedule. That mix matters because commercial execution and capacity revenue are more repeatable within the company’s current portfolio than a one-quarter mark-to-market swing.
The market also appeared to distinguish profit quality from headline EPS. Reuters reported that shares were up about 1.3% in morning trading after the results, but CEG ultimately closed August 6 at $261.10, down 1.52% for the day. That reversal is more informative than calling the move a generic “sell the news” reaction. First, revenue missed the FactSet-based expectation even though EPS beat. Second, Reuters reported that executives said much of the anticipated data-center load in Texas remains under construction and is not yet connected to the grid. Third, after years of multiple expansion around AI-driven power demand, the stock still embeds substantial growth expectations despite being well below its prior 52-week high.
For CEG, the market is likely to care less about one quarter of reported revenue and more about four items: sustainable commercial margin, the conversion of large-load demand into binding long-duration contracts, regulatory timing around interconnection and Crane, and the extent to which Calpine lifts earnings without weakening balance-sheet quality. Q2 was constructive on the first and fourth items, but the Texas load-timing commentary explains why an EPS beat alone did not produce a lasting positive stock reaction.
Earnings Call Highlights
“Strategic summary: Commercial execution was a primary driver of the guidance raise, with higher realized customer margins and successful portfolio optimization outperforming the original plan.”
💡 Reading Between the Lines: The earnings model is becoming less dependent on simply forecasting wholesale power prices. If the enlarged customer-facing platform can consistently monetize volatility and cross-sell around the combined generation fleet, investors can justify a higher-quality earnings multiple than they would assign to a pure merchant generator.
“Strategic summary: Management said much of the anticipated data-center load in Texas is still under construction and has not yet reached the grid.”
💡 Reading Between the Lines: The AI-power demand thesis remains intact, but timing risk is real. Investors should distinguish signed load and contracted economics from announced projects whose megawatts have not yet translated into realized electricity demand.
“Strategic summary: Constellation secured roughly 920 MW of new long-term premium nuclear contracts with investment-grade customers, with an average contract duration of 18.5 years.”
💡 Reading Between the Lines: Long-duration contracting is converting nuclear scarcity into forward earnings visibility and can reduce reliance on spot power prices. The fact that one customer commitment enables a 30 MW Dresden uprate also shows how customer contracts can finance incremental nuclear output rather than merely reprice existing megawatt-hours.
“Strategic summary: The company expects greater PJM regulatory clarity during the second half of 2026 and argues that existing generation can provide speed to power as large-load interconnection rules evolve.”
💡 Reading Between the Lines: Existing, dispatchable assets may gain strategic value if interconnection reform favors solutions that can serve large loads faster than greenfield generation. That would support the economic value of Constellation’s installed nuclear and gas fleet, but the thesis still depends on FERC and PJM decisions that were not fully resolved at quarter-end.
“Strategic summary: Crane Clean Energy Center advanced through key FERC and NRC approvals, while management continued to target a 2027 restart.”
💡 Reading Between the Lines: Crane remains one of the clearest examples of converting an existing nuclear asset into a long-duration data-center power contract. Its valuation contribution should still be probability-weighted because regulatory milestones have improved the path, but schedule execution remains a material risk.
2. Deep Business Insights
Hidden Metrics That Matter
Metric 1 — Calpine’s share of the operating mix: 27,642 GWh of Calpine supply/sales volume divided by 89,815 GWh of total Q2 supply/sales volume equals 30.8%, calculated from company-reported figures. This is a more useful measure of the transformation than simply saying the acquisition “added gas.” Roughly three out of every ten Q2 megawatt-hours in the company’s supply/sales mix came from Calpine. The acquisition has therefore already changed Constellation’s exposure to ERCOT, natural-gas generation and commercial optimization enough that historical nuclear-only valuation shortcuts are less useful.
Metric 2 — How much of the guidance raise can buybacks explain? Initial 2026 guidance assumed 361 million average diluted shares; revised guidance assumes 357 million. Holding earnings constant, the mechanical EPS uplift from that share reduction is approximately 361 ÷ 357 – 1 = 1.1%, calculated from company-reported figures. The guidance midpoint rose from $11.50 to $12.00, or 4.3%. This does not provide a perfect decomposition because the underlying net-income forecast also changed, but it demonstrates that share repurchases alone cannot explain the full midpoint increase. Commercial outperformance and portfolio economics are doing meaningful work.
There is also a capital-recycling signal in the Brazos Valley Energy Center divestiture. The Q2 presentation states that the pending $860 million sale equates to roughly $1,419/kW, versus a $960/kW implied Calpine purchase price. The simple ratio, $1,419 ÷ $960 – 1, is approximately 47.8%, calculated from company-reported figures. Plant-level assets are not perfectly comparable, and the sale remains subject to regulatory approval, but the premium suggests that required divestitures have not automatically translated into value destruction.
Why do customers choose Constellation? The differentiation is the combination of physical scale, product breadth and contractability. A customer seeking 24/7 reliable power can access nuclear, gas, geothermal, renewables and purchased power through one commercial platform rather than negotiating with a single-asset developer. For large corporate and data-center customers, that matters because the problem is not merely buying a low headline power price; it is securing reliability, duration, clean-energy attributes, congestion and basis management, and a credible path to incremental capacity. The 920 MW of new nuclear PPAs with investment-grade counterparties is evidence that customers are willing to commit for 15-20 years to obtain those attributes.
Industry Chain Reactions
- ✅ Benefit — Vistra Corp. (NYSE: VST): Constellation’s higher capacity revenue, long-duration premium nuclear contracts and stronger commercial margins reinforce the broader thesis that scarce, dispatchable U.S. power assets can capture more value from data-center and electrification demand. Vistra operates a similarly integrated generation-and-retail model, so CEG’s contracting economics are a constructive read-through for the asset class even though the two companies compete for customers.
- ❌ Face Pressure — Bloom Energy Corp. (NYSE: BE), conditionally: Constellation argues that existing grid generation can provide “speed to power” as large-load interconnection rules become clearer. If PJM reforms allow existing nuclear and gas assets to serve new large loads faster, some of the scarcity premium attached to behind-the-meter generation solutions could narrow. This is not a blanket bearish read-through for Bloom because grid delays can also increase demand for on-site power; the pressure case depends on interconnection reform actually shortening utility-scale timelines.
Valuation Framework and Key Risks
CEG closed August 6, 2026 at $261.10. Against the revised full-year adjusted operating EPS range of $11.50-$12.50, that implies approximately 22.7 times the low end, 21.8 times the $12.00 midpoint and 20.9 times the high end. The stock therefore is not being valued like a conventional regulated utility. The multiple embeds expectations that Constellation can compound earnings through premium nuclear contracting, Calpine synergies and commercial margins, higher capacity revenue, nuclear uprates and restarts, and disciplined capital allocation.
The strongest argument for the multiple is duration. The new nuclear contracts average 18.5 years, and management says roughly 30% of expected baseload clean generation megawatt-hours will be under long-term agreement by 2032. The company also presents a 2029 base EPS framework of $11.40-$11.90 before several optional upside levers, with a stated ambition for 20%+ base EPS growth from 2026 through 2029 under its framework. If more generation moves from merchant exposure into premium long-duration contracts, earnings visibility can improve even if reported GAAP results remain volatile.
The risk is that the valuation can compress before the earnings arrive. The most important risks are:
- Data-center timing risk: Texas load is still being built, so announced demand can lag contracted or realized megawatt-hours.
- Regulatory and interconnection risk: PJM and FERC decisions can change the timing and economics of serving large loads, and Crane still requires execution through restart.
- Calpine integration risk: Q2 adjusted earnings benefited from Calpine, but the acquisition also increased interest expense, depreciation, O&M, purchase-accounting complexity and integration costs. Investors need evidence that the enlarged platform produces durable returns above its cost of capital.
- Nuclear outage and execution risk: planned refueling days were materially higher in Q2, and future uprates or restarts require disciplined outage execution.
- Commercial-margin normalization: management is benefiting from higher realized customer margins and successful portfolio optimization. If volatility falls or competitive intensity rises, those margins may not stay above plan indefinitely.
- GAAP volatility and hedge accounting: fair-value movements can create a wide gap between GAAP and adjusted earnings. The market may focus on adjusted earnings for valuation, but cash collateral, hedge effectiveness and balance-sheet liquidity still matter economically.
- Capital-allocation risk: approximately $2.2 billion had been deployed year to date for share repurchases in the Q2 presentation, with roughly $2.8 billion of authorization remaining. Buybacks create value only when the repurchase price is below the company’s long-term intrinsic value and do not substitute for operating growth.
At roughly 21.8 times the revised 2026 midpoint, the valuation debate is therefore not simply whether CEG is “expensive” or “cheap.” The key question is what proportion of the current multiple should be assigned to already-contracted earnings versus optionality that still requires customer load, regulatory approvals and construction milestones. Q2 improved confidence in the contracted and commercial pieces of the story, but the same-day share-price reversal shows that investors are still discounting the timing of the optionality.
3. Key FAQs
Did CEG beat Q2 2026 earnings expectations?
Yes on adjusted EPS, but not on every headline metric. Constellation reported Q2 2026 adjusted operating EPS of $2.55 versus the $2.28 LSEG consensus cited by Reuters, an 11.8% beat. Revenue was $7.504 billion, up 23.0% year over year, but Investor’s Business Daily reported that the figure was about 3% below FactSet analyst expectations. GAAP EPS was $1.42 versus $2.67 a year earlier, so the quarter should be described as an adjusted-EPS beat with a modest revenue miss and a large GAAP-to-adjusted reconciliation.
Why did CEG stock fall after strong Q2 2026 earnings?
The stock reaction suggests investors looked beyond the EPS headline. Reuters reported a positive morning reaction, but CEG ended August 6 down 1.52% at $261.10. Potential explanations supported by the disclosed information include the revenue miss, a demanding valuation, and management’s reminder that much of the anticipated Texas data-center load remains under construction and is not yet on the grid. The result was therefore less a simple “sell the news” event and more a debate over how quickly AI-driven power demand converts into contracted and realized earnings.
What is CEG’s 2026 earnings guidance after Q2 and what valuation does it imply?
Constellation raised full-year 2026 adjusted operating EPS guidance to $11.50-$12.50 from $11.00-$12.00. At the August 6 closing price of $261.10, the stock traded at about 21.8 times the $12.00 midpoint. That multiple assumes investors continue to award value for Calpine integration, premium nuclear PPAs, commercial-margin execution, capacity revenue and future growth projects. It also means delays in large-load demand, Crane, interconnection reform or new contracting can have a larger valuation impact than they would at a lower multiple.
Primary source: Constellation Energy Investor Relations — Events & Presentations, which hosts the Q2 2026 press release, presentation and webcast materials. Market-consensus and conference-call context were cross-checked with Reuters, and the FactSet-based revenue comparison with Investor’s Business Daily. Constellation’s official IR page provides a webcast replay but does not publish an indexed verbatim Q2 2026 call transcript; the call highlights above are therefore limited to verifiable management strategic summaries rather than unattributed transcript quotations.
Disclaimer: This article/chart is for educational and informational purposes only and does not constitute investment advice of any kind. Past performance is not indicative of future results. Investors should independently evaluate their own risks.