Key Takeaways
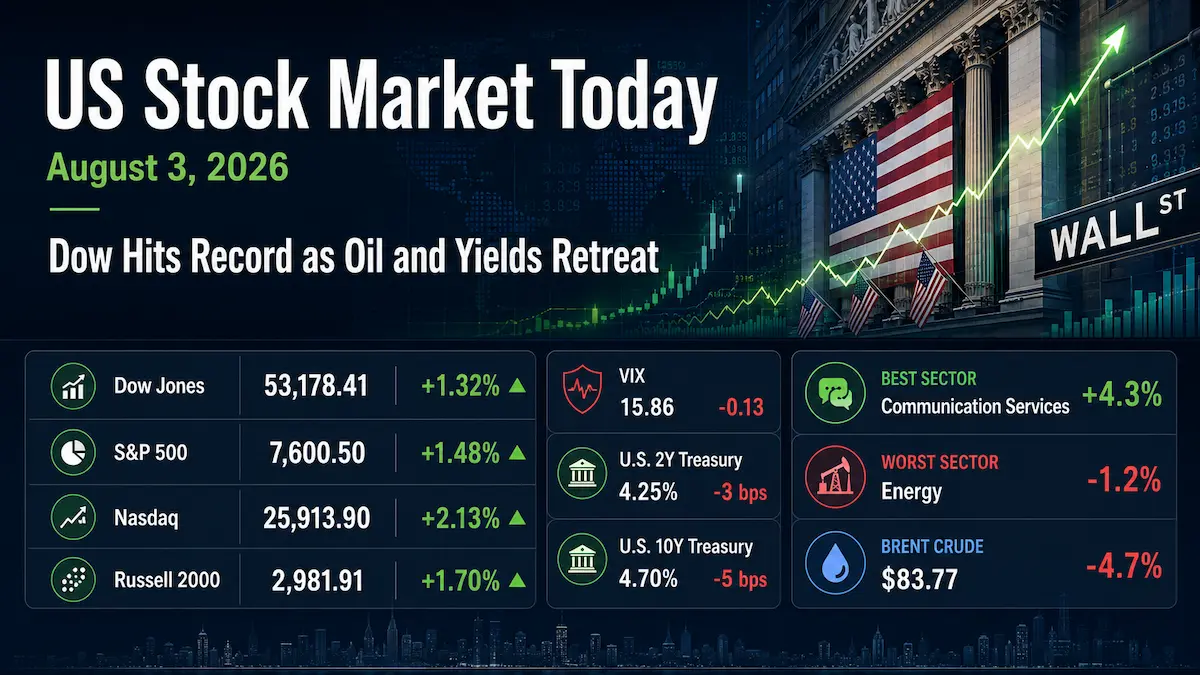
- The Dow Jones Industrial Average gained 693.38 points, or 1.32%, to a record 53,178.41. The S&P 500 rose 1.48% to 7,600.50, the Nasdaq Composite advanced 2.13% to 25,913.90, and the Russell 2000 added 1.7% to 2,981.91.
- Signs of renewed U.S.-Iran diplomacy reduced the market’s near-term energy-risk premium. Brent crude fell 4.7% to $83.77 a barrel, helping long-duration growth shares while pressuring energy stocks.
- Communication services led the S&P 500 with a 4.3% gain, while energy was the weakest sector with a 1.2% decline. Amazon’s 4.6% advance reinforced mega-cap leadership.
- Market breadth was constructive, but concentration remained important: the S&P 500 outpaced the 0.98% gain in the Invesco S&P 500 Equal Weight ETF, a commonly used equal-weight proxy.
- The Cboe VIX closed at 15.86, down 0.13 point, while Treasury yields eased. The next tests are the June JOLTS report on August 4 and the July employment report on August 7.
U.S. equities opened August with a broad but leadership-heavy risk-on session. Falling oil prices and lower Treasury yields relieved two of the market’s most immediate valuation constraints, while strong corporate earnings kept capital concentrated in companies with visible growth and operating leverage. All index and stock moves in this article refer to the regular trading session that ended at 4:00 p.m. Eastern Time. No after-hours price changes are included.
1. Market Capital Flows and Sector Rotation
Communication services was the best-performing S&P 500 sector, rising 4.3%, as investors rotated back into large digital-platform and advertising franchises. Energy fell 1.2%, the weakest sector, after the sharp retreat in crude reduced near-term earnings sensitivity for producers and refiners. Technology and consumer discretionary stocks also benefited from the combination of lower yields, lower fuel costs and renewed confidence in artificial-intelligence spending.
The relative performance hierarchy was favorable to growth, but the rally was not limited to mega-cap technology. The Nasdaq Composite’s 2.13% gain exceeded the Dow’s 1.32% rise, indicating stronger demand for duration-sensitive growth assets. At the same time, the Russell 2000 climbed 1.7%, showing that small-cap participation improved as financing conditions became less restrictive at the margin. Cyclicals tied to travel and lower input costs generally attracted buyers, while energy and slower-growth defensive groups lagged on a relative basis.
Market breadth supported the advance. Advancing issues outnumbered decliners by 2.62 to 1 on the New York Stock Exchange and 3.01 to 1 on Nasdaq. U.S. equity volume reached approximately 19.36 billion shares, above the 20-session average of 17.66 billion. Nevertheless, the cap-weighted S&P 500 gained 1.48%, compared with a 0.98% increase in the Invesco S&P 500 Equal Weight ETF. That gap shows that broad participation and concentrated mega-cap leadership coexisted rather than one fully replacing the other.
Institutional Flow Insight: The tape is consistent with investors reducing geopolitical and inflation hedges while rebuilding exposure to profitable growth and selected cyclicals. Lower oil and bond yields improved the relative valuation of long-duration cash flows, while resilient earnings visibility supported large platforms. Small-cap strength suggests that risk budgets expanded beyond the largest stocks, but the equal-weight lag indicates that benchmark performance still depended materially on index heavyweights. Month-start rebalancing may have amplified these flows, although public closing data cannot confirm the size or direction of institutional rebalancing activity.
2. Decoding the Biggest Market Movers
Amazon.com (AMZN)
Amazon closed 4.6% higher at $284.02, an all-time closing high, and its market capitalization moved above $3 trillion for the first time. The August 3 move was a continuation of the regular-session repricing that followed the company’s July 30 earnings release, not an after-hours reaction to a new Monday announcement.
Amazon’s official second-quarter release showed net sales of $200.6 billion, up 20% year over year, and operating income of $27.5 billion, up 43%. The consolidated operating margin expanded to 13.7% from 11.4% a year earlier. AWS sales rose 37% to $42.2 billion, while AWS operating income reached $16.6 billion and its operating margin increased to 39.4%. Reported diluted EPS was $5.75, but investors should separate operating performance from the $53.4 billion of non-operating pre-tax income recorded primarily from Amazon’s Anthropic investment.
For the third quarter, Amazon guided to net sales of $197 billion to $202 billion and operating income of $22.5 billion to $26.5 billion. Management also indicated on the earnings call that the 2026 capital investment plan would rise to approximately $220 billion, largely to support cloud and artificial-intelligence capacity. The market’s willingness to absorb that spending matters beyond Amazon: it supports valuations across cloud infrastructure, data-center equipment, semiconductors and digital advertising. The risk is that the stock’s rapid multiple expansion now requires sustained AWS growth, high utilization and disciplined conversion of infrastructure spending into future cash flow.
Marriott International (MAR)
Marriott closed 7.0% lower after its third-quarter profit outlook fell short of market expectations, making it a notable countertrend loser in an otherwise strong session. The company’s official release reported second-quarter diluted EPS of $2.90 and adjusted diluted EPS of $3.19. Worldwide RevPAR increased 3.4%, with U.S. and Canada RevPAR up 5.0% and international RevPAR down 0.5%. Adjusted EBITDA was $1.592 billion.
The market focused on the weaker near-term mix rather than the headline earnings beat. Marriott projected third-quarter adjusted EPS of $2.74 to $2.82 and said 2026 net room growth would likely finish at the low end of its 4.5% to 5.0% range. Middle East RevPAR fell 43%, reflecting disrupted travel flows, while the company raised its full-year worldwide RevPAR growth outlook to 3.0% to 3.5% from 2.0% to 3.0%.
The read-through for lodging was mixed. U.S. demand and luxury travel remained resilient, but globally diversified hotel operators still carry meaningful geographic and geopolitical earnings risk. Marriott’s decline, alongside weaker trading in major lodging peers, showed that investors were unwilling to capitalize strong domestic demand at the same valuation when regional disruption, development delays and currency-sensitive fee income reduced near-term visibility.
3. Macro Indicators and Market Outlook
The Cboe VIX closed at 15.86, down 0.13 point, or 0.81%. The direction was consistent with the equity rally, but the decline was modest relative to the size of the gains in the Nasdaq and S&P 500. That divergence suggests investors reduced immediate downside hedges without fully abandoning protection against geopolitical headlines, labor-market data and a possible renewed rise in bond yields.
U.S. Treasury end-of-day constant-maturity readings showed the 2-year yield at 4.25%, down approximately 3 basis points from the previous session, and the 10-year yield at 4.70%, down approximately 5 basis points. The 10-year-minus-2-year spread narrowed by about 2 basis points to a positive 45 basis points. The move lowered the discount rate applied to growth equities and helped explain the strong performance of communication services and technology.
The bond rally should not be read as confirmation of a Federal Reserve easing cycle. Lower oil prices reduced the immediate inflation-risk premium, while geopolitical relief and portfolio demand supported duration. However, both yields remained elevated, the curve stayed positively sloped, and interest-rate futures cited during the session still assigned a meaningful probability to a September rate increase. The market is therefore repricing the balance of inflation, growth and policy risks rather than delivering a definitive policy forecast.
Brent crude’s 4.7% decline to $83.77 provided the clearest cross-asset explanation for the day’s rotation. Lower oil reduced the near-term threat to consumer purchasing power and corporate input costs, benefiting transportation, travel and long-duration equities. The same move weakened the earnings impulse for energy producers. Because the decline depended partly on diplomatic expectations, an adverse geopolitical headline could reverse both the oil move and the equity-sector leadership quickly.
Upcoming Economic Data & Catalysts:
- Job Openings and Labor Turnover Survey for June 2026 (Release date: August 4, 2026): Investors will focus on job openings, quits and hiring rates for evidence that labor demand is cooling or remaining tight. A material surprise could alter front-end Treasury yields and expectations for Federal Reserve policy.
- Employment Situation for July 2026 (Release date: August 7, 2026): Payroll growth, unemployment and wage inflation will be central to the market’s assessment of economic resilience, inflation persistence and the sustainability of current equity valuations.
Market Insights:
The August 3 rally was broad enough to qualify as a genuine improvement in risk appetite, but it was still amplified by a small group of index-heavy growth stocks. Confirmation would require continued strength in equal-weight benchmarks, stable small-cap participation and market breadth that remains positive if Treasury yields stop falling. The main reversal risks are a renewed oil spike, a sharp rise in the 10-year yield, weaker breadth beneath the indexes, downward earnings revisions, a policy surprise or a VIX break back above its recent range.
Trading & Investment Strategy:
Investors should avoid treating one relief rally as proof that geopolitical or inflation risks have disappeared. Position sizes should reflect the elevated sensitivity of equity multiples to oil and long-term yields. Staggered entries are preferable to chasing extended gaps, especially in mega-cap stocks that have already repriced sharply after earnings. A balanced approach can combine profitable growth companies with strong cash-flow visibility, selective lower-energy-cost beneficiaries and limited exposure to cyclicals whose earnings remain vulnerable to a global slowdown. Stop-loss and review levels should be tied to the investment thesis, expected volatility and portfolio risk budget rather than an arbitrary percentage.
4. Key FAQs About the US Stock Market Today
Why did the US stock market move on August 3, 2026?
Stocks rose because signs of U.S.-Iran diplomatic progress drove oil and Treasury yields lower, easing inflation and valuation pressure. Strong earnings momentum and continued demand for large technology platforms added to the move, while positive breadth showed that risk appetite extended beyond a single stock.
Which sectors performed best and worst in the US stock market on August 3, 2026?
Communication services was the best S&P 500 sector with a 4.3% gain, supported by large digital-platform stocks. Energy was the worst sector, falling 1.2%, as Brent crude dropped 4.7% and investors reduced exposure to the recent oil-price surge.
What should investors watch after the US stock market close on August 3, 2026?
The immediate focus is the June JOLTS release on August 4, followed by the July employment report on August 7. Investors should also monitor whether the S&P 500 can hold above 7,600, whether equal-weight and small-cap indexes continue to confirm the rally, and whether the 10-year Treasury yield or oil prices rebound enough to pressure growth-stock valuations.
Disclaimer: This article is intended solely for the exchange of investment ideas and does not constitute investment advice of any kind.