Key Takeaways
- STMicroelectronics makes money primarily from semiconductor product sales, with profitability driven by shipment volume, average selling prices, product mix, factory utilization, manufacturing yields, and the reuse of proprietary technology platforms across many customers and applications.
- The company’s most defensible economic moats are intangible assets and switching costs: proprietary process technologies, system-level know-how, automotive and industrial qualification experience, the STM32 software ecosystem, and customer-specific design-ins make replacement costly even though the semiconductor market remains intensely competitive.
- ST’s IDM model is an advantage only when utilization and technology differentiation are high. It gives ST control over process development, wafer fabrication, packaging, testing, and supply resilience, but the same fixed-cost structure can compress margins sharply when demand falls or new fabs ramp ahead of revenue.
- The most visible 2026-2028 catalysts are Cloud AI infrastructure, LEO satellite communications, intelligent sensing and Physical AI, and a manufacturing-footprint redesign intended to migrate more production to 300mm silicon and 200mm silicon carbide while delivering high triple-digit millions of dollars in annual savings exiting 2027.
- Key risks remain semiconductor cyclicality, pricing pressure, underutilized capacity, execution on advanced-fab ramps, customer concentration, program concentration in emerging markets such as AI infrastructure and LEO, acquisition integration, and geopolitical fragmentation of semiconductor supply chains.
1. Business Model Breakdown
What STMicroelectronics actually sells
The STMicroelectronics business model is hardware-led. Revenue is generated mainly by selling semiconductors to original equipment manufacturers and through distributors, not by charging recurring software fees. In 2025, 72% of net revenue came through OEM channels and 28% through distribution. The commercial model therefore depends on winning sockets in customer designs, moving those designs into production, and then supplying qualified parts over the life of the end product.
That revenue base is broad by semiconductor standards. In 2025, ST generated $11.80 billion of net revenue. Its Analog products, MEMS and Sensors segment produced $5.09 billion; Power and Discrete generated $1.69 billion; Embedded Processing generated $3.58 billion; and RF & Optical Communications generated $1.44 billion. Viewed by end market, Automotive represented about 39% of 2025 revenue, Personal Electronics about 25%, Industrial about 21%, and Communications Equipment and Computer Peripherals about 15%.
This diversification is economically useful because ST can reuse technologies across end markets. A power-conversion technology developed for automotive electrification can also address factory automation or AI data centers. A MEMS platform can move from smartphones into cars, industrial condition monitoring, robotics, or healthcare. An MCU architecture can serve appliances, industrial controls, connectivity infrastructure, and edge-AI devices. The company is therefore not simply selling a catalog of unrelated components; it is attempting to amortize process R&D, IP, software tools, and manufacturing infrastructure over multiple revenue pools.
The earnings engine: volume, price, mix and utilization
The fundamental earnings equation is more cyclical than the revenue diversity might initially suggest. ST’s gross margin is highly sensitive to product mix and factory loading because the company owns substantial manufacturing capacity. In 2023, gross margin was 47.9%. It declined to 39.3% in 2024 and 33.9% in 2025 as demand weakened, price and product mix deteriorated, and unused-capacity charges rose. That is a critical point for interpreting the STMicroelectronics business model: the IDM structure can create differentiated economics at high utilization, but it also magnifies operating deleverage when factories are underloaded.
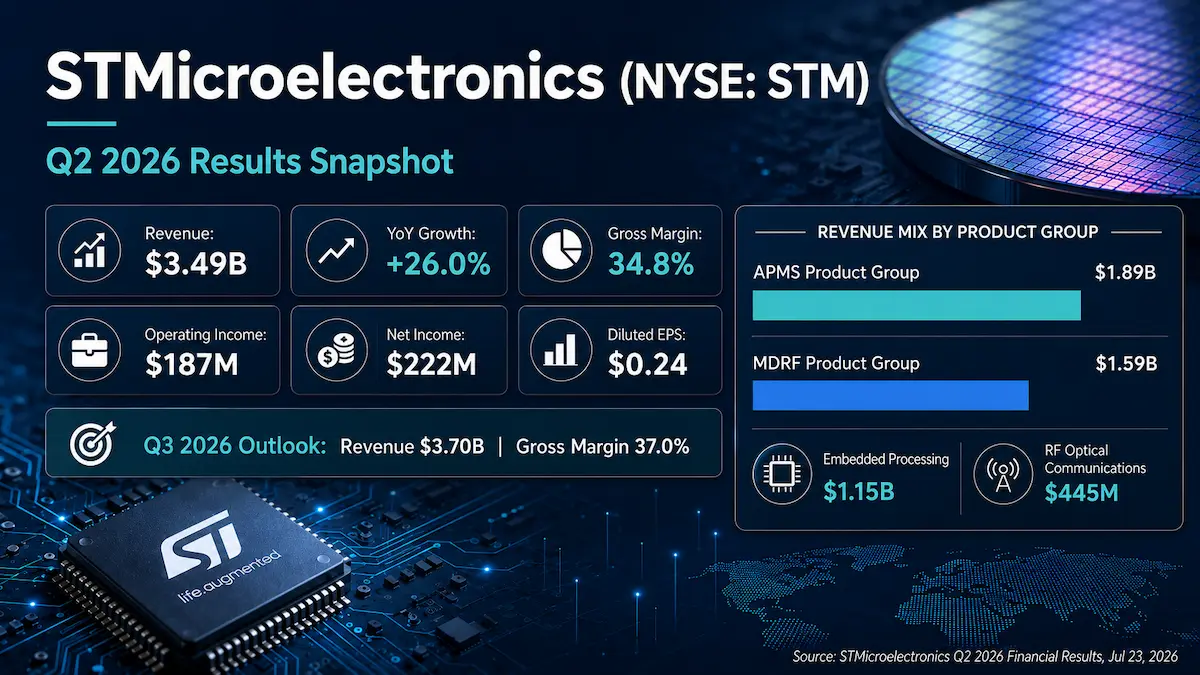
The 2026 data show the reverse mechanism beginning to emerge. In the second quarter of 2026, revenue reached $3.49 billion, up 26.0% year over year, while gross margin improved to 34.8%. Management guided to approximately $3.70 billion of third-quarter revenue and a 37.0% gross margin at the midpoint. It also said second-quarter bookings were strong across end markets, distributor inventory had moved below its standard target, and fourth-quarter revenue was expected to exceed $4 billion, with engaged AI-data-center and LEO programs contributing to the acceleration. Those figures do not prove a structural margin recovery, but they illustrate how incremental revenue can flow through a high-fixed-cost manufacturing base.
The IDM model is the operating system of the company
ST describes itself as an integrated device manufacturer, controlling process development and qualification, chip design, wafer fabrication, assembly and test, and sales and application support. The company operates a large internal manufacturing network and is reshaping that network around 300mm silicon in Crolles and Agrate and 200mm silicon carbide in Catania, while also using external partners selectively.
The economic logic is not merely supply security. For differentiated analog, power, MEMS, embedded-memory, RF, optical, silicon-photonics, FD-SOI, BCD and wide-bandgap products, process technology is often part of the product itself. Owning the process can allow ST to co-optimize transistor characteristics, embedded memory, analog behavior, packaging, reliability, thermal performance, and system cost. That is different from a fabless model in which the manufacturing node is more standardized and the main differentiation sits in digital architecture.
There is a trade-off. Internal fabs require heavy capital expenditure and carry substantial depreciation and fixed operating costs. ST planned $2.0 billion to $2.2 billion of net capital expenditure for 2026 after investing heavily in manufacturing expansion in prior years. The value of the IDM model therefore depends on disciplined capacity planning. A fab that produces differentiated products at high utilization can be a strategic asset; the same fab, loaded below plan, becomes a margin headwind.
ST’s platform strategy: from process technology to customer ecosystem
The most important strategic feature of ST is its layered platform architecture. At the bottom are proprietary and differentiated manufacturing technologies: BCD smart-power processes, FD-SOI, embedded non-volatile memory, MEMS, optical sensing, silicon photonics, SiC, GaN, BiCMOS, analog and mixed-signal processes, and specialized packaging. Above that sit reusable product franchises such as STM32 microcontrollers and microprocessors, Stellar automotive MCUs, ST25 NFC products, power semiconductors, MEMS sensors, imaging products, and custom ASICs. On top of those hardware layers sit software, reference designs, development tools, middleware, model libraries, safety support, and customer application engineering.
STM32 is the clearest example. The franchise spans a wide range of performance, low-power, wireless, security, graphics, control and AI use cases and is supported by STM32Cube, TouchGFX, edge-AI tooling, libraries, middleware and a large developer community. At its 2024 Capital Markets Day, ST reported 1.3 million unique active STM32 developers in 2024, up 30% year over year. That ecosystem does not create software subscription revenue directly. Its financial role is to lower adoption friction, shorten development time, increase the probability that engineers select STM32 for subsequent designs, and make a redesign around a competing MCU more expensive.
The same system approach is increasingly visible in AI infrastructure. ST is not trying to compete with GPU vendors. It is positioning around the supporting semiconductor layers that determine bandwidth, power efficiency and system control: silicon photonics for optical interconnect, BiCMOS and mixed-signal electronics, GaN and SiC power devices, analog ICs, power-management architectures, and embedded controllers. In March 2026, ST said its PIC100 silicon-photonics platform had entered high-volume production for leading hyperscalers, with capacity planned to increase by more than four times by 2027. It has also expanded 800 VDC data-center power architectures in collaboration with NVIDIA and entered a multi-year, multi-billion-dollar commercial engagement with Amazon Web Services covering multiple semiconductor categories.
Geographic supply architecture is becoming another platform attribute. In March 2026, ST began delivering STM32 microcontrollers fully manufactured in China for China-based customers, using the same 40nm embedded non-volatile-memory technology and compatible designs as products made outside China. This dual-supply approach can improve responsiveness and supply-chain resilience for Chinese customers while preserving a global product architecture. It is strategically useful, but it also illustrates a new cost of semiconductor globalization: technology companies increasingly need parallel supply chains to remain competitive across geopolitical blocs.
2. Deep Dive into Economic Moats
Applying Buffett-style moat logic requires separating durable structural advantages from outcomes such as scale, market share, or recent growth. ST’s broad product portfolio and large manufacturing footprint are not moats by themselves. The better test is whether a competitor must spend unusual amounts of time, capital, engineering effort, customer-validation resources, or ecosystem investment to displace ST without destroying its own economics.
Intangible Assets: Strong, and the deepest moat
ST’s strongest moat is its accumulated technology and application know-how. The company reports roughly 20,000 active and pending patents, but the defensible asset is broader than the patent count. It includes proprietary process recipes, embedded-memory integration, MEMS structures, analog and RF design libraries, power-device know-how, silicon-photonics platforms, packaging techniques, reliability data, safety expertise, and decades of customer-specific engineering experience.
These assets matter because many of ST’s target markets are not won by offering a marginally cheaper interchangeable chip. Automotive braking, airbags, powertrain electronics, industrial motor control, secure elements, optical interconnect, and space systems require reliability, qualification, long support horizons, and system-level performance. A competitor must not only build a comparable die; it must reproduce process maturity, package behavior, software enablement, quality history, application support, and a manufacturing plan that the customer is willing to qualify.
The silicon-photonics ramp is a current example. ST’s PIC100 platform is already in 300mm high-volume production, and the company says its planned capacity expansion is supported by long-term customer capacity reservations. That combination of proprietary process technology, high-volume manufacturing know-how, and customer qualification creates a more meaningful barrier than brand recognition alone. A new entrant would need both a competitive photonics platform and evidence that it can reproduce performance and yield at hyperscale volumes.
The same logic applies to FD-SOI in LEO systems, BCD smart-power technologies, MEMS, SiC and GaN. These are process-intensive domains where manufacturing technology is tightly coupled with product differentiation. The moat is therefore strongest where ST controls both the device architecture and the industrial process needed to make it reliably.
Switching Costs: Strong in embedded, automotive and mission-critical designs
ST’s second core moat is switching cost, particularly in microcontrollers, automotive electronics, industrial control, secure devices, sensors embedded in qualified systems, and customer-specific ASICs. Once an MCU becomes the control center of a product, customers build firmware, drivers, middleware, validation procedures, test infrastructure, production tooling and engineering knowledge around it. Changing suppliers may require code migration, board redesign, recertification, regression testing, electromagnetic compatibility work, functional-safety review, security revalidation, and supply-chain requalification.
STM32 amplifies those costs through software and developer familiarity. The larger the body of reusable code, examples, tools and trained engineers around an MCU family, the more expensive a platform migration becomes. In automotive, the effect can be even stronger because safety, reliability and lifecycle requirements add formal qualification hurdles. These economics help explain why semiconductor vendors compete aggressively to win designs years before the associated production revenue arrives.
Switching costs do not make ST invulnerable. Customers can dual-source where architectures permit, large OEMs can demand pricing concessions, Arm-based MCU competitors can offer familiar instruction sets, and Chinese suppliers are improving quickly in mature categories. The moat is therefore not that customers cannot switch; it is that switching often requires enough engineering time, risk and validation expense to discourage change unless the alternative delivers a meaningful economic or performance benefit.
Network Effects: Real ecosystem spillovers, but not a classic network moat
ST benefits from ecosystem scale, particularly around STM32, but this should not be confused with a strong marketplace-style network effect. One STM32 customer does not directly make another customer’s chip more useful in the way another user strengthens a payments network or social platform. The benefit is indirect: more developers encourage more third-party tools, examples, boards, middleware, training content and engineering familiarity, which in turn makes STM32 easier to adopt.
That is strategically valuable, but the better classification is an ecosystem reinforcement mechanism layered on top of switching costs and intangible assets. It can strengthen retention and developer preference without creating a winner-take-most market structure.
Cost Advantages: Conditional rather than structural
ST can achieve cost advantages in selected technologies through 300mm manufacturing, process reuse, internal packaging, yield learning, purchasing scale, and the ability to avoid paying an external foundry margin on products that fit its internal fabs. Public funding and long-duration European industrial-policy support can also reduce the effective cost of strategic manufacturing investments.
But cost is not the company’s most dependable moat. The 2024-2025 downturn demonstrated why. When utilization drops, depreciation and fixed factory costs are spread across fewer units, and unused-capacity charges can erase the theoretical cost benefits of ownership. The company’s current manufacturing program is explicitly designed to address this issue by concentrating investment in future-ready 300mm silicon and 200mm silicon-carbide assets, saturating selected mature fabs, automating more processes, and resizing the global cost base.
The conclusion is therefore asymmetric: ST’s factories can reinforce a moat when they manufacture differentiated technologies at scale, but manufacturing scale by itself is not a moat. The strongest long-term defense comes from the combination of process IP, customer qualification, software ecosystems and the ability to industrialize those technologies reliably.
3. Business Inflection Points & Future Catalysts
The defining strategic inflection: the 2012 exit from ST-Ericsson
The most important strategic turning point in modern ST history was the 2012 decision to exit ST-Ericsson and refocus the company on Sense & Power, Automotive, and Embedded Processing. At the time, ST had been competing in application processors and wireless platforms, a market characterized by rapid technology transitions, enormous R&D requirements, and powerful competitors with scale advantages in mobile computing.
The exit changed the corporate gene. Instead of trying to win primarily through merchant application processors, ST redirected resources toward categories where proprietary process technology, analog capability, embedded control, sensing, power electronics and long-lived customer relationships could matter more. The present-day portfolio of STM32, automotive MCUs, MEMS, power semiconductors, FD-SOI, SiC, GaN, imaging, RF and silicon photonics is a direct extension of that strategic choice.
The lesson is not that the 2012 plan permanently solved cyclicality. It did not. ST remains exposed to semiconductor inventory cycles, automotive demand, consumer electronics, pricing and fab utilization. What changed was the source of differentiation: from competing for mobile-compute scale to competing on specialized silicon platforms and system-level customer integration.
Catalyst 1: Cloud AI becomes a material revenue pool rather than a thematic option
Cloud AI is the most visible near-term revenue catalyst because management has put explicit numbers behind it. In June 2026, ST raised its data-center revenue ambition to about $1 billion for 2026 from a previous expectation of nicely above $500 million. Assuming current dynamics continue and existing engagements progress, management said revenue could double in 2027. The company also signed a multi-year, multi-billion-dollar commercial engagement with AWS covering multiple product categories.
The transmission mechanism is unusually broad. AI clusters need higher-speed optical interconnect, more efficient grid-to-core power delivery, analog and mixed-signal control, and embedded management. ST can therefore monetize the same infrastructure build through silicon photonics, BiCMOS and mixed-signal products, power devices, analog ICs and MCUs rather than relying on a single AI accelerator product. PIC100 is already in high-volume production, while ST’s 800 VDC portfolio addresses the power architectures being developed for increasingly dense AI systems.
Observable indicators include reported data-center revenue versus the roughly $1 billion 2026 ambition, growth in RF & Optical Communications, the pace of PIC100 capacity expansion, new customer reservation commitments, revenue contribution from power and analog content in AI infrastructure, and whether the higher-value mix translates into gross-margin improvement. Management’s expectation for revenue above $4 billion in the fourth quarter of 2026 is another near-term proof point because AI-data-center programs are expected to contribute to that acceleration.
The main execution risks are hyperscaler capital-spending volatility, customer concentration, design changes, competitive pricing, yield or packaging problems during the photonics ramp, and the possibility that capacity is expanded faster than end demand. The existence of long-term customer commitments improves visibility but does not eliminate technology or volume risk.
Catalyst 2: LEO communications creates a new high-volume specialized-silicon franchise
ST’s LEO exposure has evolved from a niche space business into a meaningful revenue stream. The company said LEO-related revenue reached approximately $600 million in 2025, up from about $175 million in 2021, and is targeting well above $3 billion of cumulative space revenue over 2026-2028. ST has supplied SpaceX for more than a decade and says it has delivered more than 7.5 billion ICs into that program.
The transmission mechanism is the industrialization of space. Reusable launch systems, mass-produced satellites, electronically steered user terminals, direct-to-cell connectivity, inter-satellite links and denser gateway infrastructure all increase semiconductor content. ST’s opportunity spans satellites, gateways and user terminals using differentiated technologies such as FD-SOI, RF, mixed-signal, embedded processing and packaging. Unlike traditional space electronics, LEO combines demanding technical requirements with consumer-like production volumes, which can favor an IDM capable of rapid, high-volume ramps.
Observable indicators include annual LEO revenue progression, delivery volumes to existing constellations, new engagements beyond the largest current customer, adoption of ST technology in user terminals and gateways, and the degree to which LEO contributes to RF & Optical Communications and embedded-processing growth. Customer diversification is particularly important because the market remains concentrated.
The principal risks are launch or deployment delays, changes in constellation economics, funding constraints at satellite operators, customer concentration, aggressive internal semiconductor development by large space platforms, export controls, and rapid product-generation cycles. ST notes that user-terminal product cycles can be around 18 months, making execution speed part of the opportunity and part of the risk.
Catalyst 3: Manufacturing reshaping converts utilization recovery into margin expansion
The third catalyst is operational rather than end-market specific. ST is reshaping its manufacturing footprint and resizing its global cost base, targeting annual savings in the high triple-digit million-dollar range exiting 2027. The plan prioritizes 300mm silicon in Agrate and Crolles, 200mm silicon carbide, greater automation and AI use, and tighter utilization of legacy manufacturing assets.
The transmission mechanism has two parts. First, migrating appropriate products to larger wafers and more advanced manufacturing infrastructure can reduce unit cost and improve productivity. Second, consolidating production and reducing the cost base can increase operating leverage when revenue recovers. Management’s April 2025 plan called for Agrate’s 300mm capacity to reach about 4,000 wafers per week by 2027 and Crolles to reach about 14,000 wafers per week by 2027, with modular expansion dependent on market conditions.
Observable indicators include unused-capacity charges, gross margin, net capital expenditure, restructuring costs, actual headcount and cost savings, fab-loading disclosures, yield progress, and the share of production moving to 300mm silicon and 200mm SiC. Q2 2026 gross margin of 34.8% and Q3 guidance of 37.0%, including lower expected unused-capacity charges at the midpoint, provide an early operating-leverage framework to monitor.
The risk is that manufacturing transformation is not self-funding. New fabs can require years of depreciation and start-up costs before reaching efficient loading. If automotive, industrial, SiC or AI demand falls short, ST could end up with structurally better factories but insufficient volume to absorb their fixed costs. Execution delays, equipment constraints, yield problems, labor restructuring, inflation and public-funding conditions can also reduce the expected savings.
Catalyst 4: Intelligent sensing and Physical AI broaden the sensor franchise
ST completed the acquisition of NXP’s MEMS sensors business in February 2026, strengthening its position in automotive safety and expanding its industrial-sensor exposure. The acquired business was expected to contribute revenue in the mid-forties millions of dollars in the first quarter of 2026. Separately, ST has stated an ambition to grow sensor revenue at a mid-teens compound annual growth rate through 2028.
The transmission mechanism is cross-platform. Physical AI systems require sensing, local compute, connectivity and actuation. ST can combine MEMS and optical sensors with STM32 and other edge processors, embedded AI software, motor control, connectivity and power devices. If robotics, industrial condition monitoring, automotive sensing and machine perception scale, the company can potentially increase both unit volume and semiconductor content per system.
Observable indicators include Analog products, MEMS and Sensors revenue growth, design-win commentary in automotive and industrial sensing, integration progress from the NXP acquisition, product launches with in-sensor or edge AI, and gross-margin performance as acquired products move through ST’s manufacturing and go-to-market system.
The major risks are sensor commoditization, slow commercialization of robotics and Physical AI, acquisition-integration costs, customer insourcing, and competition from specialized MEMS and imaging suppliers. The strategic logic is credible, but the revenue opportunity should be judged on design-win conversion and segment economics rather than on robotics market enthusiasm alone.
4. Key FAQs
How does STMicroelectronics make money and what drives its gross margin?
STMicroelectronics makes money primarily by selling semiconductor devices to OEMs and through distributors. The revenue base includes analog ICs, MEMS and optical sensors, power discretes, microcontrollers and microprocessors, secure products, automotive semiconductors, RF products, silicon photonics and custom ASICs. Gross margin is driven by average selling price, product mix, wafer and packaging yields, factory utilization, depreciation, purchasing costs, currency, and the amount of differentiated value embedded in each product. Because ST owns significant manufacturing capacity, utilization is especially important: stronger volume can improve factory absorption, while weak demand can create unused-capacity charges.
Does STMicroelectronics have a durable moat in microcontrollers and automotive semiconductors?
Yes, but the moat is narrower and more technical than simple market share suggests. In microcontrollers, STM32 benefits from a large device family, software tools, middleware, developer familiarity and reusable code, creating meaningful switching costs. In automotive, qualification requirements, functional safety, reliability history, long product cycles and customer-specific engineering make replacement expensive. The moat is strongest when those switching costs are combined with proprietary process technology and application expertise. It is weaker in highly standardized products where buyers can qualify multiple vendors and price becomes the main purchasing criterion.
What could drive STMicroelectronics revenue growth through 2027 and 2028?
The clearest disclosed growth vectors are AI data centers, LEO communications, sensors and Physical AI, automotive digitalization and electrification, and the normalization of industrial demand. Management expects about $1 billion of data-center revenue in 2026 and has said it could double in 2027 if current dynamics and engagements continue. ST is also targeting well above $3 billion of cumulative space revenue in 2026-2028 and mid-teens sensor revenue CAGR through 2028. The important qualification is that revenue growth alone is not enough: the investment case in the business model depends on whether those programs fill new manufacturing capacity at attractive mix and allow gross margin and free cash flow to recover.
5. Conclusion
The corporate gene of STMicroelectronics is specialized vertical integration. The company creates proprietary process technologies, turns them into reusable semiconductor platforms, surrounds important franchises with software and application ecosystems, and uses its manufacturing network to industrialize products for automotive, industrial, personal-electronics, communications, space and AI-infrastructure customers. The most valuable asset is not the fab footprint in isolation; it is the ability to connect process technology, product architecture, software, packaging, qualification and customer engineering into a system that is difficult to replace quickly.
That structure creates genuine economic moats in intangible assets and switching costs, but it also creates a disciplined test for shareholders and corporate strategists: factories must be filled. ST’s margin compression in 2024 and 2025 demonstrated that an IDM can move from advantage to burden when demand and utilization weaken. Conversely, the combination of recovering volume, higher-value AI and LEO programs, sensor expansion and manufacturing restructuring could create substantial operating leverage if execution is strong.
The next phase of the STMicroelectronics business model therefore depends less on whether semiconductor demand grows in the abstract and more on whether the company can populate its new capacity with differentiated products that customers are reluctant to redesign away from. Cloud AI, LEO, intelligent sensing and advanced power are strategically attractive because they reward exactly the capabilities ST has spent decades accumulating: specialized process IP, high-volume manufacturing, embedded control, analog expertise, system-level co-design and supply-chain control. The counterweight is equally clear: capital intensity, customer concentration and technology transitions leave little room for poor utilization or delayed ramps.
Primary Sources
- STMicroelectronics Investor Relations — FAQs and Company History
- STMicroelectronics Investor Relations — Corporate Strategy and IDM Model
- STMicroelectronics — 2025 Annual Report on Form 20-F
- STMicroelectronics — Q2 2026 Financial Results
- STMicroelectronics — 2027-2028 Financial Model and Path Toward 2030 Ambition
- STMicroelectronics — Manufacturing Footprint and Global Cost Base Program
- STMicroelectronics — Updated Data Center Revenue Ambition
- STMicroelectronics — Strategic Engagement with Amazon Web Services
- STMicroelectronics — PIC100 Silicon Photonics High-Volume Production
- STMicroelectronics — 800 VDC AI Data Center Power Portfolio with NVIDIA
- STMicroelectronics — The LEO Opportunity
- STMicroelectronics — Closing of NXP MEMS Sensors Business Acquisition
- STMicroelectronics — Intelligent Sensing and Physical AI
- STMicroelectronics — China-Manufactured STM32 Volume Production
- STMicroelectronics — ST-NUS HELIX Edge AI Corporate Lab
- STMicroelectronics — 2012 Sustainability Report and Strategic Refocus
Disclaimer: This article is intended solely for business logic discussion and corporate research purposes, and does not constitute investment advice of any kind.