

Key Takeaways
- ASML earns revenue from lithography and related systems, then monetizes the installed fleet through service and productivity upgrades.
- Its strongest barriers are accumulated systems-engineering knowledge and the cost and risk of changing a qualified manufacturing process.
- The platform connects scanners, software, metrology and inspection around customer manufacturing economics; it should not be mistaken for a conventional software marketplace or network-effect business.
- The next investment tests are converting demand into deliverable capacity and proving customer-specific High NA production economics.
- Critical supplier concentration, export permissions and customer capital-spending decisions can constrain revenue even when the underlying technology remains difficult to replicate.
The ASML business model is built around improving the economics of chip manufacturing at a technically demanding step: printing circuit patterns on wafers. Its equipment matters because chipmakers need precision, productive output and reliable operation together. A machine that delivers a smaller pattern but fails the customer’s yield or cost requirements has limited commercial value.
ASML, listed on Nasdaq under the ticker ASML, reports its financial results in euros. This Corporate DNA analysis uses official information available through October 26, 2026. Historical facts and company plans are distinguished from the analytical judgments that follow.
1. Business Model Breakdown
Equipment revenue establishes the relationship; lifetime productivity extends it
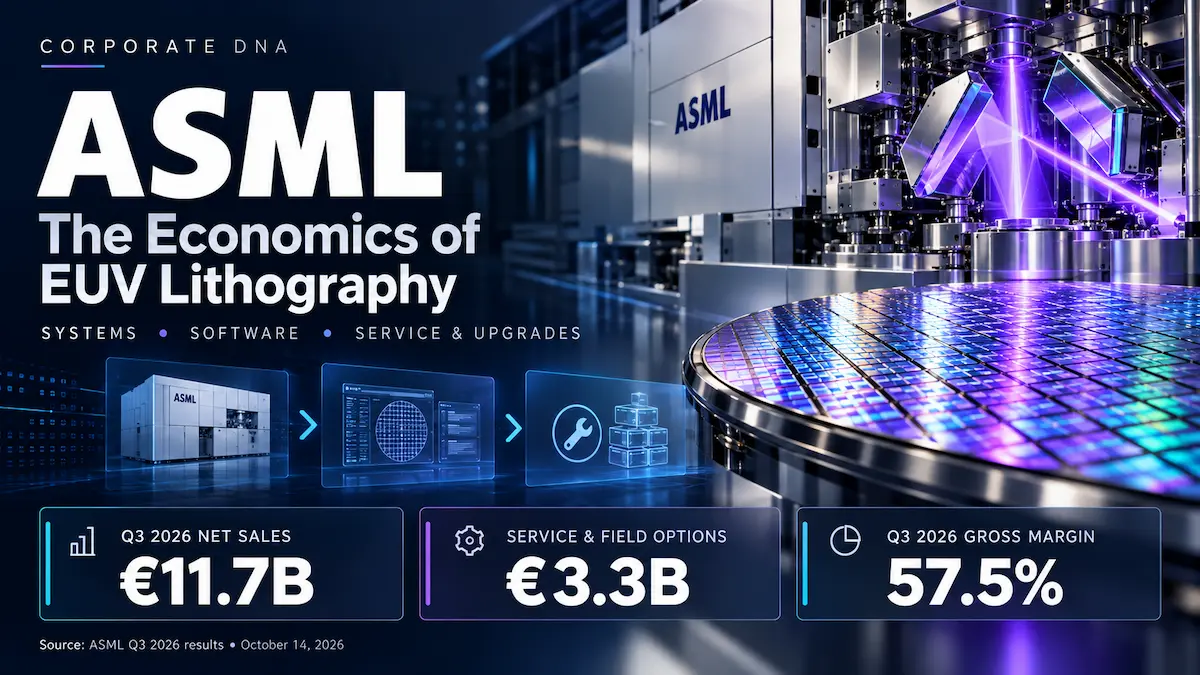
ASML’s Q3 2026 release reported €11.662 billion of net sales and a 57.5% gross margin. The official US GAAP financial statements separate €8.3732 billion of net system sales from €3.2888 billion of net service and field-option sales, known as Installed Base Management.
Installed Base Management represented approximately 28.2% of quarterly sales, calculated from company-reported figures: €3.2888 billion ÷ €11.662 billion × 100. System sales represented the remaining approximately 71.8%. These are revenue categories, not separately disclosed operating segments.
The first commercial layer is the equipment purchase. Extreme ultraviolet lithography, or EUV, addresses advanced patterning requirements; deep ultraviolet lithography, or DUV, serves a broader range of manufacturing applications. ASML also supplies metrology and inspection equipment and computational lithography software through its product portfolio.
The second layer is keeping that equipment economically useful. Maintenance protects availability; field options can improve the productivity or capability of an installed machine. This gives ASML an opportunity to earn further revenue from an existing customer without requiring an entirely new scanner sale.
That opportunity is not the same as a guaranteed subscription annuity. Upgrade timing, customer utilization, budgets and permitted access to equipment affect demand. The category also combines different activities, so its revenue share does not establish a standalone service margin. ASML’s 2025 financial review explains that field upgrades shifted a substantial amount of EUV revenue from systems into installed-base revenue. A change in mix can therefore reflect how capability is delivered, as well as growth in support activity.
The platform strategy sells a manufacturing outcome
ASML’s computational lithography offering helps coordinate patterns, models and equipment settings. Its metrology architecture feeds measurement information back into process control. The commercial proposition is an integrated way to improve production, rather than a collection of unrelated machine features.
The economic implication is that this architecture expands the relevant buying decision from equipment price to cost per good wafer. A customer considers output, yield, downtime, process complexity and the capital required to achieve the desired result. An expensive tool can be economically attractive if it improves that complete equation; a cheaper tool can be unattractive if integration or production losses overwhelm the saving.
The same logic helps explain the upgrade business. When additional output can be obtained from existing equipment, the customer may avoid some of the space, installation and coordination burden of adding another machine. ASML can capture part of the value delivered, but the customer must retain enough benefit to justify adoption. Pricing power ultimately depends on that exchange.
2. Deep Dive into Economic Moats
Intangible assets: accumulated engineering knowledge is harder to buy than individual components
ASML’s 2025 strategic report describes it as the only manufacturer of EUV lithography systems. That is a narrower claim than a monopoly over lithography: Nikon and Canon compete in DUV, and supporting applications also face competition.
The defensible intangible asset is the accumulated ability to make interdependent technologies work reliably in production. Patents are part of the protection, but a patent portfolio alone does not reproduce manufacturing knowledge, software calibration, supplier coordination and customer qualification experience.
A challenger must do more than demonstrate that a component or laboratory prototype works. It must integrate the architecture, deliver acceptable throughput and reliability, support it in customer fabs and continue improving while the incumbent advances. The catch-up cost includes failed iterations, scarce engineering talent, supplier development and the time needed to earn production trust.
This makes the barrier cumulative. Each solved reliability or integration problem can inform the next product generation. However, the advantage remains dependent on reinvestment: ASML reported €4.7 billion of R&D spending in its 2025 annual report. That spending is evidence of the cost of staying competitive, not proof that every development program will produce an attractive return.
Switching costs: the qualified process is the real commitment
The switching-cost argument follows from the surrounding production process. Scanner settings, masks, materials, computational corrections and measurement feedback have to work together. Changing a critical platform can require requalification and introduces risks to yield, production schedules and equipment availability.
This is an analytical inference from ASML’s documented product architecture, not a company-published estimate of a universal switching cost. Customers are not physically unable to change suppliers, and every new fabrication plant creates some opportunity to reconsider architecture. The stronger claim is that a challenger must offer enough economic improvement to compensate for transition cost and execution risk.
These two barriers reinforce each other. Engineering capability helps the installed equipment perform; a qualified installed process creates continuity while ASML develops the next generation. Together they can support durable economic returns, provided customers continue receiving superior manufacturing value and the cost of maintaining leadership does not consume that value.
Network effects and cost advantages deserve more restrained treatment. Another customer does not automatically make an individual scanner more useful in the way another participant improves a communications network. A larger fleet can support learning and spread R&D costs, but those are learning and scale benefits. Scale becomes a moat only when it produces customer outcomes that rivals cannot economically match.
The supplier ecosystem also cuts both ways. The strategic report identifies Carl Zeiss SMT as the sole supplier of critical optics under an exclusive arrangement and notes that its capacity limits ASML output. Such specialization makes replication difficult, but also concentrates execution risk. A hard-to-replace supplier can strengthen the architecture’s competitive position while becoming its production bottleneck.
3. Business Inflection Points & Future Catalysts
The 2013 Cymer acquisition: bringing a critical bottleneck closer to the system roadmap
ASML’s official history traces its origins to the Philips and ASMI venture formed in 1984. For this analysis, the pivotal strategic turning point was its 2013 acquisition of Cymer to accelerate EUV development.
The business significance was selective integration. A critical light-source development problem could be coordinated more closely with the scanner roadmap. The acquisition did not create a fully self-contained supply chain, nor did it single-handedly industrialize EUV. Optics, software, materials, manufacturing and customer validation still had to progress together.
The broader corporate lesson is that ownership can be most valuable at an interface where coordination failure threatens the entire product. ASML’s strategy combines control over selected technologies with deep reliance on specialized partners. It is a model of deciding which bottlenecks to internalize, rather than attempting to manufacture every component itself.
Catalyst one: converting 2027–2028 demand into output and economic value
In its latest release, management said currently planned supply would not fully meet customer demand in 2027 and 2028. Its plans include a 30% capacity increase in 2027 for low-NA EUV and DUV immersion, while investigating further expansion for 2028. These are capacity plans and customer-demand assessments, not formal revenue growth guidance.
The official Q3 CEO/CFO video transcript adds a monetization mechanism: value-based pricing discussions with key customers had been completed, with a partial effect expected in 2027 and a full effect in 2028 and beyond. Management did not disclose the financial magnitude.
The potential transmission is through both delivered volume and value per unit of useful manufacturing output. More systems can expand revenue; productivity upgrades and pricing can capture part of the benefit delivered to customers. Margin improvement still depends on product mix, manufacturing execution and the resources needed to achieve the ramp.
- Observable indicators: recognized system revenue, delivery and customer-acceptance progress, installed-base upgrade demand, gross-margin trends and cash conversion.
- Execution risks: critical-component capacity, installation capability, customer fab readiness and changes to spending schedules. An order or demand forecast is not recognized revenue.
- Failure condition: if the ramp costs more than expected or customers defer investment, capacity commitments can precede the associated earnings. Higher output per installed machine can also reduce the number of additional tools needed for a given production target.
Catalyst two: selective High NA adoption must pass the customer’s economics test
Samsung’s September 2026 announcement targets High NA EUV adoption in DRAM high-volume manufacturing by 2028. This is a customer plan, not a completed production milestone. Adoption schedules differ: ASML’s Q3 prepared remarks describe TSMC’s timing as 2030.
Higher resolution can create commercial value where it simplifies patterning enough to improve cost per good wafer. Successful qualification can expand equipment demand and establish another serviceable installed fleet. Technical capability alone does not settle the investment case, because the tool, masks, materials, uptime and yield must work as an economic system.
- Observable indicators: customer-confirmed production insertion, productive layers, availability, yield, wafer output and recognized High NA system revenue.
- Execution risks: process integration and complementary technologies can take longer than expected. Customers can extend existing approaches where their economics remain preferable.
- Failure condition: slower adoption would defer revenue while development and supply-chain investment continue. Installed research tools or experimental wafer exposures should not be treated as equivalent to sustained commercial production.
Both catalysts also operate within policy constraints. The Dutch government’s explanation of equipment controls describes licensing for specified technologies, not a universal export ban. The business risk is that permissions can change accessible demand, sales mix and delivery timing. A strong technical position cannot override the legal perimeter in which the company operates.
4. Key FAQs
How does ASML make money after selling a lithography machine?
It earns additional revenue through service and field options, including upgrades. The customer’s incentive is to protect availability or obtain more useful output from installed equipment. The resulting relationship can last beyond the initial sale, but revenue depends on the activity purchased and should not be modeled as an automatic software subscription.
Does ASML’s EUV position mean it can charge any price?
No. A customer compares the tool’s full production economics with available process alternatives and the option to delay investment. ASML can capture value when its technology improves that equation, but customer budgets, utilization and expected returns constrain what the customer will pay.
Why does ASML still need specialized suppliers if its technology is so difficult to copy?
Complexity makes specialization valuable. Developing every critical component internally would duplicate expertise and could slow the system roadmap. The trade-off is concentration: supplier collaboration can improve technical performance while making ASML’s delivery capacity dependent on partners it cannot quickly replace.
5. Conclusion
ASML’s corporate DNA is the ability to coordinate difficult technologies around a measurable customer outcome: economically productive chip manufacturing. Equipment creates the installed relationship; software, process control, support and upgrades extend its relevance. The business earns its position through continued performance, rather than the mere size of its installed base.
The most defensible moats are accumulated engineering knowledge and the cost of changing a qualified manufacturing process. They can support long-term excess returns because a competitor must reproduce an operating system of capabilities and prove it under production conditions. Their strength does not remove the need for sustained R&D, supplier investment and disciplined commercialization.
Over the next two years, the clearest tests are whether demand converts into accepted output at attractive economics and whether specific customers move High NA into commercially productive use. Supplier constraints, customer returns and export permissions remain decisive. The durable business thesis rests on preserving manufacturing value through each technology transition.
Sources: ASML 2025 Annual Report; ASML Q3 2026 official results and management materials; ASML corporate history; ASML product documentation; and the primary customer and government announcements linked above. Calculations and moat assessments are identified as analysis; company plans are not presented as completed results.
Disclaimer: This article is intended solely for business logic discussion and corporate research purposes, and does not constitute investment advice of any kind.