




Key Takeaways
- AT&T beat revenue and adjusted EPS expectations, yet its shares fell on earnings day as the cash-flow implications remained more restrained than the headline results.
- Fiber and wireless convergence is strengthening the operating franchise, but introductory pricing and customer acquisition spending require a longer payback period.
- The higher full-year adjusted EPS outlook primarily reflects lower depreciation under held-for-sale accounting for the Mexico business; it is not an equivalent upgrade to recurring cash generation.
- Lower planned capital investment does not flow directly into higher free cash flow because interest, working capital and portfolio changes absorb the benefit.
- The valuation offers a modest earnings multiple and meaningful dividend yield, with leverage and cash allocation determining whether that apparent discount is deserved.
AT&T’s third-quarter results show a connectivity business gaining customers while its financial model remains demanding. This AT&T Q3 2026 earnings analysis examines the quarter ended September 30, reported October 21, 2026, using the official release, financial schedules and full earnings-call transcript. All amounts are in U.S. dollars; the stock-price snapshot is dated separately.
The investment question is whether stronger customer relationships will produce enough incremental cash to fund network investment, service debt and reward shareholders. The quarter supports the commercial strategy. It also shows why investors should distinguish operating progress, accounting changes and cash available for distribution.
Core Earnings Breakdown
Revenue and Profitability Analysis
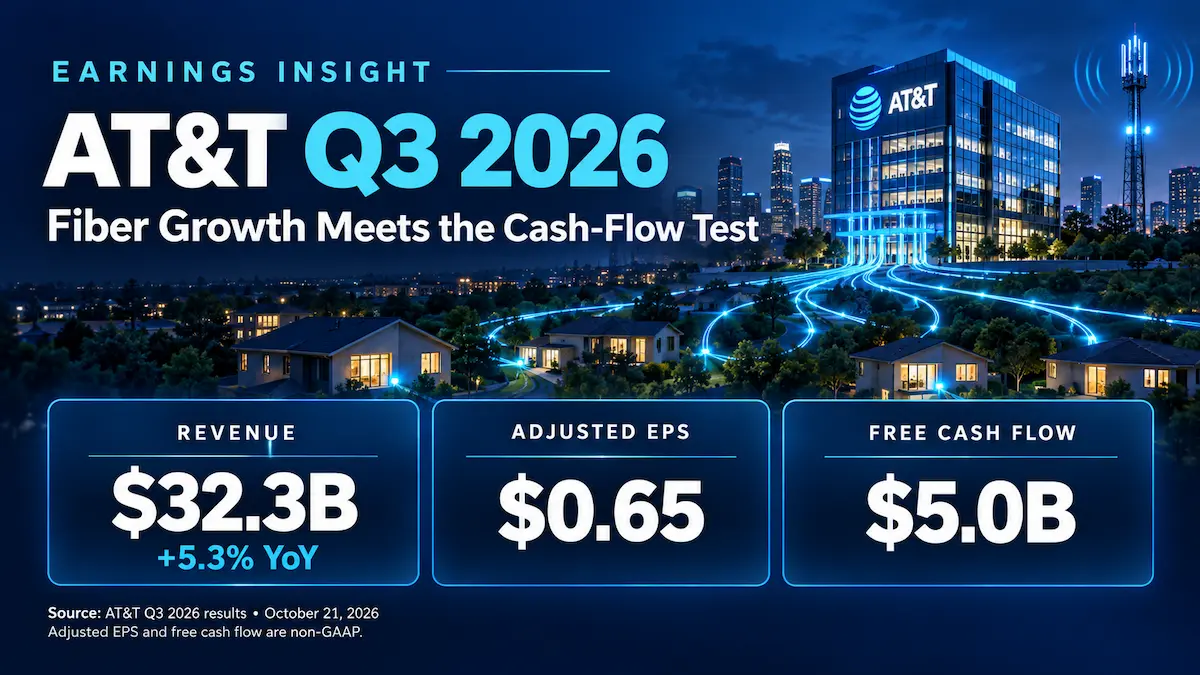
AT&T’s official earnings package reports revenue of $32.322 billion, up 5.3% year over year. Service revenue increased 3.8% to $26.301 billion. Adjusted EPS reached $0.65, up 20.4%, while GAAP diluted EPS from continuing operations was $0.13. Adjusted EBITDA was $12.505 billion, with a 38.7% margin.
The quarterly filing and official segment schedules use the reporting structure introduced in early 2026. The main businesses should be assessed on that basis:
- Advanced Connectivity: revenue $29.481 billion, up 7.2%; segment operating margin 25.9%. This is the engine of the investment case, but investors need to distinguish growth in recurring services from lower-margin equipment sales.
- Legacy: revenue $1.519 billion, down 24.5%; operating margin 32.8%. Its remaining profit is a shrinking bridge to network retirement, with value depending on how quickly direct costs can disappear.
- Latin America: revenue $1.240 billion, up 13.2%; operating margin 3.6%. The Mexico business is under an agreement to be sold, so its current growth does not represent a permanent contributor to the future portfolio.
Revenue shares are 91.2%, 4.7% and 3.8%, respectively, calculated from company-reported figures as each segment’s revenue divided by consolidated revenue. Corporate and Other contributes the remaining approximately 0.3%. These are reportable segments; wireless service and home internet are components of Advanced Connectivity.
Advanced Connectivity’s service revenue grew 6.1%, including 5.0% wireless service growth and 23.4% Advanced Home Internet growth. The acquired Lumen customer relationships contribute to the latter comparison, so it should not be described as organic growth. The broader point is that selling more services into a household can improve the economics of an existing network, provided discounts do not consume the value of the additional relationship.
Expectations vs. Actual Results
Using MarketBeat’s consensus record consistently:
- Revenue: $32.322 billion actual versus approximately $31.69 billion expected. ✅ Beat of approximately 2.0%, calculated using the company-reported actual and rounded consensus: ($32.322 billion ÷ $31.69 billion − 1) × 100.
- Adjusted EPS: $0.65 actual versus $0.6020 expected. ✅ Beat of $0.048 per share, or approximately 8.0%, calculated as ($0.65 ÷ $0.6020 − 1) × 100. This benchmark must be compared with adjusted EPS.
- Operating margin: GAAP margin was 12.7%; adjusted operating margin was 23.5%, according to the official financial schedules. No comparable, independently verified consensus margin was available, so a margin beat or miss cannot be established.
The business explanation for the strong quarter is customer growth, wireless pricing and operating efficiencies, with lower depreciation also supporting earnings. The sources do not disclose analysts’ complete operating assumptions, so attributing a precise portion of the consensus beat to each driver would imply more certainty than the evidence supports.
The GAAP-to-adjusted EPS reconciliation is $0.13 + $0.41 for the Mexico impairment + $0.09 for employee separation charges + $0.02 for other adjustments = $0.65. The prior-year GAAP comparison also contained a DIRECTV sale gain. Those items explain why the sharp GAAP EPS decline should not be confused with a collapse in the continuing operating franchise.
Management’s outlook presentation puts 2026 adjusted EPS in the $2.40 range, versus the prior $2.25–$2.35 outlook. Full-year free cash flow remains $18 billion-plus, with capital investment of $23 billion–$24 billion. For 2027 and 2028, annual capital investment is now expected at $22 billion–$23 billion, while free-cash-flow targets remain $19 billion-plus and $21 billion-plus, respectively. These are company forecasts, not realized results.
For Q4, the official call transcript indicates approximately $6 billion of free cash flow, alongside higher customer acquisition costs and seasonal moderation in home internet additions. It does not provide a numerical quarterly revenue or EPS forecast. The future outlook excludes the Mexico business beginning in 2027; readers should account for that portfolio change when comparing years.
Trading history shows the shares closed October 21 at $21.91, down 6.45% from $23.42. That is the earnings-day reaction, distinct from subsequent trading sessions.
My interpretation is that investors focused on cash conversion and the cost of growth more than the headline EPS beat. A depreciation-driven upgrade provides less immediate support to distributable cash than a comparable increase in operating cash generation. The unchanged free-cash-flow outlook reinforces that distinction. Competition, financing costs and the execution demands of the expanded network also influence the valuation; price action alone cannot isolate each factor.
Earnings Call Highlights
The following are accurate paraphrases of management’s full official earnings-call transcript, including the Q&A.
CFO Pascal Desroches: The EPS outlook increase primarily reflects lower Mexico depreciation under held-for-sale accounting.
💡 Reading Between the Lines: A valuation model should separate the accounting benefit from the cash contribution that exits with the sale. Treating the full increase as evidence of faster recurring profit growth would overstate the improvement.
CFO Pascal Desroches: Lower planned capital investment is offset by other cash demands rather than raising the free-cash-flow targets.
💡 Reading Between the Lines: Customer growth requires upfront funding, and debt carries a cash cost. Investors should trace where each saving goes before treating it as capacity for additional dividends, buybacks or debt reduction.
Management: Converged relationships remain a priority even as introductory pricing and customer mix reduce fiber ARPU.
💡 Reading Between the Lines: Lower revenue per fiber connection can be rational if wireless attachment and retention lift total account value. That argument needs evidence from customer cohorts over time, rather than subscriber additions alone.
CEO John Stankey: New fiber investment is underwritten around terminal penetration of 40%, with convergence supporting the ambition to do better.
💡 Reading Between the Lines: The underwriting assumption is more informative than the size of the addressable footprint. Higher penetration could improve returns, but it remains an execution opportunity rather than a guaranteed outcome.
Deep Business Insights
Hidden Metrics That Matter
The first overlooked metric is the composition of Advanced Connectivity’s operating profit growth. Segment operating income increased by $1.211 billion, while depreciation and amortization declined by $374 million. The calculation is $374 million ÷ $1.211 billion = approximately 30.9%, calculated from company-reported figures in the financial schedules. The remaining $837 million corresponds to the increase in segment EBITDA.
This is an accounting bridge, not an argument that depreciation has no economic meaning. It shows why operating income can grow substantially faster than EBITDA while the network still requires investment. Investors should evaluate the age and replacement needs of the asset base alongside reported profitability.
The second metric is cash remaining after distributions. Company-defined free cash flow was $4.953 billion, calculated as $10.519 billion of operating cash flow minus $5.061 billion of capital expenditures and $505 million of vendor-financing payments. Subtracting $1.950 billion of dividends leaves $3.003 billion; approximately $2.8 billion of buybacks absorbed about 93% of that amount. This ratio is calculated from company-reported figures using rounded buybacks: $2.8 billion ÷ $3.003 billion.
The quarter therefore offered limited residual cash after these shareholder distributions, before other financing and investment activities. That is not a full-year funding conclusion, because cash flows are seasonal. It does make the trade-off between repurchases and balance-sheet repair central to the investment case.
Why do customers choose AT&T? The commercial proposition combines home connectivity, nationwide wireless service and simpler account management. The company reports a 42.8% convergence rate, defined as Advanced Home Internet connections whose primary account holders also subscribe to consumer postpaid phone service. It does not mean that percentage of all AT&T wireless users have fiber.
That existing relationship gives AT&T a cross-selling channel which a standalone internet provider may find harder to replicate. In return, customers receive convenience and bundle value. The advantage becomes economically durable only if acquisition costs, discounts and service quality produce favorable retention and account profitability. A large footprint alone does not establish that result.
Industry Chain Reactions
The following are conditional implications of AT&T’s deployment and convergence strategy, not reported revisions to other companies’ earnings guidance:
- ✅ Potential beneficiary — Corning (NYSE: GLW). The companies’ September 2026 agreement exceeds $3 billion over multiple years and supports fiber and cable supply for network expansion. Continued construction could improve Corning’s demand visibility and factory utilization, although delivery timing and product mix determine the actual earnings contribution. The agreement value is not annual revenue.
- ❌ Potential competitive pressure — Comcast (Nasdaq: CMCSA). Comcast’s official results describe its competing broadband and wireless offering. In overlapping markets, AT&T’s fiber rollout and bundles could raise Comcast’s retention and promotional burden. Comcast can respond with its own mobile proposition and network upgrades; there is no basis to assume every AT&T addition came from Comcast.
Valuation Framework and Key Risks
The verified market snapshot was $21.03 at 10:02 a.m. EDT on October 26, 2026, according to Stock Analysis. Using the approximate company EPS outlook, $21.03 ÷ $2.40 = about 8.8 times guided 2026 adjusted EPS. The planned annualized dividend implies $1.11 ÷ $21.03 × 100 = approximately 5.3%. Both are analyst calculations using company-reported guidance and the dated market price; neither is a guaranteed return.
That multiple can look inexpensive, but an equity earnings multiple does not capture all the claims on enterprise cash flow. AT&T reported approximately $149.8 billion of net debt and a 3.13-times net-debt-to-adjusted-EBITDA ratio. Its goal of returning leverage to the 2.5-times range in 2029 is an objective still to be delivered.
A practical framework starts with cash generation after network investment, then tests interest costs, asset-sale proceeds and shareholder distributions. Fiber economics should be modeled through penetration, account value and acquisition payback. A separate scenario should allow for persistent copper costs, slower customer conversion or more expensive promotional competition.
- Customer economics: introductory offers can accelerate penetration while delaying payback. Weak retention or limited wireless attachment would reduce the value of headline subscriber growth.
- Capital and financing: deployment remains capital intensive, and higher interest or device-related working capital can absorb efficiency gains.
- Portfolio and accounting: the Mexico exit changes future cash generation, while acquired Lumen customers and network assets have different reporting treatment. Comparisons require a consistent perimeter.
- Legacy execution: migrating customers and obtaining approvals to retire copper determine when the associated costs can leave the system.
The most useful evidence in coming quarters will be sustained service growth accompanied by stronger cash conversion and a credible decline in leverage. Subscriber momentum improves the opportunity; disciplined funding determines how much of that opportunity reaches shareholders.
Key FAQs
Why did AT&T stock fall after its Q3 2026 earnings beat?
The revenue and adjusted EPS beats did not bring an equivalent free-cash-flow upgrade. The higher EPS outlook primarily reflected lower depreciation, while acquisition costs, interest and working capital remained important constraints. These factors help explain the market’s caution, although they cannot establish a single cause for the stock move.
Is AT&T’s higher 2026 EPS guidance supported by higher free cash flow?
The company maintained its annual free-cash-flow target. Investors should distinguish the EPS benefit from held-for-sale accounting from changes in cash generation, and separately assess the future loss of the Mexico business’s contribution.
Does AT&T’s convergence rate measure fiber penetration?
No. Convergence measures home internet connections whose primary account holders also have AT&T consumer postpaid phone service. Fiber penetration measures customer take-up relative to an available footprint. They answer different questions about cross-selling and network utilization.
Sources: Results and guidance were verified against AT&T’s official Q3 2026 Investor Relations earnings package, including its release, financial schedules, presentation and full earnings-call transcript. Market expectations and dated prices are linked where used; calculations and investment interpretations are identified separately.
Disclaimer: This article/chart is for educational and informational purposes only and does not constitute investment advice of any kind. Past performance is not indicative of future results. Investors should independently evaluate their own risks.