
Key Takeaways
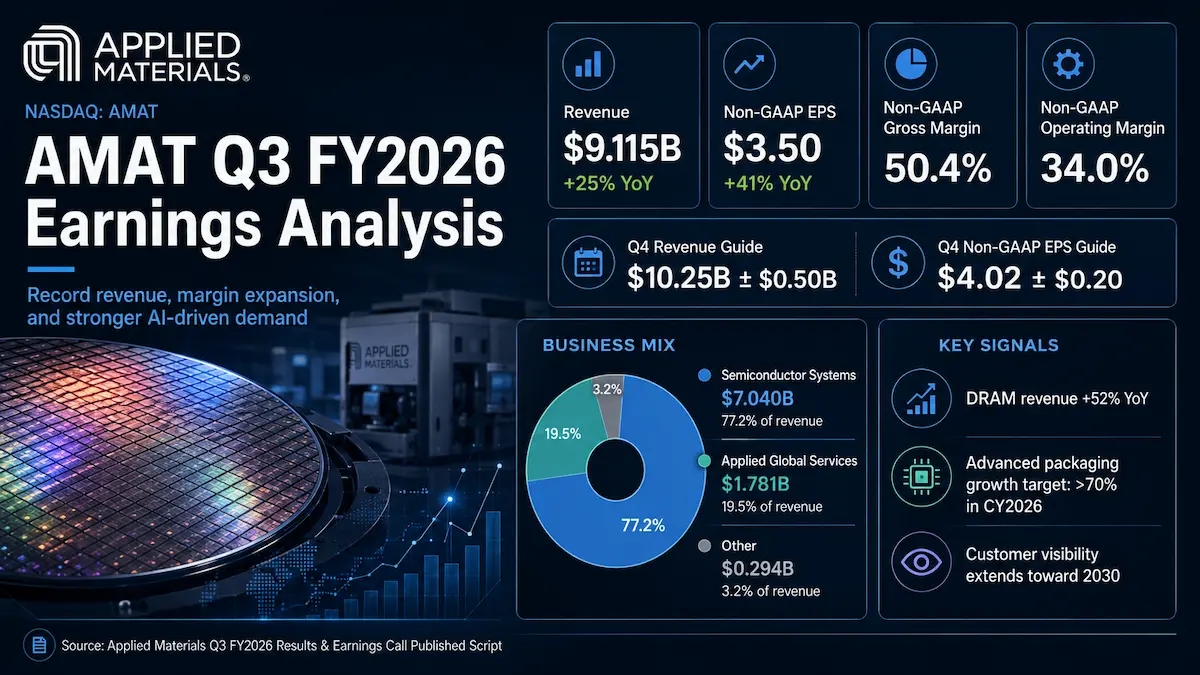
- Applied Materials delivered record fiscal Q3 2026 revenue of $9.115 billion, up 25% year over year, while non-GAAP EPS reached a record $3.50, up 41%.
- Semiconductor Systems remained the core engine at $7.040 billion, roughly 77.2% of company revenue, while Applied Global Services reached $1.781 billion and grew 22% year over year.
- Management raised its calendar-2026 growth expectations across several AI-sensitive businesses: advanced packaging revenue is now expected to grow more than 70%, AGS more than 20%, and process diagnostics and control more than 50%.
- Q4 guidance was materially above published Wall Street consensus, yet AMAT fell more than 5% after hours and closed the next session down 5.12% at $507.18, showing that investors were benchmarking the company against an unusually high AI-equipment growth bar rather than simply against consensus.
- The most important long-term signal was not the quarterly beat itself, but customer visibility extending toward 2030 and Applied’s plan to double quarterly semiconductor-system output from current levels by 2028.
Applied Materials’ fiscal third-quarter 2026 report was strong on almost every conventional earnings metric: record revenue, record non-GAAP EPS, expanding margins, accelerating DRAM demand, a higher advanced-packaging growth target and Q4 guidance above published consensus. The stock nevertheless sold off. That apparent contradiction is the key to understanding the investment case. AMAT is no longer being valued merely as a cyclical wafer-fab-equipment supplier that can beat quarterly estimates. Investors are increasingly underwriting it as a structural beneficiary of AI infrastructure spending and therefore demanding evidence of sustained share gains, superior growth versus peers and durable margin expansion.
Source-methodology note: Applied Materials’ Investor Relations website publishes an official Q3 FY2026 Earnings Call Published Script and webcast replay, rather than a complete written Q&A transcript. The management analysis below therefore uses the company-published script as the primary source for call commentary. Wall Street consensus figures and post-earnings market reaction are separately attributed to FactSet/LSEG data reported by major financial publications and Reuters.
1. Core Earnings Breakdown
Revenue and Profitability Analysis
Fiscal Q3 revenue was $9.115 billion, up 24.8% from $7.302 billion a year earlier, which the company rounded to 25%. Sequentially, management said revenue increased 15%, the highest quarter-on-quarter revenue growth in Applied Materials’ history. GAAP gross margin expanded to 50.3% from 48.8%, while non-GAAP gross margin reached 50.4%, up 150 basis points year over year. GAAP operating margin rose to 33.7% from 30.6%; non-GAAP operating margin reached a record 34.0%, up 330 basis points. GAAP EPS was $3.17 and non-GAAP EPS was $3.50.
- Semiconductor Systems: $7.040 billion of revenue, up about 27% year over year and approximately 77.2% of total company revenue. Foundry, logic and other represented 67% of segment revenue, DRAM 26%, and flash memory 7%. Management said DRAM revenue, including HBM packaging, grew 52% year over year. Investment view: this is the most important segment because it captures both the AI technology race and the capacity race; the increasing DRAM mix suggests AMAT’s growth is broadening beyond leading-edge logic into HBM-related memory spending rather than depending on a single end market.
- Applied Global Services: $1.781 billion, up about 22% year over year and approximately 19.5% of company revenue. Segment gross margin reached 35.6% and operating margin 30.1%, both higher than a year earlier. Investment view: AGS is becoming more than a defensive installed-base annuity; rising fab utilization, more than 37,000 connected chambers and AI-enabled service tools are turning services into a higher-growth, higher-margin contributor during the current capacity expansion.
- Other: $294 million, up about 7% year over year and approximately 3.2% of total revenue. Display results are included here. Investment view: Other is too small to drive the current thesis, but the coming Q4 step-up and management’s longer-term modeling assumption of roughly $400 million per quarter through 2027 mean it can reduce earnings noise if the Display recovery becomes more consistent.
Profitability quality was especially notable. Non-GAAP operating income increased to $3.096 billion from $2.245 billion, a much faster rate than revenue. The company also generated $3.037 billion of operating cash flow and $2.330 billion of non-GAAP free cash flow after $707 million of capital expenditures. It returned $860 million to shareholders through $440 million of repurchases and $420 million of dividends, while preserving substantial liquidity for capacity expansion and R&D.
Expectations vs. Actual Results
- Revenue: $9.115 billion actual versus approximately $8.99 billion LSEG/FactSet consensus. Result: ✅ Beat by about 1.4%.
- Non-GAAP EPS: $3.50 actual versus approximately $3.40 FactSet consensus. Result: ✅ Beat by about 2.9%.
- Non-GAAP operating margin: 34.0% actual versus approximately 33.5% implied by Applied’s prior Q3 guidance. Result: ✅ Roughly 50 basis points above the implied guide. The comparison is calculated from the prior company guidance of $8.95 billion revenue, about 50.1% non-GAAP gross margin and roughly $1.485 billion of non-GAAP operating expenses: (($8.95B × 50.1%) − $1.485B) ÷ $8.95B ≈ 33.5%.
The beat was not driven by a low-quality tax item or a single accounting adjustment. The operating engine itself was stronger: revenue came in above the company’s prior midpoint, gross margin reached 50.4%, and operating expenses grew much more slowly than revenue. The main GAAP-to-non-GAAP difference was a $220 million unrealized loss on strategic investments, which reduced GAAP earnings but did not represent deterioration in the core equipment business.
For fiscal Q4 2026, Applied guided to total revenue of $10.25 billion plus or minus $500 million and non-GAAP EPS of $4.02 plus or minus $0.20. Management also expects non-GAAP gross margin of approximately 50.4% and operating expenses around $1.58 billion. Within the revenue outlook, Semiconductor Systems is expected to contribute about $7.9 billion, AGS about $1.84 billion and Other around $510 million. The revenue midpoint was about 7.4% above the $9.54 billion LSEG consensus cited by Reuters, while the EPS midpoint was about 8.9% above the $3.69 consensus.
The market’s negative reaction therefore cannot be explained by a conventional guidance miss. The more important issue was the composition of expectations. After AMAT had more than doubled during 2026 before the report, investors were not asking whether the company could beat the published consensus; they were asking whether Applied could outgrow an exceptionally strong semiconductor-production-equipment peer group. Reuters reported that investors were focused on relative growth versus Lam Research, KLA and ASML, while the Q4 gross-margin guide of about 50.4% was essentially flat sequentially despite a large revenue step-up.
That distinction matters. In this earnings cycle, product revenue growth, market-share evidence and margin progression arguably mattered more than the headline EPS beat. The pipeline was strong, but a pipeline that points to 2027-2030 cannot fully offset near-term concern that peers may be converting the same AI capital-spending cycle into faster reported growth. AMAT’s after-hours decline of more than 5%, followed by a 5.12% drop to $507.18 on August 14, was therefore less a generic “sell the news” move than a repricing of the growth premium embedded in the stock.
Acquisition dilution was not the principal issue. Applied’s Q4 non-GAAP EPS outlook excludes only $0.01 per share of known charges related to completed acquisitions, and Q3 cash paid for acquisitions was $87 million. The larger debate is whether the company can translate heavy investment in manufacturing, EPIC co-innovation, advanced packaging and process control into durable share gains quickly enough to justify a premium valuation.
Earnings Call Highlights
- Management expects leading-edge foundry-logic, DRAM and advanced packaging to account for roughly 80% of wafer-fab-equipment growth in 2026 and 2027, precisely the areas where Applied says it has its strongest leadership positions.
💡 Reading Between the Lines: The core thesis is increasingly mix-driven rather than purely cycle-driven. If industry spending continues to concentrate in these categories, AMAT can grow faster than overall WFE without needing every semiconductor end market to accelerate at the same time. - Applied raised its calendar-2026 advanced-packaging revenue growth expectation to more than 70%, up from the prior expectation of more than 50%.
💡 Reading Between the Lines: This is one of the clearest signs that AI system architecture is shifting value from front-end transistor scaling toward HBM, hybrid bonding, chiplets and 3D integration. Packaging can expand AMAT’s served market per AI system even when wafer starts alone do not capture the full economic opportunity. - Customers are giving Applied longer demand visibility than at any previous point, with some planning discussions extending to 2030, and the company is preparing to double quarterly system output from current levels by 2028.
💡 Reading Between the Lines: Management is committing real operating capacity against unusually long customer signals. This increases confidence in a multi-year demand runway, but it also raises fixed-cost and execution risk if AI infrastructure spending or fab buildouts slow before the added capacity is fully utilized. - Applied now expects AGS to grow more than 20% in calendar 2026 and process diagnostics and control to grow more than 50%, supported by more than 37,000 chambers connected to its AIx software capabilities.
💡 Reading Between the Lines: AMAT is trying to monetize the installed base and fab-yield problem more aggressively, not just sell new deposition or etch tools. That broadens recurring revenue, improves customer stickiness and pushes the company further into inspection and analytics markets that have traditionally supported premium multiples. - Management linked the company’s 13 consecutive quarters of year-over-year gross-margin expansion to value-based pricing, differentiated products and operating leverage rather than to a temporary cost tailwind.
💡 Reading Between the Lines: The margin story is central to the valuation. If customers are willing to pay for measurable gains in chip performance, yield, energy efficiency and fab output, AMAT can capture a larger portion of the economic value it creates; if competitive intensity rises, the first warning sign may appear in gross-margin progression before it appears in revenue.
2. Deep Business Insights
Hidden Metrics That Matter
One underappreciated metric is the acceleration of revenue outside China. This is calculated from company-reported figures, not directly disclosed as a growth rate. Q3 ex-China revenue was $9.115 billion minus $2.506 billion of China revenue, or $6.609 billion. A year earlier, ex-China revenue was $7.302 billion minus $2.548 billion, or $4.754 billion. The resulting growth rate is ($6.609B ÷ $4.754B) − 1 = approximately 39.0% year over year. China itself declined modestly in dollars and fell from 35% to 28% of total revenue, while the rest of the business expanded much faster.
This matters because one of the recurring valuation risks for U.S. semiconductor-equipment companies is exposure to China-related export restrictions and policy volatility. AMAT remains meaningfully exposed, but the quarter showed that its current growth is increasingly being funded by U.S., Korea, Taiwan, Europe and Southeast Asia demand rather than by incremental China growth. That does not eliminate geopolitical risk, but it improves the quality and geographic breadth of the growth profile.
A second hidden metric is incremental non-GAAP operating margin. This is also calculated from company-reported figures. Q3 non-GAAP operating income rose by $851 million, from $2.245 billion to $3.096 billion, while revenue increased by $1.813 billion, from $7.302 billion to $9.115 billion. The calculation is $0.851B ÷ $1.813B = approximately 46.9% incremental operating margin. That is far above the 34.0% reported operating margin and shows how powerfully additional revenue converted into operating profit during the quarter.
The strategic reason customers choose Applied Materials is not simply that it sells a large catalogue of semiconductor tools. The differentiation is its ability to combine materials deposition, modification, removal, metrology, eBeam inspection, packaging and services around a customer’s device architecture. For advanced AI chips, a process improvement has economic value only if it can be transferred into high-volume manufacturing with high yield and predictable throughput. Applied’s EPIC model is designed to bring chipmakers, systems companies, universities and equipment partners into the development process earlier, reducing the time between materials research and production qualification.
That creates a potentially important competitive loop. Earlier customer engagement can provide AMAT with multi-node visibility into technical problems; that visibility can improve R&D allocation and increase the probability of design wins; successful tools then enter an installed base that can generate recurring AGS revenue and data through connected chambers. The customer’s incentive is faster time to yield and more output from scarce cleanroom space. Applied’s incentive is deeper process integration, higher switching costs and greater value capture per technology transition.
Industry Chain Reactions
- ✅ Benefit — Micron Technology (MU): AMAT’s 52% year-over-year DRAM revenue growth, rising HBM-related packaging activity and expectation for a significant increase in DRAM revenue during the second half of calendar 2026 all reinforce the signal that leading memory manufacturers are expanding high-value capacity. For Micron, better equipment availability and faster yield learning can support HBM and advanced-DRAM ramps. The caveat is that the same trend also requires substantial capital spending, so the read-through is positive for demand and production capability, not automatically for near-term free cash flow.
- ❌ Face Pressure — KLA Corporation (KLAC): Applied expects its process diagnostics and control business to grow more than 50% in calendar 2026 and is introducing both eBeam and optical inspection products for advanced logic, DRAM and packaging. KLA remains a major beneficiary of rising process complexity, but AMAT’s push to increase applications share in inspection and metrology creates a more direct competitive overlap. The industry can grow fast enough for both companies to expand, yet incremental AMAT share gains would challenge one of KLAC’s highest-quality franchises.
Valuation Framework and Key Risks
AMAT closed at $507.18 on August 14, 2026, down 5.12% in the first full trading session after earnings. Reuters, citing LSEG, placed Applied at roughly 32.14 times expected earnings over the next 12 months, compared with approximately 34.59 times for Lam Research, 36.85 times for KLA and 33.39 times for ASML. The relative discount is modest; the absolute valuation is still demanding for a company exposed to semiconductor capital-spending cycles.
At that valuation, the market is implicitly requiring more than ordinary earnings beats. A credible path to sustained faster-than-market WFE growth, continued share gains in gate-all-around, DRAM, HBM and advanced packaging, and further margin expansion is needed to defend the multiple. The positive side is that management’s own leading indicators are unusually strong: customer planning visibility extends toward 2030, more than ten new fab projects were announced by customers during the quarter, advanced packaging growth has been raised above 70%, and Applied is scaling manufacturing for materially higher output.
The first key risk is relative execution. Even if semiconductor-equipment demand remains strong, AMAT can underperform if Lam, KLA or ASML convert the same AI capex cycle into faster revenue growth or stronger share gains. That is exactly why a quarter that beat consensus still produced a negative stock reaction.
The second risk is margin durability during capacity expansion. Q4 non-GAAP gross margin is guided to remain near 50.4% despite a sharp revenue increase. Applied added more than 1,500 people in manufacturing and AGS customer support during Q3 and is investing to double quarterly systems output by 2028. These investments are rational if demand visibility proves accurate, but they increase the cost of a future utilization slowdown.
The third risk is geopolitical and regulatory exposure. China still represented 28% of total Q3 revenue and 26% of Semiconductor Systems plus AGS revenue. Export controls, licensing requirements, tariffs or further restrictions could affect both shipments and product mix. The encouraging counterpoint is that the quarter’s approximately 39% ex-China growth shows that the current acceleration is not dependent on China.
The fourth risk is earnings-quality optics. GAAP EPS of $3.17 was below non-GAAP EPS of $3.50 partly because of a $220 million unrealized loss on strategic investments. That item does not change the operating thesis, but continued investment-value volatility can create noise in reported GAAP earnings and complicate simple P/E comparisons.
Finally, investors should be careful with sequential comparisons entering fiscal 2027. Management noted that fiscal Q1 2027 will contain 14 weeks, which will mechanically lift both revenue capacity and operating expenses versus a normal quarter. A longer reporting period should not be mistaken for an underlying change in organic run-rate growth.
3. Key FAQs
Did Applied Materials beat AMAT Q3 2026 earnings estimates?
Yes. Applied Materials reported fiscal Q3 2026 revenue of $9.115 billion versus approximately $8.99 billion of published consensus and non-GAAP EPS of $3.50 versus approximately $3.40 of FactSet consensus. Non-GAAP operating margin reached a record 34.0%, about 50 basis points above the roughly 33.5% level implied by the company’s prior revenue, gross-margin and operating-expense guidance.
Why did AMAT stock fall after Q3 2026 earnings despite beating estimates?
The decline was primarily about the height of embedded expectations, not a conventional earnings miss. Q4 revenue and EPS guidance were above published consensus, but investors were focused on AMAT’s growth relative to other semiconductor-equipment leaders, the lack of sequential gross-margin expansion in the Q4 guide and whether current AI-driven demand can translate into sustained market-share gains. After a very large 2026 rally, a merely strong quarter was not enough to expand the valuation premium.
What is Applied Materials’ Q4 2026 guidance and 2027 outlook?
Applied guided fiscal Q4 2026 revenue to $10.25 billion plus or minus $500 million and non-GAAP EPS to $4.02 plus or minus $0.20, with non-GAAP gross margin around 50.4%. Management expects strong second-half growth in DRAM, leading-edge foundry-logic and advanced packaging, and said customer demand visibility supports another strong growth year in 2027. Longer term, the company is investing to double quarterly semiconductor-system output from current levels by 2028 and preserve additional capacity optionality through 2030.
Primary sources: Applied Materials Q3 FY2026 Results, Applied Materials Q3 FY2026 Earnings Call Published Script, and the Applied Materials Investor Relations website. Market-consensus and share-reaction cross-checks were made against Reuters’ August 13 earnings report and Reuters’ August 14 market follow-up.
Disclaimer: This article/chart is for educational and informational purposes only and does not constitute investment advice of any kind. Past performance is not indicative of future results. Investors should independently evaluate their own risks.