Key Takeaways
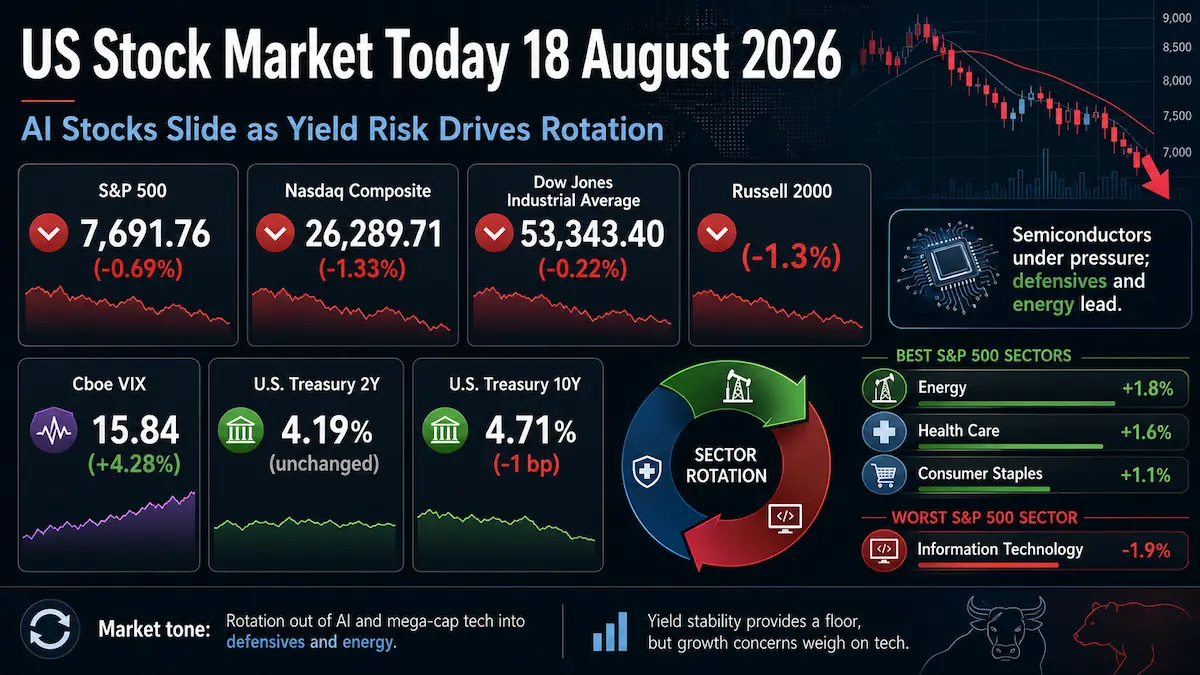
- The S&P 500 fell 0.69% to 7,691.76, the Nasdaq Composite dropped 1.33% to 26,289.71 and the Dow Jones Industrial Average declined 0.22% to 53,343.40. The Russell 2000 lost 1.3%, showing that weakness extended beyond mega-cap technology.
- Information Technology was the worst-performing S&P 500 sector at -1.9%, while Energy led at +1.8%, followed by Health Care at +1.6% and Consumer Staples at +1.1%. The Philadelphia Semiconductor Index fell about 5%.
- Cboe VIX closed at 15.84, up 0.65 point or 4.28%. The rise was consistent with higher hedging demand, but the absolute level did not signal disorderly market stress.
- July housing starts fell 12.4% month over month to a 1.239 million annualized rate, while industrial production rose 0.2%. Treasury yields retreated from intraday highs: the official 2-year CMT closed unchanged at 4.19% and the 10-year CMT eased 1 basis point to 4.71%.
1. Market Capital Flows and Sector Rotation
The defining feature of the August 18 session was rotation rather than indiscriminate liquidation. Energy gained 1.8%, benefiting from firmer crude prices and renewed geopolitical risk, while Health Care rose 1.6% and Consumer Staples advanced 1.1%. By contrast, Information Technology fell 1.9%, making it the weakest S&P 500 sector. The split is consistent with a move away from long-duration growth exposure and toward businesses with nearer-term cash-flow visibility, defensive demand characteristics or direct sensitivity to higher commodity prices.
Style and size performance reinforced that message, but with an important qualification. The Russell 2000 fell 1.3%, materially underperforming the S&P 500’s 0.69% decline, so the tape was not a simple large-cap-to-small-cap broadening trade. As investable style proxies, the iShares Russell 1000 Growth ETF NAV fell 1.59% while the iShares Russell 1000 Value ETF NAV edged up 0.04%. That points to a pronounced growth-to-value rotation even as smaller companies remained under pressure. In other words, value and defensives outperformed, but risk appetite did not broaden across the full equity market.
Market breadth was negative enough to confirm that the decline was broader than a handful of mega-cap names. Declining stocks outnumbered advancers by 1.94-to-1 on the NYSE and 1.67-to-1 on Nasdaq. Nasdaq recorded 1,778 advancing issues versus 2,977 decliners. Total U.S. equity volume was about 14.86 billion shares, below the 20-session average of 16.88 billion, which argues against describing the session as high-volume capitulation.
Institutional Flow Insight: The most plausible institutional interpretation is discretionary de-risking in high-duration growth after long-end yields reached fresh intraday extremes, combined with a rotation toward sectors with stronger near-term earnings visibility or inflation sensitivity. A higher VIX also mechanically raises portfolio risk for volatility-targeting and risk-budgeted strategies, which can encourage gross-exposure reduction at the margin. Because August 18 is neither month-end nor quarter-end, there is little basis to attribute the move primarily to mechanical calendar rebalancing; valuation sensitivity, rate risk and geopolitical uncertainty offer a stronger explanation.
2. Decoding the Biggest Market Movers
NVIDIA (NVDA)
NVIDIA closed down 2.3% and was among the largest drags on the major indexes as the semiconductor complex sold off sharply. The Philadelphia Semiconductor Index fell about 5%, while Micron dropped 7.0%, Sandisk fell 9% and Western Digital declined 7.4%. There was no new NVIDIA earnings release driving the move on August 18; the price action was primarily part of a broader semiconductor and high-duration growth de-rating as investors reassessed the valuation sensitivity of AI-linked equities to elevated long-term yields.
The sector read-through matters more than the single-stock decline. NVIDIA’s index weight means even a moderate pullback can amplify losses in cap-weighted technology benchmarks, but the simultaneous decline across memory and storage names shows that the pressure was not NVIDIA-specific. For institutional portfolios, the session highlighted how crowded AI and semiconductor exposure can behave as a common factor when discount-rate risk rises.
Home Depot (HD)
Home Depot finished down 0.12% at approximately $337.49 even after reporting a solid fiscal second quarter. Official company results showed sales of $47.861 billion, up 5.7% year over year, with comparable sales up 1.7% and U.S. comparable sales up 1.3%. GAAP diluted EPS was $4.79 and adjusted diluted EPS was $4.92. GAAP operating margin was 14.3%, while adjusted operating margin was 14.7%.
Management reaffirmed its full-year fiscal 2026 framework: total sales growth of about 2.5% to 4.5%, comparable sales from flat to up 2.0%, gross margin of about 33.1%, adjusted operating margin of about 12.8% to 13.0%, and adjusted diluted EPS growth from flat to up 4% versus fiscal 2025. The earnings call added important context. Second-quarter gross margin was 33.7%, aided by $685 million of IEEPA tariff refunds that reduced cost of goods sold. Management also said smaller repair-and-maintenance projects remained supportive, while larger discretionary projects continued to face pressure from housing affordability and consumer uncertainty.
The muted stock reaction appears consistent with investors distinguishing between healthy current-quarter execution and a still-cautious forward demand environment. The company did not raise its full-year range, and part of the margin benefit came from tariff refunds rather than purely structural operating leverage. For home-improvement and housing-linked equities, the read-through is therefore mixed: repair demand is resilient, but the weak July housing-starts report and continued pressure on big-ticket projects argue against assuming a broad housing-cycle acceleration.
3. Macro Indicators and Market Outlook
Cboe VIX closed at 15.84, up 0.65 point or 4.28%, its highest close since August 4. Volatility therefore moved in the same direction as the equity selloff, indicating increased demand for protection and event hedging. Still, a sub-20 VIX alongside below-average cash-equity volume is more consistent with a controlled repricing than with a disorderly rush for liquidity. The key risk is whether volatility remains elevated if yields or geopolitical tensions rise again.
The rate signal was more nuanced than the intraday headlines suggested. U.S. Treasury’s official 3:30 p.m. constant-maturity marks put the 2-year yield at 4.19%, unchanged from August 17, and the 10-year at 4.71%, down 1 basis point. The 2s10s curve was therefore about +52 basis points, only slightly flatter than the prior session. Earlier, however, the 30-year yield briefly reached roughly 5.337%, its highest level since 2007, before easing. The pattern suggests that long-end term-premium, fiscal and inflation-risk concerns remained potent, while softer housing data and only modest industrial-production growth provided a counterweight. A single session should not be interpreted as confirmation of a specific Federal Reserve hike or cut path.
July macro data reinforced that two-sided policy risk. Housing starts dropped 12.4% to a 1.239 million annualized pace, while building permits rose 5.0% to 1.443 million. Industrial production increased 0.2% in July, with manufacturing output also up 0.2%. The combination points to uneven growth rather than a clean recession or reacceleration signal, leaving long-duration equity valuations unusually sensitive to both inflation news and changes in the long end of the Treasury curve.
Oil added a direct rotation channel. West Texas Intermediate crude settled 0.5% higher at $84.94 a barrel and Brent settled at $91.02 after renewed U.S.-Iran tensions raised supply-risk concerns. That move helped explain Energy’s relative strength while also keeping an inflation-risk premium embedded in longer-dated yields.
Upcoming Economic Data & Catalysts:
- Federal Reserve FOMC Minutes for the July 28-29 Meeting (Release date: August 19, 2026): Investors will focus on the breadth of inflation concern and the debate behind the 9-3 decision to hold the federal-funds target at 3.50%-3.75%, particularly because three participants preferred a 25-basis-point increase. The minutes could move Treasury term premia and rate-sensitive growth equities without guaranteeing any specific next policy action.
- Walmart Q2 FY2027 Earnings Conference Call (Release date: August 20, 2026): Walmart’s results and management commentary will provide a timely read on household demand, pricing, traffic and margin discipline. For equities, the key issue is whether consumer resilience is broad enough to support earnings expectations while higher energy costs and interest rates remain a headwind.
Only officially scheduled catalysts after the August 18 close are included above.
Market Insights:
The selloff was broader than a mega-cap-only decline: small caps underperformed, market breadth was negative and Nasdaq decliners materially outnumbered advancers. At the same time, cap-weighted technology and semiconductors magnified the index-level damage. The current rotation would be vulnerable to reversal if long-end yields spike again, breadth deteriorates further, earnings estimates are revised lower, crude-driven inflation risk intensifies or volatility breaks decisively above its recent range. Conversely, stable yields accompanied by improving breadth would weaken the case for a sustained defensive rotation.
Trading & Investment Strategy:
Position sizing should reflect the higher sensitivity of growth portfolios to long-duration rates and the rising cross-asset event risk. Investors adding equity exposure can consider scaling entries rather than chasing intraday rebounds, keeping sector concentration within predefined limits and favoring companies with visible free-cash-flow support. Energy and defensive sectors can improve portfolio balance, but one-day relative strength should not be extrapolated into guaranteed leadership. For tactical positions, define loss limits before entry, avoid excessive leverage and reassess exposure if Treasury yields, breadth or volatility move beyond the assumptions that supported the trade.
4. Key FAQs About the US Stock Market Today
Why did the US stock market move on August 18, 2026?
U.S. stocks fell because semiconductor and other high-duration growth shares were repriced against elevated long-term rate risk, while renewed geopolitical tension supported oil and increased inflation uncertainty. Softer housing starts and modest industrial-production growth pulled Treasury yields off their intraday highs, but they were not enough to reverse the equity rotation. Home Depot’s solid quarter also failed to produce a broad consumer or housing re-rating because management maintained its full-year outlook and continued to flag pressure on larger discretionary projects.
Which sectors performed best and worst in the US stock market on August 18, 2026?
Energy was the best-performing S&P 500 sector at +1.8%, helped by higher oil prices. Health Care gained 1.6% and Consumer Staples rose 1.1% as investors favored defensive earnings characteristics. Information Technology was the worst-performing sector at -1.9%, with semiconductors under especially heavy pressure. The pattern was a growth-to-value and cyclical-energy/defensive rotation rather than broad-based risk-on trading.
What should investors watch after the US stock market close on August 18, 2026?
The immediate macro catalyst is the August 19 release of the July 28-29 FOMC minutes, followed by Walmart’s August 20 earnings call. Investors should also monitor whether the 10-year and 30-year Treasury yields re-accelerate, whether market breadth stabilizes and whether VIX extends its rise. A durable change in trend is more credible when price action is confirmed by breadth, rates and earnings revisions rather than by a single index move.
Disclaimer: This article is intended solely for the exchange of investment ideas and does not constitute investment advice of any kind.