
Key Takeaways
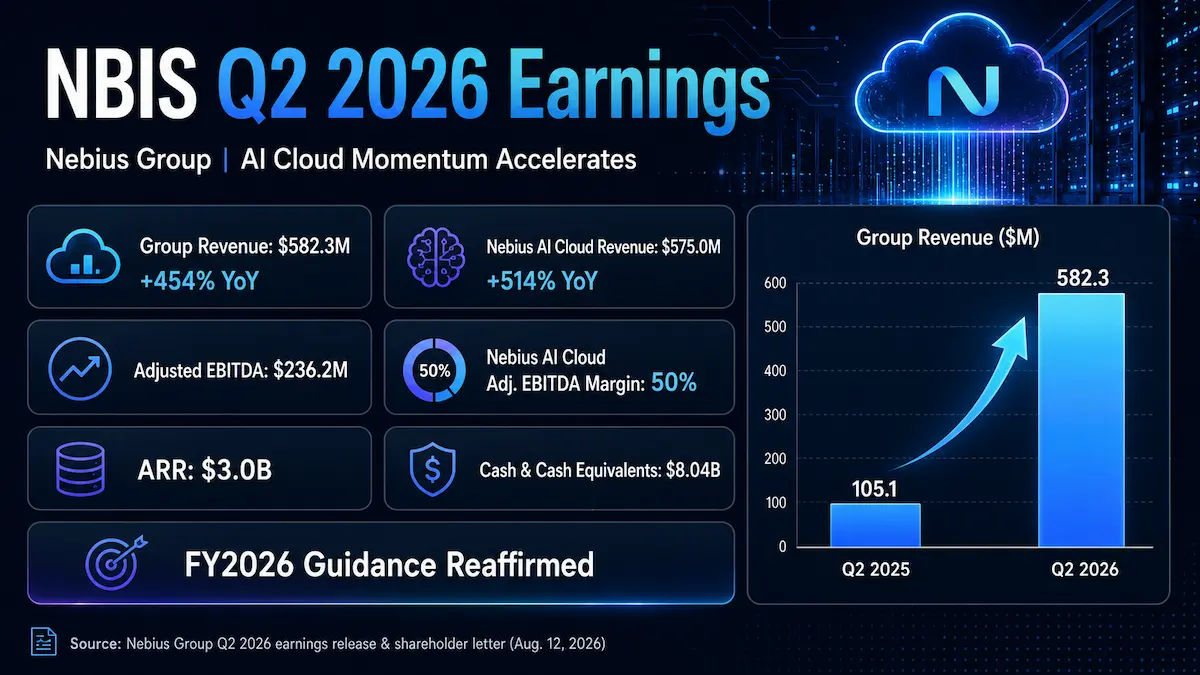
- Nebius Group reported Q2 2026 revenue of $582.3 million, up 454% year over year, while Nebius AI cloud revenue reached $574.9 million, up 514% and representing approximately 98.7% of group revenue based on company-reported figures.
- Group adjusted EBITDA reached $236.2 million, equivalent to a calculated 40.6% margin, while Nebius AI cloud delivered $285.7 million of adjusted EBITDA at a company-reported 49.7% margin. GAAP operating loss remained $175.9 million, or a calculated -30.2% operating margin.
- Commercial economics improved materially: four landmark AI cloud deals averaged more than $1 billion in total contract value each, Q2 deals carried annual contract value of roughly $20 million-$25 million per MW, and customer prepayments covered 50%-60% of associated capex on those deals.
- Management reaffirmed full-year 2026 guidance for $3.0 billion-$3.4 billion of group revenue, $7 billion-$9 billion of year-end ARR, an approximately 40% group adjusted EBITDA margin and $20 billion-$25 billion of capex, while raising the year-end contracted-power target to 5GW.
- At the August 14, 2026 closing price of $277.68, a rough equity-value proxy using the June 30 share count is about $75.5 billion, implying roughly 22.2x-25.2x full-year 2026 revenue guidance. The valuation therefore depends heavily on converting contracted power and 2027 demand into active, revenue-producing capacity.
1. Core Earnings Breakdown
Revenue and Profitability Analysis
Nebius delivered another step-change quarter rather than a routine high-growth print. Group revenue increased 454% year over year to $582.3 million and rose 46% sequentially. The key driver was not a broad mix of businesses: it was overwhelmingly the core AI cloud operation, where capacity additions, higher utilization and stronger pricing combined to accelerate monetization.
- Nebius AI cloud: Q2 revenue was $574.9 million, up 514% year over year. Dividing $574.9 million by $582.3 million gives approximately 98.7% of group revenue, calculated from company-reported figures. Investment view: NBIS is increasingly a pure-play AI infrastructure and AI cloud earnings story, so the stock’s fundamental sensitivity to GPU utilization, pricing, power availability and customer deployment schedules is rising rather than falling.
- Avride and TripleTen: Nebius did not disclose separate Q2 revenue for these businesses. The implied residual after subtracting AI cloud revenue from group revenue is approximately $7.4 million, calculated from company-reported figures, but that residual should not be treated as a clean segment-revenue figure because eliminations and other items may be included. Investment view: the non-core businesses currently provide strategic optionality but remain economically secondary to the cloud franchise and continue to dilute group-level adjusted EBITDA relative to the AI cloud segment.
Profitability improved much faster than revenue scale alone would suggest. Group adjusted EBITDA was $236.2 million versus a $21.0 million loss a year earlier. The resulting adjusted EBITDA margin was approximately 40.6%, calculated as $236.2 million divided by $582.3 million, consistent with the company’s rounded 41% disclosure. Nebius AI cloud generated $285.7 million of adjusted EBITDA at a 49.7% margin.
The GAAP picture remains far more capital-intensive. Nebius reported a $175.9 million operating loss, producing a calculated GAAP operating margin of -30.2%. Depreciation and amortization was $259.7 million, or approximately 45% of revenue, reflecting the enormous installed base of GPU and data-center assets. Total share-based compensation was $102.5 million, while product-development expense included $115.9 million of non-recurring share-based compensation and post-combination expense related to the Eigen AI acquisition.
This divergence matters for valuation. Adjusted EBITDA shows that deployed AI capacity can generate strong operating leverage, but GAAP operating income and cash economics still carry the burden of depreciation, acquisition-related costs and extraordinary capital intensity.
Expectations vs. Actual Results
- Revenue: $582.3 million actual versus approximately $570 million Wall Street consensus reported before earnings — ✅ Beat by about $12.3 million, or 2.2%.
- GAAP EPS: -$0.68 actual versus approximately -$0.72 consensus — ✅ Beat by $0.04 per share.
- GAAP operating margin: -30.2% actual, calculated from the company-reported $175.9 million operating loss and $582.3 million of revenue. A directly comparable, broadly published pre-earnings GAAP operating-margin consensus was not available in the major sources reviewed, so no estimate is fabricated here.
- Profitability proxy: adjusted EBITDA was $236.2 million versus approximately $169 million consensus — ✅ Beat by roughly 39.8%. Using the same $570 million revenue consensus, the implied expected adjusted EBITDA margin was about 29.6%, versus 40.6% actual.
The real source of the beat was operating leverage in AI cloud, not accounting noise around EPS. Revenue exceeded expectations modestly, but adjusted EBITDA exceeded consensus by nearly 40%. Higher utilization, stronger pricing, early contributions from the asset-light model, Token Factory and recent acquisitions allowed incremental revenue to convert into adjusted EBITDA unusually efficiently.
Investors also need to be careful with adjusted EPS figures circulating on market-data services. Nebius’s official Q2 press release reports GAAP EPS and adjusted net loss, but it does not report a company-defined adjusted EPS figure. For that reason, this analysis uses GAAP EPS when comparing the quarter with pre-earnings expectations.
The market appears to have cared more about margin, customer economics, pricing power and the 2027 pipeline than about a formal 2026 guidance raise. Full-year financial guidance was reiterated rather than increased, yet the stock rose roughly 34% on the earnings day. That reaction is consistent with investors assigning more value to four billion-dollar-plus deals, the $20 million-$25 million per MW economics, the shorter payback period, higher short-term capacity pricing and the raised contracted-power target.
There was no standalone numerical Q3 revenue or EPS guide. Management said capacity deployed late in Q2 should begin contributing to revenue in Q3, while some newly signed higher-priced capacity contracts are expected to come online later in the year and are not expected to materially change 2026 revenue guidance. Full-year 2026 guidance was reaffirmed at $3.0 billion-$3.4 billion of group revenue, $7 billion-$9 billion of year-end ARR, approximately 40% group adjusted EBITDA margin and $20 billion-$25 billion of capex. Management also maintained an 800MW-1GW year-end connected-power target while raising contracted power to 5GW.
NBIS closed at $277.68 on August 14, 2026, up 8.8% in that session. The persistence of the post-earnings rally reinforces the message from the initial reaction: investors did not treat the lack of a full-year revenue raise as a disappointment because the more important forward indicators improved.
Earnings Call Highlights
Management’s core point: Nebius believes it could sell its entire planned 2027 capacity at current mid-term deal economics, but it is deliberately retaining some capacity for potentially higher-value short-term demand.
💡 Reading Between the Lines: This is a deliberate capacity-allocation strategy, not simple backlog maximization. Management is effectively choosing pricing optionality over maximum forward coverage, which can lift realized revenue per MW if scarcity persists but raises execution risk if pricing normalizes before the reserved capacity is sold.
Management’s core point: Q2 landmark AI cloud contracts averaged more than $1 billion in total contract value and roughly $20 million-$25 million of annual contract value per MW, while shorter-duration capacity is being discussed at roughly $40 million-$50 million per MW or above.
💡 Reading Between the Lines: The important signal is not only demand volume but price discovery. Nebius is attempting to transform scarce GPU capacity into a yield-management asset, using contract duration and auctions to optimize revenue per MW rather than selling every unit under long contracts at one fixed price.
Management’s core point: Roughly 70% of Q2 deals included prepayments, Q2 deal prepayments covered 50%-60% of associated capex, and Nebius expects more than $9 billion of customer prepayments in 2026.
💡 Reading Between the Lines: Customer financing is becoming a core part of the capital structure. If this model scales, NBIS can partially transfer buildout financing to customers and reduce dependence on equity issuance, but the company still needs debt and capital markets because total 2026 capex is guided to $20 billion-$25 billion.
Management’s core point: The new asset-light model allows partners to finance, build and operate infrastructure while Nebius supplies its full-stack cloud platform, architecture and customer demand.
💡 Reading Between the Lines: This could change the valuation framework if it becomes material. A larger software-and-services layer on third-party infrastructure would require less balance-sheet capital and could support structurally higher returns on invested capital than the owned-GPU model, but management also described the initiative as early-stage.
Management’s core point: The year-end contracted-power target increased to 5GW, but connected-power guidance remains 800MW-1GW, and connected capacity still requires commissioning, networking, cluster deployment, platform deployment and customer onboarding before it becomes revenue-producing.
💡 Reading Between the Lines: Investors should not treat 5GW as near-term active capacity. The commercial upside is large, but the gap between contracted, connected and active power is the central execution bridge in the NBIS model and one of the most important variables for 2027 revenue timing.
2. Deep Business Insights
Hidden Metrics That Matter
One underappreciated metric is the conversion gap between contracted power and connected power. Management now targets 5GW of contracted power by year-end 2026 but still expects only 800MW-1GW of connected power. The simple ratio is 0.8GW ÷ 5GW = 16% at the low end and 1.0GW ÷ 5GW = 20% at the high end, calculated from company-reported figures. This is not a utilization metric, but it illustrates how much of the headline future footprint may still be several operational steps away from revenue generation.
A second hidden metric is the gap between positive operating cash flow and true infrastructure cash consumption. Q2 operating cash flow was $2.246 billion, while purchases of property, equipment and intangible assets were $5.657 billion. A simple free-cash-flow proxy is therefore $2.246 billion minus $5.657 billion = approximately -$3.411 billion, calculated from company-reported figures. This proxy is not a company-defined non-GAAP measure, but it shows why customer prepayments and financing remain essential even after the business turns strongly positive on adjusted EBITDA. Q2 operating cash flow was also materially influenced by working capital, including a $1.197 billion increase in deferred revenue.
Another useful profitability lens is the difference between AI cloud and group adjusted EBITDA. AI cloud adjusted EBITDA of $285.7 million exceeded group adjusted EBITDA of $236.2 million by $49.5 million, calculated from company-reported figures. That gap reflects investments in Avride and TripleTen and shows that the core AI cloud economics are already materially stronger than the consolidated numbers.
Why are customers choosing Nebius? The company is selling more than access to GPUs. Its differentiation is the combination of scarce high-performance capacity, an integrated full-stack cloud, training and inference on one platform, open-model support, optimization software and technical collaboration. The shareholder letter highlighted a large U.S. quantitative trading customer that chose Nebius for speed and reliability at scale, while Basecamp Research reported training its model 20 times faster than in its prior internal environments. For customers whose model-development cycles are worth far more than the infrastructure bill, time-to-compute, cluster reliability and integrated tooling can justify premium pricing.
Industry Chain Reactions
- ✅ Benefit — Bloom Energy (NYSE: BE): Nebius has a long-term partnership to deploy behind-the-meter fuel cells as part of its power strategy. If Nebius continues scaling toward a multi-gigawatt footprint, the read-through is favorable for providers that can deliver reliable onsite power where grid interconnection is a bottleneck. This is a directional industry read-through, not a forecast of Bloom Energy revenue.
- ❌ Face Pressure — CoreWeave (NASDAQ: CRWV): Nebius is demonstrating that an independent AI cloud can win billion-dollar-scale contracts, command premium per-MW pricing and create new auction and short-duration products. That strengthens competition for high-value AI workloads and customer commitments. The pressure is competitive rather than necessarily cyclical: strong AI infrastructure demand can still allow both companies to grow rapidly.
Valuation Framework and Key Risks
At the August 14 closing price of $277.68, valuation already assumes that Q2’s economics are not a temporary peak. Nebius reported 271.855 million shares outstanding at June 30. Multiplying that quarter-end share count by $277.68 produces a rough $75.5 billion equity-value proxy, calculated from company-reported figures and the latest closing price. This is not a company-reported current market capitalization because the share count can change after quarter-end, particularly while the ATM program remains available.
Against full-year 2026 revenue guidance of $3.0 billion-$3.4 billion, that equity-value proxy represents roughly 25.2x revenue at the low end of guidance and 22.2x at the high end. Against year-end ARR guidance of $7 billion-$9 billion, the same proxy equates to roughly 10.8x at the low end and 8.4x at the high end. ARR is based on the final month’s AI cloud revenue annualized and is not the same as forward GAAP revenue, so it should be used only as a rough scaling lens.
The valuation can work if three things remain true simultaneously: Nebius converts its contracted-power pipeline into active capacity on schedule, pricing per MW remains structurally elevated, and high-margin software, inference and asset-light revenue grows faster than capital requirements. The current share price leaves limited room for a major break in any of those assumptions.
- Capacity execution risk: 5GW is contracted power, not 5GW of live, revenue-producing infrastructure. Permitting, construction, grid connection, networking, GPU deployment and customer onboarding can delay monetization.
- Pricing normalization risk: Q2 and early Q3 pricing reflects an unusually supply-constrained AI compute market. If GPU availability broadens or hyperscalers add excess capacity, short-term prices of $40 million-$50 million per MW may not represent a sustainable steady-state level.
- Capital and dilution risk: Q2 capex was approximately $5.7 billion, full-year capex remains $20 billion-$25 billion, and Nebius sold 12.7 million Class A shares through its ATM program at an average price of $223.60 for approximately $2.8 billion of gross proceeds. Customer prepayments lower financing needs, but they do not eliminate them.
- GAAP-versus-adjusted profitability risk: adjusted EBITDA is strong, but Q2 still produced a $175.9 million operating loss and $259.7 million of depreciation and amortization. Nebius also changed the useful life of server and network equipment to five years from four years beginning in 2026, which investors should incorporate when comparing GAAP depreciation trends across periods.
- Concentration risk: approximately 98.7% of Q2 group revenue came from the AI cloud business based on company figures. That purity is attractive during an AI infrastructure boom, but it also concentrates the investment case around one capital-intensive demand cycle.
3. Key FAQs
Did NBIS beat Q2 2026 earnings expectations?
Yes. Nebius reported Q2 revenue of $582.3 million versus approximately $570 million consensus and GAAP EPS of -$0.68 versus approximately -$0.72 expected. The larger surprise was adjusted EBITDA: $236.2 million versus roughly $169 million expected, showing significantly better operating leverage than the headline revenue beat alone suggests.
What is NBIS 2026 revenue guidance after Q2 2026 earnings?
Nebius reaffirmed full-year 2026 group revenue guidance of $3.0 billion-$3.4 billion. It also reaffirmed year-end ARR guidance of $7 billion-$9 billion, an approximately 40% group adjusted EBITDA margin and $20 billion-$25 billion of capex. The company did not issue a standalone numerical Q3 revenue guide, but management expects capacity deployed late in Q2 to begin contributing in Q3.
Is NBIS stock expensive after Q2 2026 earnings?
On near-term revenue, the valuation is demanding. Using the August 14 closing price of $277.68 and the June 30 share count produces a rough $75.5 billion equity-value proxy, equivalent to approximately 22.2x-25.2x 2026 revenue guidance. Investors paying that multiple are effectively underwriting much larger 2027 revenue, continued premium pricing, successful power-to-revenue conversion and an increasing mix of higher-margin software and asset-light revenue.
Source note: Nebius’s official Investor Relations pages currently provide the Q2 2026 earnings release, shareholder letter and official webcast replay, but no separate company-hosted text transcript was located at the time of publication. Financial figures and guidance in this article are anchored to official company materials; call-specific wording and Q&A details were cross-checked against contemporaneous transcript copies and reconciled with those official disclosures.
Primary sources: Nebius Q2 2026 official financial results, Nebius official financials archive, and the official Q2 2026 earnings webcast replay. Consensus and market-reaction checks were also compared with Investors Business Daily and Reuters.
Disclaimer: This article/chart is for educational and informational purposes only and does not constitute investment advice of any kind. Past performance is not indicative of future results. Investors should independently evaluate their own risks.