Key Takeaways
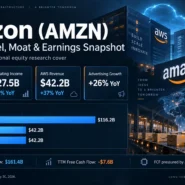
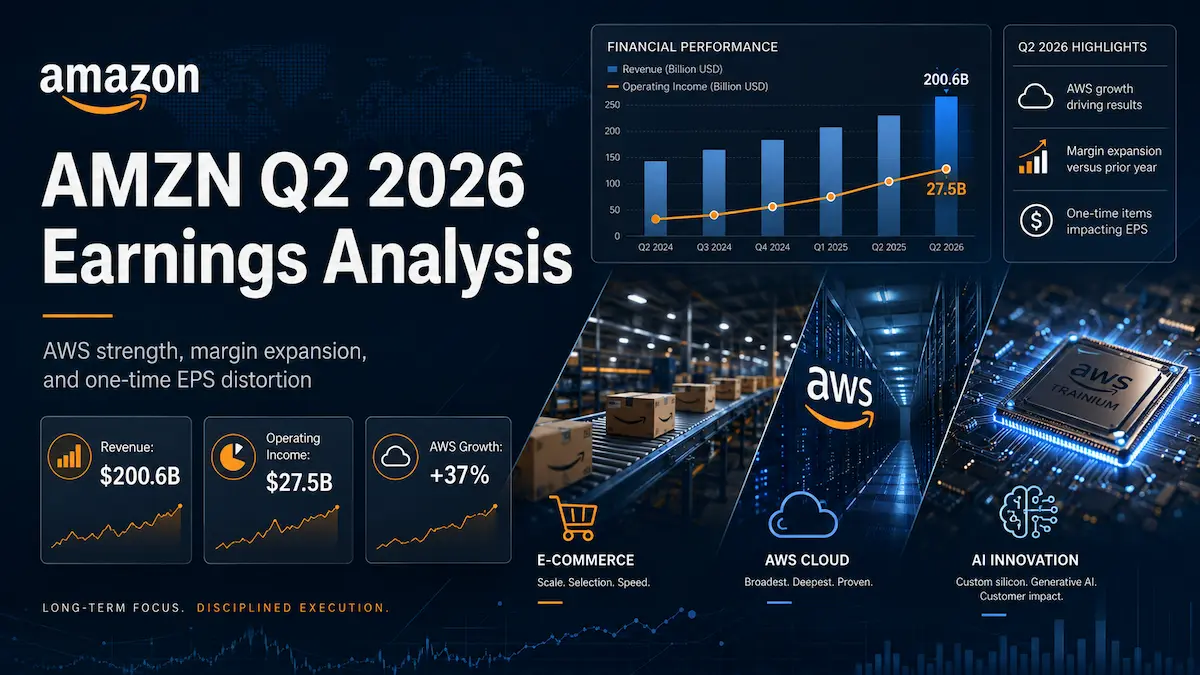
- Amazon reported Q2 2026 net sales of $200.6 billion, up 20% year over year and about $3.6 billion above the roughly $197.0 billion consensus.
- AWS was the decisive upside driver: revenue increased 37% to $42.2 billion and operating margin expanded to 39.4%, materially above the 33.8% Visible Alpha consensus margin.
- GAAP diluted EPS of $5.75 was not a clean measure of operating performance because net income included $53.4 billion of pre-tax non-operating income, primarily from Amazon’s Anthropic investment.
- AWS generated 60.5% of consolidated operating income and approximately 77.9% of the year-over-year increase in operating profit, calculated from company-reported figures.
- The central valuation trade-off is now explicit: AWS demand and a $496 billion backlog support a larger earnings base, but approximately $220 billion of planned 2026 cash capital expenditure has pushed trailing free cash flow to negative $7.6 billion.
Amazon’s Q2 2026 report was stronger than the headline EPS number suggests, but for the opposite reason investors usually associate with that statement. The reported $5.75 of GAAP diluted EPS was inflated by a large non-operating investment gain. The higher-quality signal came from the income statement above the tax line: consolidated operating income rose 43% to $27.5 billion, AWS growth accelerated to its fastest pace in 18 quarters, and the cloud segment delivered a 39.4% operating margin while absorbing an unprecedented infrastructure buildout.
The post-earnings re-rating was therefore not a simple reaction to an EPS beat. It reflected a change in the market’s view of Amazon’s AI capital cycle. Before the report, the principal concern was that hyperscaler spending was running ahead of monetization. After the report and call, investors had evidence that Amazon was capacity-constrained, that much of its 2027 compute capacity was already reserved, and that contracted AWS backlog had increased to $496 billion. The remaining question is not whether demand exists today; it is whether Amazon can convert that demand into durable free cash flow at a satisfactory return on invested capital.
1. Core Earnings Breakdown
Revenue and Profitability Analysis
Q2 net sales were $200.606 billion, up 19.6% on an unrounded basis and 20% as reported by the company. Foreign exchange contributed only $0.1 billion, so operational growth excluding currency was also 20%. This was a clean top-line acceleration rather than a currency-assisted result. Consolidated operating income increased from $19.171 billion to $27.461 billion, and operating margin expanded from 11.4% to 13.7%, a 226-basis-point improvement calculated from company-reported figures.
- North America: Sales increased 16% to $116.177 billion, representing 57.9% of consolidated revenue. Operating income rose 21% to $9.123 billion, while segment margin improved modestly to 7.9% from 7.5%. Investment judgment: retail execution remained solid, but the limited margin expansion indicates that faster delivery, Prime Day activity and shipping-cost growth absorbed much of the gross profit benefit.
- International: Sales increased 15% to $42.197 billion, with the same 15% growth rate excluding foreign exchange. Operating income reached $1.717 billion and margin was 4.1%, essentially unchanged year over year. Investment judgment: the segment is now structurally profitable, but Q2 did not demonstrate a new margin inflection; the value lies in reducing consolidated earnings volatility rather than driving the quarter’s upside.
- AWS: Sales increased 37% to $42.232 billion, or 21.1% of total revenue. Operating income increased 64% to $16.621 billion, and margin expanded from 32.9% to 39.4%. Investment judgment: this was the quarter’s decisive change in earnings power because AWS delivered both acceleration and operating leverage despite heavy AI infrastructure investment.
The revenue mix also improved below the segment level. Online stores grew 15% to $70.432 billion, third-party seller services grew 16% to $46.780 billion, advertising services grew 26% to $19.809 billion, subscription services grew 12% to $13.730 billion, and AWS grew 37% to $42.232 billion. Advertising and AWS are especially important because they add high-value service revenue without requiring Amazon to own retail inventory.
Product and service revenue provide the cleanest view of the portfolio transition. Net product sales rose 13.7% to $77.602 billion, while net service sales rose 23.7% to $123.004 billion. Services therefore represented 61.3% of Q2 revenue, up from 59.3% a year earlier. This shift matters because the fastest-growing parts of Amazon increasingly monetize infrastructure, marketplace participation, advertising demand and subscriptions rather than first-party merchandise.
GAAP net income was $62.647 billion and GAAP diluted EPS was $5.75. However, Amazon disclosed $53.4 billion of pre-tax non-operating income, primarily from its Anthropic investment. Amazon did not publish an adjusted EPS figure, and it would be inappropriate to manufacture one without the investment-specific tax effect and other reconciliation items. For operating analysis, consolidated operating income and segment margins are more reliable than the reported EPS comparison.
Expectations vs. Actual Results
Metric | Q2 2026 Actual | Consensus or Reference | Result |
|---|---|---|---|
Total net sales | $200.6 billion | Approximately $197.0 billion | ✅ Beat by about $3.6 billion, or 1.8% |
GAAP diluted EPS | $5.75 | Approximately $1.82 | ✅ Reported beat, but dominated by the Anthropic-related non-operating gain |
Operating income | $27.5 billion | More than $23.5 billion | ✅ Beat by roughly $4.0 billion |
Consolidated operating margin | 13.7% | Approximately 11.9%, calculated as $23.5 billion divided by $197.0 billion | ✅ Beat by approximately 180 basis points |
AWS revenue | $42.2 billion | Approximately $40.5 billion | ✅ Beat by approximately $1.7 billion |
AWS operating margin | 39.4% | 33.8% Visible Alpha consensus | ✅ Beat by approximately 560 basis points |
Q3 2026 net sales guidance | $197.0 billion to $202.0 billion; 9% to 12% reported growth | Midpoint of $199.5 billion; approximately 80 basis points of FX headwind | ⚠️ Reported growth decelerates because Prime Day moved into Q2; underlying growth would be nearly 400 basis points higher excluding Prime Day in both periods |
Q3 2026 operating income guidance | $22.5 billion to $26.5 billion | $17.4 billion in Q3 2025 | ✅ Midpoint implies approximately 41% year-over-year growth and a 12.3% operating margin |
The beat came primarily from AWS revenue and margin, not from an unusually favorable retail mix. AWS revenue was about $1.7 billion above the Visible Alpha expectation, and its 39.4% margin was far above the 33.8% consensus. That combination explains why operating income exceeded the pre-earnings forecast by roughly $4 billion. North America and International remained profitable, but neither produced the same magnitude of incremental earnings.
The EPS comparison is mechanically large but economically weak. The $53.4 billion pre-tax non-operating gain was almost twice consolidated operating income for the quarter. Investors should not capitalize that mark-to-market gain as recurring earnings, nor should they interpret Amazon’s reported trailing P/E without adjusting mentally for the investment revaluation. The operating-income beat is the more investable surprise.
The market placed greater weight on AWS growth, AWS margin, contracted backlog and management’s capacity commentary than on product sales or the Q3 headline growth rate. Q3 guidance looks slower because Prime Day shifted into Q2. Amazon explicitly stated that Q3 year-over-year growth would be nearly 400 basis points higher if Prime Day were excluded from both periods. This is a timing distortion, not evidence that underlying demand suddenly fell after June.
The share-price response confirmed that interpretation. AMZN closed at $235.50 before the release, rose about 9.2% in after-hours trading to roughly $257.04, and closed the next regular session at approximately $264.33, a gain of about 12.2%. By the latest August 3 close, the shares were $284.02, approximately 20.6% above the pre-earnings close. The sustained advance despite a higher capital-spending plan shows that investors viewed the spending increase as demand-backed capacity expansion rather than uncontrolled cost inflation.
Earnings Call Highlights
- Management raised expected 2026 cash capital expenditure to approximately $220 billion from about $200 billion, partly because memory costs increased, while stating that capacity would still be insufficient for 2026 demand. 💡 Reading Between the Lines: Amazon is asking investors to accept near-term free-cash-flow compression because the constraint is supply, not customer demand. The valuation case therefore depends on disciplined deployment and utilization rather than on reducing investment immediately.
- Management said the lion’s share of AWS capacity being added in 2027 was already reserved and that a meaningful amount of 2028 capacity was also committed. 💡 Reading Between the Lines: Multi-year reservations reduce the probability that today’s infrastructure build is purely speculative. They do not eliminate counterparty, pricing or cancellation risk, but they improve revenue visibility enough to justify a longer-duration capital plan.
- AWS backlog ended the quarter at $496 billion, up from $364 billion at the end of Q1, while management emphasized strength across both AI and non-AI workloads. 💡 Reading Between the Lines: The reacceleration is broader than model training alone. Core cloud migrations, databases, analytics and enterprise modernization can stabilize utilization if the most speculative AI demand becomes volatile.
- Management explained that data-center spending can begin roughly two years before a facility opens, while a data-center shell may generate revenue for decades and AI servers can recover their cost much faster. 💡 Reading Between the Lines: The accounting mismatch is central: cash leaves before revenue arrives, so free cash flow deteriorates before operating profit fully reflects the installed capacity. Investors should model vintage-level returns rather than extrapolate the current free-cash-flow trough indefinitely.
- Amazon highlighted annual revenue run rates above $25 billion for both its AWS AI business and its chips business, alongside expanding Trainium and Graviton adoption. 💡 Reading Between the Lines: Custom silicon is becoming a strategic margin and supply-chain lever, not merely a cost-saving experiment. Successful adoption can lower dependence on merchant accelerators, improve price-performance and increase AWS differentiation, but it also raises execution risk in chip design, software tooling and capacity planning.
2. Deep Business Insights
Hidden Metrics That Matter
Metric 1: AWS supplied approximately 77.9% of Amazon’s incremental operating income. The calculation is ($16.621 billion minus $10.160 billion) divided by ($27.461 billion minus $19.171 billion) = $6.461 billion divided by $8.290 billion = 77.9%. This is calculated from company-reported figures. AWS also represented 60.5% of total Q2 operating income, calculated as $16.621 billion divided by $27.461 billion.
This concentration is positive for earnings quality because AWS has recurring usage economics, long customer relationships and high incremental margins. It also increases valuation sensitivity. A five-point change in AWS growth or a few hundred basis points of segment margin now has a larger effect on consolidated value than a similar change in retail revenue.
Metric 2: Amazon’s service-revenue mix crossed 61%. The calculation is $123.004 billion of net service sales divided by $200.606 billion of total sales = 61.3%, compared with $99.456 billion divided by $167.702 billion = 59.3% in Q2 2025. The increase was approximately 201 basis points and is calculated from company-reported figures. Service sales grew 23.7%, compared with 13.7% growth in product sales.
This mix shift explains why Amazon can expand operating profit faster than revenue even while investing heavily. AWS, advertising, third-party seller services and subscriptions monetize Amazon’s infrastructure, audience and ecosystem without requiring an equivalent increase in owned inventory. Over time, a higher service mix should reduce the amount of consolidated revenue growth required to produce each incremental dollar of operating profit.
Customers choose AWS because Amazon can combine global infrastructure, security and governance, a broad model catalog through Bedrock, proprietary processors such as Trainium and Graviton, and integration with existing enterprise workloads. The proposition is not simply cheaper compute. It is the ability to choose among models and chips, deploy at scale, and keep data, observability and application services within one operating environment. Amazon reported that Graviton is used by 98% of its top 1,000 EC2 customers and that Bedrock added more customers in the last six months than in its first two years, reinforcing the ecosystem effect.
The $496 billion backlog adds another layer of visibility. Compared with $148.404 billion of trailing-twelve-month AWS revenue, backlog equals approximately 3.34 times annual AWS sales, calculated from company-reported figures and management’s call disclosure. The ratio should not be interpreted as one-year revenue because contracts extend over multiple years and may include variable consumption, but it demonstrates that the investment program is supported by commitments far beyond the current quarter.
Industry Chain Reactions
- ✅ Benefit — Micron Technology (NASDAQ: MU): Amazon attributed part of the increase in its 2026 capital-spending plan to higher memory costs while also describing persistent compute-capacity shortages. Amazon did not identify specific suppliers, so this is an industry inference rather than a disclosed customer relationship. Nevertheless, a larger hyperscaler buildout and constrained memory supply are supportive of data-center DRAM and high-bandwidth-memory demand and pricing.
- ❌ Face Pressure — NVIDIA (NASDAQ: NVDA): NVIDIA remains a near-term beneficiary of aggregate AI infrastructure spending, but Amazon’s chips business exceeding a $25 billion annual run rate creates a medium-term mix risk. Broader Trainium adoption can shift a portion of AWS accelerator spending toward internally designed silicon, improve Amazon’s bargaining power and cap the share of hyperscaler economics captured by merchant GPU suppliers.
Valuation Framework and Key Risks
At $284.02 per share as of the August 3, 2026 close, Amazon’s market capitalization was approximately $3.097 trillion. The quoted trailing P/E was about 22.9 times on trailing EPS of roughly $12.43, but that multiple is optically cheap because trailing earnings include large Anthropic-related gains. A more conservative operating framework is required.
Using the latest market capitalization, $128.894 billion of long-term debt, $78.213 billion of cash and $44.775 billion of marketable securities, a simplified enterprise value is approximately $3.103 trillion. The calculation is $3.097 trillion + $128.894 billion – $78.213 billion – $44.775 billion. This simplified estimate excludes lease liabilities, short-term financing details and the fair value of non-operating investments. Against $93.712 billion of trailing operating income, the implied enterprise-value-to-operating-income multiple is approximately 33.1 times. Against $775.680 billion of trailing revenue, EV-to-sales is approximately 4.0 times. Both are calculated from company-reported balance-sheet and operating figures plus the current market value.
The multiple is demanding because trailing free cash flow is negative, but it is not analytically comparable with a low-growth retailer. AWS produced $148.404 billion of trailing revenue and $54.681 billion of trailing operating income at a 36.8% margin. Advertising is running near an $80 billion annualized revenue rate based on Q2. These assets deserve materially higher multiples than first-party commerce, while the retail network, Prime ecosystem and third-party marketplace provide traffic, data and distribution advantages that reinforce the higher-margin businesses.
A reasonable valuation framework should test three operating conditions rather than rely on reported P/E:
- Upside case: AWS sustains growth near or above 30% for several quarters, segment margin remains in the high 30s, advertising maintains growth above 20%, and capital expenditure begins declining as a percentage of revenue after the current capacity wave becomes productive.
- Base case: AWS growth normalizes into the mid-20% range, retail margins remain around current levels, advertising grows in the high teens to low 20s, and free cash flow recovers gradually as new data-center capacity enters service.
- Downside case: AWS growth falls toward the low 20s before capital intensity peaks, memory and power costs stay elevated, committed capacity converts more slowly than expected, and competition forces lower AI-compute pricing or higher customer incentives.
The current valuation implies that the market expects Amazon to convert today’s backlog into a substantially larger operating-profit base and eventually restore free-cash-flow conversion. It does not require the $53.4 billion Anthropic gain to recur, but it does require AWS growth and margins to remain strong enough to justify a capital program that now exceeds the annual revenue of most S&P 500 companies.
Key risks include the duration of negative free cash flow, execution and utilization risk across data-center vintages, concentration within large AI contracts, rising debt and interest expense, memory and energy inflation, custom-silicon software compatibility, price competition from Microsoft Azure and Google Cloud, retail margin pressure after the Prime Day timing benefit, tariff exposure, regulatory intervention and future volatility in Anthropic’s valuation. The investment case weakens materially if capacity additions cease to produce proportional revenue and operating-income growth.
3. Key FAQs
Did Amazon beat Q2 2026 earnings expectations?
Yes. Amazon reported $200.6 billion of revenue versus approximately $197.0 billion expected and $27.5 billion of operating income versus a forecast above $23.5 billion. GAAP EPS of $5.75 also exceeded the roughly $1.82 consensus, but that comparison was distorted by $53.4 billion of pre-tax non-operating income, primarily from Amazon’s Anthropic investment. The higher-quality beat came from AWS revenue and margin.
Why was Amazon’s Q2 2026 EPS so high?
Amazon’s GAAP net income included a $53.4 billion pre-tax non-operating gain, primarily related to its Anthropic investment. This was not AWS revenue, advertising profit or retail operating income. Amazon did not provide adjusted EPS, so investors should focus on operating income, segment margins and cash flow when assessing recurring earnings power.
Is AMZN expensive after the Q2 2026 earnings rally?
The reported trailing P/E of about 22.9 times understates the economic valuation because trailing EPS includes large investment gains. A simplified enterprise-value-to-trailing-operating-income multiple is approximately 33.1 times, while trailing free cash flow is negative. The valuation can be supported if AWS sustains strong growth, backlog converts at attractive margins and capital intensity normalizes. It becomes vulnerable if cloud growth slows before the infrastructure cycle produces cash returns.
Primary sources: Amazon Q2 2026 earnings release, Amazon’s official Q2 2026 earnings call webcast and slides, S&P Global Visible Alpha pre-earnings expectations, and Reuters earnings-call reporting. Amazon’s Investor Relations page provides the official webcast and slides but did not publish a verbatim written transcript at the time of publication; call summaries above were verified against the official webcast materials and cross-checked with public transcript reporting.
Disclaimer: This article/chart is for educational and informational purposes only and does not constitute investment advice of any kind. Past performance is not indicative of future results. Investors should independently evaluate their own risks.