Key Takeaways
- Amazon’s economic engine is no longer best understood as retail. The company uses retail demand to create transaction volume, then monetizes that demand through third-party seller services, advertising, subscriptions, logistics, and a broader infrastructure stack led by AWS.
- The most defensible moats are cost advantages and switching costs. In commerce, fulfillment density, inventory placement, robotics, and Prime reinforce lower unit costs and faster delivery. In cloud, workload integration, data gravity, custom silicon, security, and a broad service layer raise the cost and complexity of moving away.
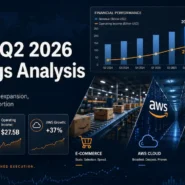
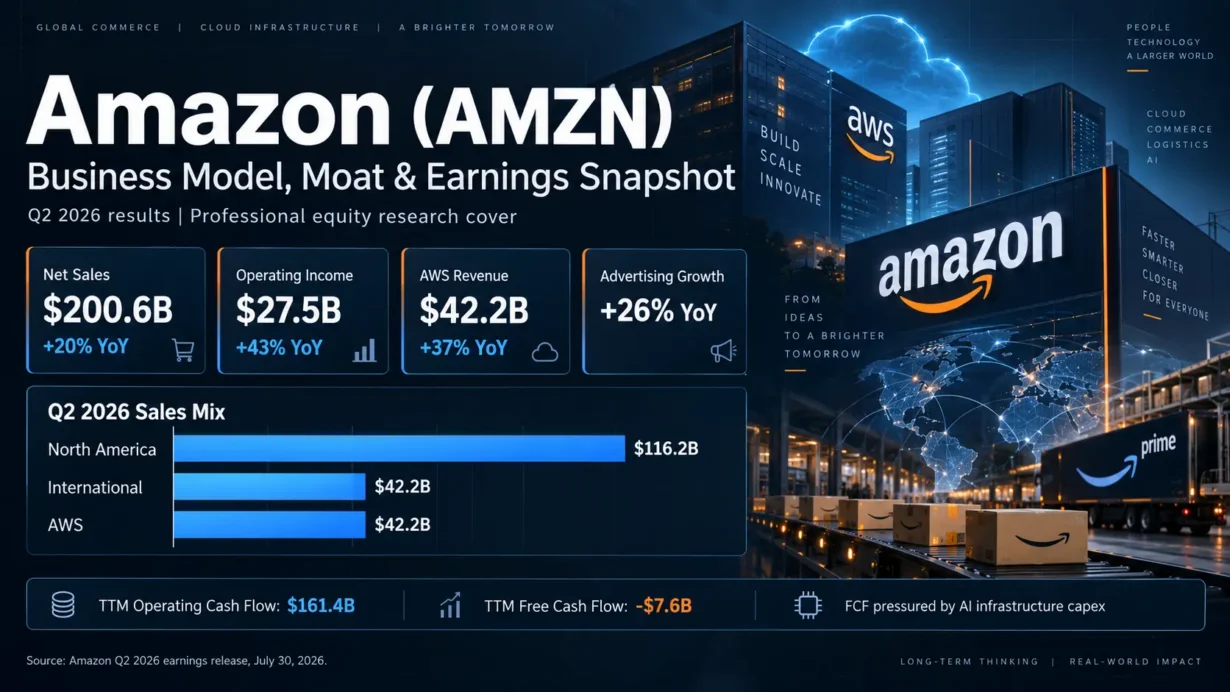
- Revenue mix is steadily shifting toward service businesses that can carry structurally better economics than first-party retail. In Q2 2026, AWS revenue grew 37% year over year to $42.2 billion and advertising services grew 26% to $19.8 billion.
- AI is both the largest near-term catalyst and the largest capital-allocation test. Amazon is spending heavily on data centers, power, networking, and chips, while free cash flow has temporarily compressed. The central question is whether contracted AI demand converts into durable revenue and attractive returns on invested capital.
- The principal risks are not simply “slower e-commerce growth.” They include cloud and AI price competition, capital intensity, regulatory and antitrust pressure, seller dependence, semiconductor and power constraints, and the possibility that AI-driven product discovery weakens Amazon’s position as the starting point for commerce.
1. Business Model Breakdown
Amazon is a multi-layer monetization system, not a single retail business
The core of the Amazon business model is the repeated conversion of customer demand into reusable infrastructure and then the repeated monetization of that infrastructure. Retail brings consumers into the ecosystem. Marketplace sellers expand selection without requiring Amazon to own every unit of inventory. Prime increases purchase frequency and makes fast delivery a habit. Fulfillment services turn logistics capabilities into seller-facing revenue. Advertising monetizes high-intent shopping traffic. AWS commercializes the computing infrastructure and engineering primitives that Amazon originally had to build for itself.
That architecture matters because the accounting presentation can obscure the economic structure. Amazon records first-party product sales on a gross basis, while third-party marketplace transactions are largely represented by commissions, fulfillment fees, shipping fees, and other seller-service revenue. Therefore, simply comparing reported revenue by category understates the economic importance of the marketplace: a dollar of third-party seller service revenue can sit on top of several dollars of underlying merchandise volume that does not appear as Amazon revenue.
Commerce: low-margin volume creates higher-margin monetization surfaces
In Q2 2026, online stores generated $70.4 billion of revenue, physical stores $5.8 billion, and third-party seller services $46.8 billion. The strategic role of the first-party retail business is larger than its direct margin contribution. It keeps selection broad, supports traffic, gives Amazon pricing visibility, and helps maintain a high-frequency customer relationship. That traffic then supports marketplace commissions, Fulfillment by Amazon fees, Prime membership economics, and advertising demand.
The marketplace is particularly important because it shifts inventory risk to third-party merchants while allowing Amazon to monetize the same customer base through multiple fee layers. Independent sellers account for more than 60% of unit sales in Amazon’s store, according to the company. FBA then deepens the relationship by putting seller inventory inside Amazon’s fulfillment network, where it can qualify for Prime delivery and benefit from Amazon’s warehouse, transportation, and customer-service systems.
This produces a commercial flywheel with a specific economic sequence: more sellers expand selection; broader selection improves customer utility; higher customer traffic attracts more sellers; more seller activity creates more demand for fulfillment and advertising; higher package density can lower delivery cost per unit; lower cost can be reinvested into price and speed, which can increase conversion and order frequency. The moat does not come from scale by itself. It comes from whether scale creates a persistent unit-cost or customer-experience advantage that smaller competitors cannot economically replicate.
Advertising: monetizing purchase intent rather than generic attention
Advertising services generated $19.8 billion in Q2 2026, up 26% year over year. Amazon does not disclose advertising operating income as a standalone segment, so any claim about a precise advertising margin would be speculative. The business is nevertheless strategically important because ads monetize traffic that Amazon already acquired for commerce. Sponsored listings, display formats, and video advertising allow sellers and brands to pay for visibility close to the point of purchase, where purchase intent is often stronger than on general media platforms.
The deeper logic is that marketplace growth creates an auction for scarce digital shelf space. As selection expands, merchants face a greater need to differentiate products, which can increase demand for sponsored placement. That makes advertising a second monetization layer on the same transaction ecosystem rather than a separate traffic-acquisition business.
Prime and subscriptions: frequency, retention, and ecosystem economics
Subscription services produced $13.7 billion in Q2 2026. This category includes Prime memberships and non-AWS digital subscriptions. Prime should be analyzed less as a standalone subscription product and more as a behavioral contract: customers prepay for a bundle of shipping, video, and other benefits, which reduces the psychological cost of incremental orders and encourages Amazon to become the default destination for recurring purchases.
The economic payoff is indirect. Prime can increase customer frequency, which improves logistics density, provides more opportunities for advertising impressions, supports third-party seller economics, and gives Amazon more reasons to invest in faster delivery. The subscription fee matters, but the strategic value lies in the demand concentration it creates across the rest of the platform.
AWS: the profit engine and the clearest proof of Amazon’s infrastructure playbook
AWS generated $42.2 billion of revenue and $16.6 billion of operating income in Q2 2026, implying an operating margin of roughly 39%. By comparison, Amazon’s North America segment produced a roughly 8% operating margin and International roughly 4% in the same quarter. This is why AWS matters disproportionately to consolidated economics: it is approximately one-fifth of quarterly revenue but contributed more than 60% of segment operating income before consolidation effects.
AWS sells compute, storage, databases, networking, analytics, security, machine-learning infrastructure, foundation-model access, and a growing set of agentic AI tools. The business model is primarily usage-based, with long-term contracts and committed-spend agreements playing an important role for large customers. As customers adopt more services, workloads can become deeply integrated across databases, identity systems, networking, security controls, data pipelines, and application architecture. That integration is the foundation for switching costs.
The newer layer is custom silicon. Amazon has built Graviton CPUs and Trainium AI accelerators to reduce dependence on third-party chip economics and improve price-performance inside AWS. In Q2 2026, Amazon said both its AWS AI business and its chips business had exceeded $25 billion annual revenue run rates, while Trainium adoption was being supported by multi-year commitments from major AI customers. If custom silicon lowers customer cost while preserving or improving AWS unit economics, it can become both a product advantage and a structural margin lever.
The corporate DNA: build primitives internally, then expose them externally
Amazon’s most repeatable strategic pattern is not “enter large markets.” It is to build difficult infrastructure for its own operations, standardize that infrastructure into reusable primitives, and then sell access to third parties. Marketplace externalized customer traffic. FBA externalized logistics. AWS externalized computing infrastructure. Advertising monetized digital shelf space. The 2026 launch of broader supply-chain services extends the same logic by offering businesses access to logistics capabilities beyond transactions that originate on Amazon.
This model can create unusually powerful cross-subsidization. A fulfillment center can support first-party inventory, marketplace sellers, Prime promises, grocery, and external logistics. A data center can support Amazon’s own applications and AWS customers. AI models and custom chips can serve both internal consumer applications and external enterprise workloads. The more shared the infrastructure, the more important utilization becomes to return on invested capital.
2. Deep Dive into Economic Moats
Intangible Assets: meaningful, but not the primary moat
Amazon has substantial brand recognition, customer trust, a large body of product reviews, merchant relationships, and proprietary operational know-how. These are valuable intangible assets, but brand awareness alone does not satisfy a rigorous moat test. Retail customers can comparison-shop within seconds, sellers can list on multiple marketplaces, and cloud buyers can architect multi-cloud environments. Amazon’s own risk disclosures acknowledge competition from retailers, search engines, social networks, virtual assistants, logistics providers, cloud platforms, AI tools, and advertising companies.
The more durable intangible asset is process knowledge: decades of data on inventory placement, delivery promises, fraud, seller performance, cloud operations, and workload behavior. Even then, proprietary knowledge becomes a moat only if it translates into better customer economics that competitors cannot quickly reproduce.
Switching Costs: strongest in AWS, increasingly relevant across the seller stack
Switching costs are one of Amazon’s two most defensible barriers. In AWS, migration is not simply moving a server from one vendor to another. A large customer may need to reconfigure databases, identity permissions, observability, security controls, networking, serverless applications, data lakes, machine-learning pipelines, and developer workflows. The more services a customer uses, the greater the operational risk, engineering time, and business interruption associated with migration.
AI can deepen this effect. Inference workloads often need to sit near existing enterprise data, applications, and governance controls. If customers already run large workloads on AWS, adding Bedrock, Trainium, agent frameworks, or AI data services can be operationally easier than rebuilding the full stack elsewhere. Amazon’s 2026 shareholder communication explicitly argues that data proximity and the consumption of adjacent non-AI services are major reasons customers deploy AI on AWS.
The seller side has a similar, though weaker, version of switching cost. A merchant using Amazon’s catalog tools, FBA inventory, Prime eligibility, advertising, reviews, and demand forecasting can technically sell elsewhere, but replicating the same integrated demand-and-logistics system may require more working capital, more software, more carrier relationships, and additional advertising spend. These are not absolute lock-ins; sellers can multi-home. The moat comes from the cumulative operating friction of replacing multiple Amazon services at once.
Network Effects: real, but weaker than the headline suggests
Amazon has classic two-sided marketplace effects: more buyers attract more sellers, while more sellers increase selection for buyers. Reviews and transaction history can improve discovery and trust, and advertisers value a platform with high-intent customer traffic. However, the network effect should not be overstated. Buyers can shop across Walmart, specialty retailers, social commerce, direct-to-consumer sites, and AI assistants. Sellers can list on multiple channels. A multi-homing market reduces the exclusivity of the network.
The more durable version is a network effect combined with infrastructure. Amazon is not just matching buyers and sellers; it is also storing inventory, financing working capital in some cases, processing payments, delivering packages, selling advertising, and providing business software. The network becomes harder to displace when participation improves not only demand access but also the economics of fulfillment and customer acquisition.
Cost Advantages: the most important moat in Amazon’s operating system
Cost advantage is Amazon’s strongest moat because it can reinforce both customer value and competitive behavior. In retail and logistics, dense package volume supports route efficiency, better asset utilization, localized inventory, and faster delivery. Amazon reported more than one million robots operating in fulfillment centers in 2026 and continues to expand same-day fulfillment formats. The goal is not automation for its own sake; it is to reduce handling cost, increase throughput, shorten delivery distance, and carry a broader selection closer to customers.
That cost advantage can become self-reinforcing. Faster delivery can improve conversion and purchase frequency. More volume creates more route density. More density can support lower unit delivery costs. Lower costs can be reinvested in price or speed, making it harder for a smaller network to match both service quality and economics.
AWS has an analogous cost structure. Scale can improve data-center utilization, procurement, networking efficiency, and the economics of custom chip development. But again, scale alone is not the moat. The moat exists only if Amazon can convert scale into lower total cost or better performance for customers while still earning attractive returns. Graviton and Trainium are strategically significant because they attempt to move an important portion of the computing bill from third-party silicon margins into Amazon-controlled architecture.
Among Buffett’s four moat categories, cost advantages and switching costs are therefore the most defensible. Network effects are important reinforcers, while intangible assets are supportive rather than decisive. The long-term excess-return case depends on Amazon continuing to turn fixed infrastructure into a lower unit cost and broader service bundle faster than rivals can replicate it.
3. Business Inflection Points & Future Catalysts
The decisive strategic inflection: 2006 and the externalization of internal infrastructure
Amazon’s most important strategic turning point was not a single product launch; it was the 2006 decision to commercialize internal infrastructure as external services. Amazon Web Services launched S3 in March 2006, giving developers access to scalable storage infrastructure. Later that year, Fulfillment by Amazon opened Amazon’s logistics capabilities to third-party businesses. These businesses look unrelated on the surface, but they share the same strategic gene: infrastructure built for Amazon can become a platform sold to others.
This changed Amazon’s identity from a merchant with technology into an infrastructure company with multiple demand channels. The consequence was profound. Retail no longer had to be the only profit pool. Amazon could own the transactional layer, the logistics layer, the computing layer, and eventually the advertising layer. That platformization is the bridge between the company’s early customer-obsession philosophy and its current multi-industry structure.
Catalyst 1: AI infrastructure monetization catches up with capital spending
Transmission mechanism: Amazon is investing aggressively in data centers, power, networking, servers, and AI chips. Those assets depress near-term free cash flow because cash leaves before capacity is fully monetized. If AWS can fill that capacity with contracted AI workloads, revenue growth should remain elevated while depreciation and operating costs are spread across a larger revenue base. Custom Trainium silicon could further improve price-performance and reduce dependence on external accelerator economics.
The early evidence is material. AWS revenue grew 37% year over year in Q2 2026, its fastest growth rate in 18 quarters, and AWS operating income rose to $16.6 billion. Amazon also reported that both its AWS AI business and chips business exceeded $25 billion annual revenue run rates. The OpenAI partnership adds another major source of Trainium and AWS demand, while Anthropic remains a large strategic customer and investment.
Observable indicators: AWS revenue growth; AWS operating margin; growth in AI and custom-chip run rates; customer commitments; data-center and power capacity coming online; property-and-equipment spending; and, most importantly, the point at which operating cash flow growth begins to outpace capital spending so free cash flow normalizes.
Main execution risk: the investment cycle can destroy value if demand is overestimated, pricing compresses faster than unit costs, power and semiconductor constraints delay deployment, or customers diversify workloads across competing clouds and proprietary infrastructure. Amazon’s trailing-twelve-month free cash flow was negative $7.6 billion at Q2 2026, primarily because property-and-equipment spending rose sharply for AI. That is not automatically negative if capacity earns attractive returns, but it makes return on invested capital the key test rather than headline AI revenue growth.
Catalyst 2: retail margin expansion through speed, robotics, and service mix
Transmission mechanism: faster delivery can raise conversion and order frequency, while robotics and regionalized fulfillment can lower the labor and transportation cost per unit. At the same time, a larger share of marketplace services and advertising can improve the revenue mix without requiring Amazon to own proportionally more inventory. This creates a path for the retail ecosystem to grow operating profit faster than gross merchandise volume.
Amazon reported record Prime delivery speeds in the first half of 2026, with more same-day and overnight deliveries, while operating more than one million robots across its fulfillment network. Q2 North America operating income increased to $9.1 billion from $7.5 billion a year earlier. The critical point is that delivery speed is not merely a customer-service metric: if it drives more frequent shopping, it also increases seller demand, advertising inventory, and route density.
Observable indicators: North America operating margin; fulfillment expense as a percentage of sales; same-day and overnight unit growth; third-party seller services growth; advertising growth; package density; inventory turns; and productivity gains from robotics and automated fulfillment.
Main execution risk: speed can become a margin trap if Amazon must build too much local infrastructure, hold too much inventory close to demand, pay higher labor and transportation costs, or subsidize delivery faster than order frequency improves. Regulatory changes affecting marketplace practices, Prime, labor, or seller economics could also limit the company’s ability to monetize the same infrastructure across multiple constituencies.
Catalyst 3: agentic commerce protects product discovery and expands ad monetization
Transmission mechanism: generative and agentic AI can change how consumers discover products. That is a threat if shoppers begin journeys on third-party assistants rather than Amazon. It is also an opportunity if Amazon can move its own shopping interface from keyword search toward conversational discovery, personalized recommendations, price monitoring, and automated purchasing. Better conversion can increase gross merchandise volume; higher-intent recommendations can improve advertising performance; and stronger shopping utility can reinforce Prime engagement.
In Q2 2026, Amazon said it combined Rufus and Alexa+ into Alexa for Shopping. The company reported that active users were close to doubling and interactions were up more than fivefold year over year. Amazon also stated that U.S. customers who use Alexa for Shopping spend more per order on average and that customers who tried Alexa+ signed up for Prime at a higher rate. Those figures are company-reported correlations and should not be interpreted as proof that the product caused the spending or subscription differences.
Advertising provides a measurable monetization channel for this transition. Advertising services grew 26% year over year in Q2 2026, while Amazon expanded its AI-powered Ads Agent into more countries. If AI lowers campaign setup costs and improves targeting or measurement, more small and mid-sized merchants may be able to participate in the ad auction, increasing advertiser density and monetization of shopping traffic.
Observable indicators: advertising growth relative to store growth; sponsored-ad pricing and advertiser adoption where disclosed; Alexa for Shopping and Rufus engagement; conversion and order-frequency metrics; Prime membership trends; and evidence that AI tools increase seller advertising participation rather than merely shifting existing spend.
Main execution risk: third-party AI assistants could weaken Amazon’s position as a product-discovery gateway, while regulators may scrutinize the interaction between marketplace ranking, paid placement, private-label products, and platform control. Poor recommendation quality could also erode trust. Amazon itself identifies search engines, social networks, virtual assistants, and AI-enabled discovery tools as competitors.
What could invalidate the broader thesis
The main bear case is not that Amazon suddenly loses scale. It is that scale becomes capital-inefficient. If AI requires structurally higher capital intensity, cloud pricing becomes more competitive, retail delivery speed requires permanently elevated fulfillment spending, or regulation limits cross-monetization between marketplace, ads, and Prime, Amazon could continue growing while generating lower incremental returns on invested capital.
Another analytical risk is relying on net income without separating operating performance from investment marks. Q2 2026 net income included a large non-operating gain primarily related to Amazon’s Anthropic investment. For assessing the operating business, consolidated operating income, segment operating income, operating cash flow, capital spending, and normalized free cash flow are more informative than headline net income alone.
4. Key FAQs
How does Amazon make money besides e-commerce sales?
Amazon makes money through third-party seller commissions and fulfillment fees, AWS cloud services, advertising, Prime and other subscriptions, physical stores, logistics and shipping services, healthcare offerings, content licensing, and other services. The strategic advantage is that many of these businesses monetize the same underlying infrastructure more than once. A shopper visit can generate a marketplace fee, an ad impression, a Prime renewal incentive, and a fulfillment transaction, while the software infrastructure supporting the experience can also be sold externally through AWS.
Why is AWS so important to Amazon’s profits?
AWS carries much higher operating margins than Amazon’s retail segments and therefore contributes a disproportionate share of operating income. In Q2 2026, AWS produced $42.2 billion of revenue and $16.6 billion of operating income, or roughly a 39% operating margin. Its importance also extends beyond current profit: AWS is the platform through which Amazon is monetizing AI infrastructure, custom silicon, enterprise data, and agentic software. The trade-off is heavy capital intensity, which is currently suppressing free cash flow.
What is Amazon’s strongest competitive moat in 2026?
The strongest moat is the combination of cost advantage and switching costs rather than brand alone. In commerce, Amazon’s fulfillment density, localized inventory, robotics, Prime demand, and seller volume can lower delivery cost and improve speed. In AWS, integrated workloads, data gravity, security architecture, developer tooling, and custom chips raise the operational cost of migration. Marketplace network effects reinforce both systems, but buyers and sellers can multi-home, so the network effect by itself is not sufficient to explain durability.
5. Conclusion
Amazon’s corporate gene is the industrialization of reusable primitives. The company repeatedly builds expensive capabilities for its own use, lowers their unit cost through scale and operational learning, and then exposes them to external customers. Marketplace, FBA, AWS, advertising, supply-chain services, and custom silicon are different expressions of the same playbook. This is why analyzing Amazon purely as an online retailer misses the central logic of the business.
The most durable competitive advantages are the areas where infrastructure creates measurable economic friction for competitors: fulfillment density that supports speed and cost, and integrated cloud architecture that makes migration expensive. Network effects and brand matter, but they are more defensible when attached to physical and digital infrastructure that customers and sellers use every day.
Over the next one to two years, the key question is whether Amazon can convert its extraordinary AI and logistics capital spending into higher operating profit and normalized free cash flow. AWS growth, custom-silicon adoption, advertising expansion, same-day delivery economics, and agentic shopping engagement are the most relevant operating signals. The counterweight is equally clear: intense cloud and AI competition, large fixed investments, regulatory scrutiny, seller and customer multi-homing, and the risk that new AI interfaces change where commerce begins.
For corporate analysis, the most useful lens is therefore not whether Amazon can keep growing. It is whether each new layer of infrastructure increases the productivity of the layers beneath it. If AI, chips, robotics, logistics, advertising, and Prime continue to make the same customer and seller relationships more valuable without requiring proportionally more capital, Amazon’s business model remains structurally powerful. If capital intensity rises faster than monetization, the same ambition that created the moat can become the principal constraint on returns.
Primary Sources
- Amazon Form 10-Q for the quarter ended June 30, 2026 — U.S. Securities and Exchange Commission
- Amazon Q2 2026 Earnings Release — SEC Exhibit 99.1
- Amazon 2025 Form 10-K — U.S. Securities and Exchange Commission
- Amazon CEO Andy Jassy’s 2025 Letter to Shareholders
- Amazon Web Services Launches Amazon S3 — March 14, 2006
- Amazon Launches Fulfillment by Amazon — September 19, 2006
- Amazon: 25 Years of Partnership with Independent Sellers
- OpenAI and Amazon Announce Strategic Partnership — February 27, 2026
Disclaimer: This article is intended solely for business logic discussion and corporate research purposes, and does not constitute investment advice of any kind.