
Key Takeaways
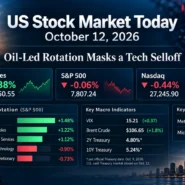
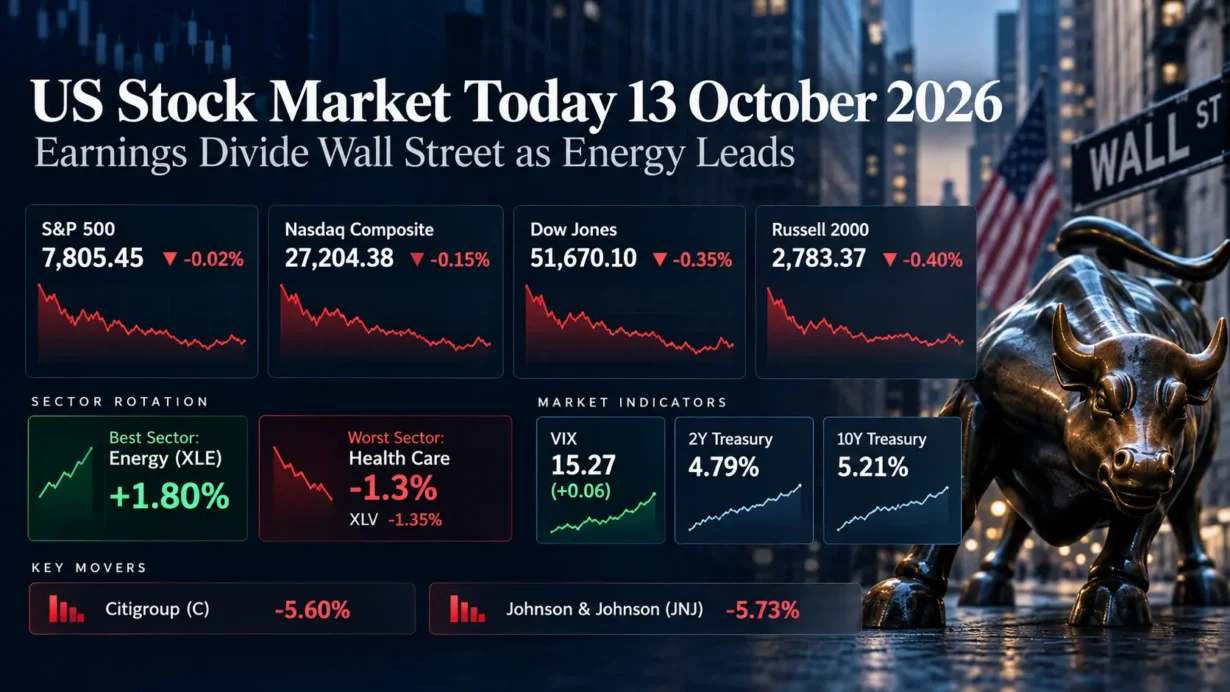
- The S&P 500 closed at 7,805.45 (-0.02%), the Nasdaq Composite at 27,204.38 (-0.15%), the Dow at 51,670.10 (-0.35%), and the Russell 2000 at 2,783.37 (-0.40%).
- Energy led sector rotation, with its S&P 500-tracking ETF XLE up 1.80%; Health Care lagged, with its S&P 500 sector index down 1.3% and tracking ETF XLV down 1.35%.
- Citigroup fell 5.60% and Johnson & Johnson lost 5.73% after reporting results; semiconductors remained under pressure as the Philadelphia Semiconductor Index declined 0.23%.
- The VIX edged up to 15.27. Treasury’s two-year yield stood at 4.79% and its 10-year yield at 5.21% ahead of the October 14 U.S. consumer inflation release.
1. Market Capital Flows and Sector Rotation
Wall Street’s nearly unchanged headline masked a pronounced sector split. Energy was the strongest S&P 500 sector, represented by a 1.80% gain in the Energy Select Sector SPDR ETF (XLE). Health Care was the weakest: the S&P 500 Health Care Index declined 1.3%, while the Health Care Select Sector SPDR ETF (XLV) fell 1.35%. These ETF returns are verified closing-price proxies, not the exact underlying sector-index returns. Utilities offered a different defensive signal, with XLU up 0.58%. Sources: XLE closing history, XLV closing history, XLU closing history, and Reuters.
Large caps outperformed small caps, but only in relative terms: the S&P 500 slipped 0.02% versus the Russell 2000’s 0.40% decline. Cyclicals diverged, with energy advancing while major banks sold off. Defensive equities were similarly mixed, as utilities rose but health care fell. In growth, semiconductor selling weighed on the Nasdaq, although Apple ended up 0.1%. Energy’s relative strength favored one value-oriented pocket, not a clean market-wide value-over-growth rotation.
Breadth was more resilient than the indexes implied. S&P 500 advancers outnumbered decliners by 1.1 to 1, and the equal-weight S&P 500 proxy RSP gained 0.05%, compared with the cap-weighted benchmark’s 0.02% decline. Yet Nasdaq new lows exceeded new highs by 408 to 47. U.S. exchange volume totaled 14.8 billion shares, below its prior 20-session average of 17.6 billion. The combination suggests selective participation, not a convincing broad-market accumulation day. Sources: Reuters market breadth and RSP closing history.
Institutional Flow Insight: Price action is consistent with a preference for near-term cash generation and commodity-linked pricing power over earnings streams exposed to semiconductor competition and valuation risk. The coming CPI report also provides a plausible reason to limit portfolio risk budgets. These are allocation hypotheses inferred from prices, not verified institutional fund-flow data; the day offers no basis for claiming a confirmed quarter-start rebalance or wholesale rotation into value.
2. Decoding the Biggest Market Movers
Citigroup (C)
Citigroup closed at $124.53, down 5.60%, despite reporting third-quarter revenue of $23.8 billion, up 8% year over year, and GAAP diluted EPS of $2.85 on $5.2 billion in net income. Return on tangible common equity, a non-GAAP measure, was 11.5%; the efficiency ratio was 58.5%. The distinction behind the headline matters: reported expenses declined 2%, but rose 3% after excluding a prior-year notable item. In its official earnings call, management reported 15% revenue growth in both Services and Wealth and guided to full-year 2026 RoTCE above 11%—a management outlook, not a realized result. Sources: Citigroup’s October 13 earnings release and official earnings-call transcript.
The selloff despite improving reported returns points to a demanding market test: investors may be questioning the durability of deposit-spread benefits, cost discipline and credit performance rather than the arithmetic of this quarter’s profit. Wells Fargo (-3.1%) and JPMorgan Chase (-0.9%) also fell, suggesting that stronger individual business lines did not translate into an indiscriminate bid for bank valuations. Those interpretations describe possible pricing concerns, not confirmed motives of sellers. Source: Reuters.
Johnson & Johnson (JNJ)
Johnson & Johnson finished at $248.61, down 5.73%. Third-quarter reported sales increased 5.9% to $25.399 billion. GAAP diluted EPS was $0.09, reflecting a one-time proposed talc-litigation charge and transaction-related effects; adjusted diluted EPS was $2.59, down from $2.80 a year earlier. Innovative Medicine grew reported sales 7.7% to $16.757 billion, but MedTech grew just 2.5% to $8.642 billion. Management acknowledged in its prepared earnings-call remarks that MedTech fell short of internal expectations. Its newly raised full-year guidance calls for reported sales of $101.0 billion to $101.4 billion and adjusted EPS of $11.05 to $11.15; these are company projections, not actual results. Sources: official earnings release and official CEO/CFO prepared earnings-call remarks.
The investment question is whether pharmaceutical momentum can offset slower device growth and adjusted earnings pressure. That uncertainty matters beyond JNJ: its decline helped drag the health care sector lower and raised the importance of organic growth and margin quality when valuing large, diversified medical businesses. The published management remarks are prepared remarks, not a purported full question-and-answer transcript.
3. Macro Indicators and Market Outlook
The Cboe VIX finished at 15.27, up 0.06 point, or 0.39%, from 15.21. The slight rise was directionally consistent with weaker equities, but the relatively subdued level does not establish a surge in institutional hedging. It indicates only a modest increase in option-implied near-term volatility. Source: Cboe’s October 13 VIX data.
Using the U.S. Treasury’s official constant-maturity par yields, based on indications near 3:30 p.m. ET, the two-year yield was 4.79%, down 1 basis point from October 9, while the 10-year yield was 5.21%, down 3 basis points from October 9. October 12 was a Treasury-market holiday, so October 9 is the correct preceding observation in that series. The 10-year-minus-two-year spread narrowed to 42 basis points from 44, a modest bull flattening. Lower yields may signal demand for duration ahead of inflation data, but one day’s move cannot establish a future Federal Reserve decision or isolate changes in term premium. Source: U.S. Treasury daily par yield curve.
Energy leadership also requires nuance. November WTI futures settled at $94.14 per barrel, up 0.4%, while Brent settled at $105.69, down 0.9%. Persistent Middle East supply risks supported the sector narrative, but divergent crude benchmarks argue against calling the session a uniform oil-price rally. Source: Reuters oil-market settlement.
Upcoming Economic Data & Catalysts:
- U.S. Consumer Price Index for September 2026 (Release date: October 14, 2026, 8:30 a.m. ET): Watch headline and core price pressures, particularly whether energy costs are feeding into broader inflation and rate-sensitive valuations.
- U.S. Producer Price Index for September 2026 (Release date: October 15, 2026, 8:30 a.m. ET): Producer-cost trends will help assess potential margin pressure and the inflation backdrop for Fed policy.
Both dates and times are listed on the U.S. Bureau of Labor Statistics’ official release calendar; neither report had been released at the October 13 market close.
Market Insights: This was selective sector rotation rather than a broad risk-on rally or an across-the-board liquidation. Mildly positive S&P breadth and equal-weight resilience offset weakness in small caps, semiconductor shares and earnings-sensitive health care and financial names. A CPI-driven rebound in yields, renewed AI earnings skepticism, weaker participation or a material rise in the VIX could undermine the index’s apparent stability near its highs.
Trading & Investment Strategy: Keep position sizes consistent with portfolio risk limits before CPI and PPI, and consider staged entries rather than chasing energy’s recent strength or treating sharp post-earnings declines as automatic bargains. Prioritize balance-sheet quality, sustainable margins and company-specific earnings visibility; diversify sector exposure and define price-based exit or stop-loss levels appropriate to volatility and liquidity. Earnings and inflation surprises can create gaps through stops, so no risk-control tool eliminates downside.
4. Key FAQs About the US Stock Market Today
Why did the US stock market move on October 13, 2026?
Major indexes slipped as bank earnings produced uneven share-price reactions and semiconductor stocks extended their decline. Energy strength and slightly lower Treasury yields cushioned the broader S&P 500, while investors awaited the next day’s CPI release.
Which sectors performed best and worst in the US stock market on October 13, 2026?
Energy led, with the S&P 500-tracking XLE ETF up 1.80%; Health Care lagged, with the S&P 500 sector index down 1.3% and XLV down 1.35%. The ETF returns are closing-price proxies rather than interchangeable official index returns.
What should investors watch after the US stock market close on October 13, 2026?
Monitor September CPI on October 14 and PPI on October 15, the 10-year Treasury yield’s response, S&P 500 versus small-cap breadth, semiconductor participation and whether management commentary across banks and health care supports durable earnings growth.
Disclaimer: This article is intended solely for the exchange of investment ideas and does not constitute investment advice of any kind.