
Key Takeaways
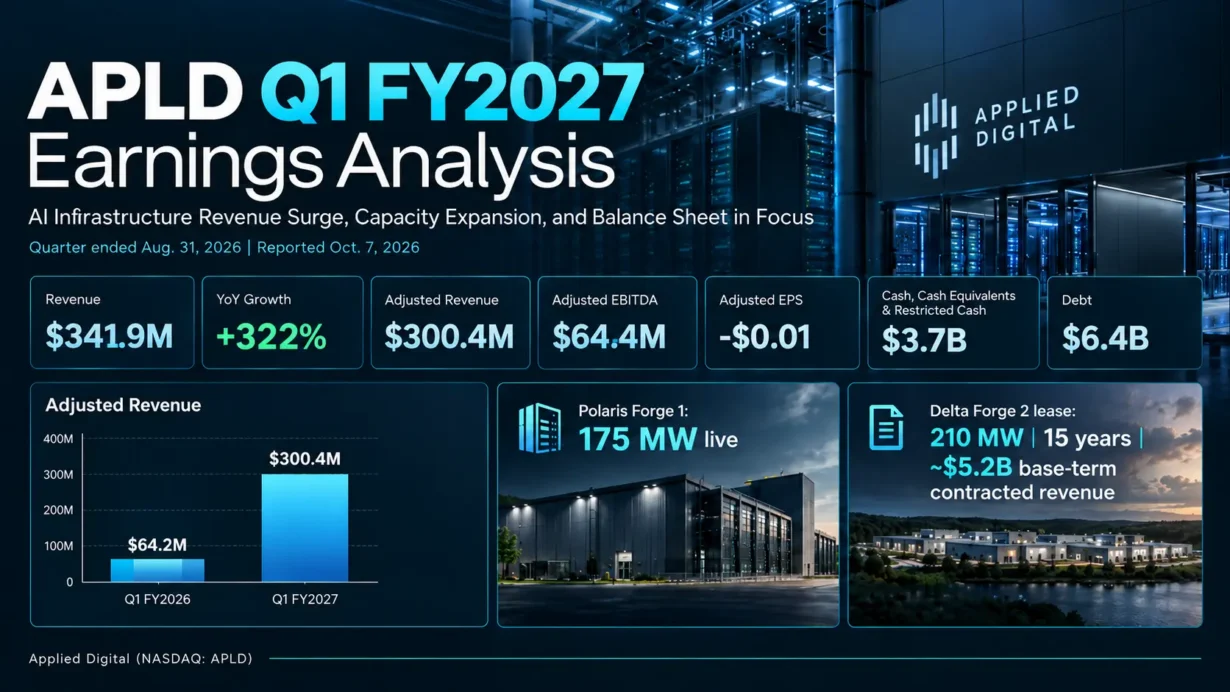
- Applied Digital reported $341.9 million in GAAP revenue for fiscal Q1 2027, up 322% year over year, but its comparable adjusted revenue excluding ChronoScale was $300.4 million.
- HPC Hosting contributed $262.6 million, including $183.5 million in tenant fit-out services and $65.8 million in base rent. Large construction-related revenues should not be valued like recurring rent.
- Non-GAAP EPS was a loss of $0.01; GAAP EPS was a loss of $0.76 from continuing operations and $0.82 including discontinued operations. Both figures matter when judging the earnings surprise.
- As of August 31, 2026, roughly 1.41 GW was under lease with approximately $36 billion of base-term contracted revenue. Only 175 MW was live at quarter-end, rising to 250 MW on October 1.
- The balance-sheet test is significant: quarterly purchases of property, equipment and other assets totaled $2.07 billion, against $63.9 million in operating cash flow and approximately $6.4 billion of debt.
Applied Digital Corporation (NASDAQ: APLD) released its fiscal first-quarter 2027 earnings on October 7, 2026, for the three months ended August 31, 2026. The quarter was a commercial milestone for its AI data center strategy, but a conventional earnings-beat headline obscures important differences between GAAP and non-GAAP results, low-margin fit-out work and long-duration leasing income. This analysis uses the official earnings release, the filed Form 10-Q, and management’s October 7 call, with market prices through the October 13, 2026 U.S. close. All forward-looking milestones are identified as management expectations, not realized results.
1. Core Earnings Breakdown
Revenue and Profitability Analysis
GAAP revenue reached $341.875 million, compared with $80.934 million a year earlier, an increase of 322.4% calculated from company-reported figures (reported by management as 322%). Adjusted revenue, which excludes results of the approximately 96%-owned and publicly traded subsidiary ChronoScale Holdings (NASDAQ: CHRN), was $300.393 million versus $64.216 million a year earlier, up 367.8%. The two measures have different consolidation boundaries and must not be substituted for one another.
- HPC Hosting: $262.6 million, or 76.8% of GAAP revenue, compared with $26.3 million a year earlier, growth of approximately 898.8%. Its $33.4 million of segment operating profit reversed a $2.0 million segment loss. The investment implication is that operating AI facilities are beginning to earn real rent, although most HPC revenue still comes from fit-out work rather than mature property income.
- Data Center Hosting: $37.8 million, or 11.0% of GAAP revenue, down approximately 0.4% from $37.9 million a year earlier. Segment operating profit nevertheless rose to $13.3 million from $6.0 million, helped by more favorable power prices. This legacy bitcoin-mining hosting operation can supply useful operating income without dictating the long-term AI infrastructure thesis.
- ChronoScale, consolidated outside the two reportable operating segments: $41.5 million, or 12.1% of GAAP revenue, versus $16.7 million a year earlier, an increase of approximately 148.1%. About $23.0 million came from GPU hardware sales. The investment implication is that this subsidiary contributes strategic AI-compute exposure but makes consolidated sales less directly comparable with Applied Digital’s core real-estate-like hosting business.
Within HPC Hosting, the quarter’s $262.6 million comprised $183.5 million of tenant fit-out services, $65.8 million of base rent and $13.3 million of tenant recoveries. Base rent rose from $44.1 million in fiscal Q4 2026, an increase of approximately 49.2% quarter over quarter, calculated from figures in the company’s prior quarterly earnings release. The recurring rental component and the $58.8 million of HPC net operating income (NOI), with a company-reported NOI margin of 89%, are more relevant to a stabilized asset valuation than headline consolidated revenue alone.
At the consolidated level, the GAAP operating loss widened to $62.4 million from $9.8 million a year ago. GAAP operating margin was approximately negative 18.2% ($62.379 million operating loss divided by $341.875 million revenue), compared with negative 12.1% in the prior-year quarter, calculated from company-reported figures. In contrast, adjusted operating income was $37.8 million and the company’s reported adjusted operating margin was 13%, versus negative 6% a year earlier. Adjusted EBITDA was $64.4 million versus $0.5 million. These positive adjusted metrics exclude selected costs and, in the company’s presentation, ChronoScale; they do not erase the consolidated operating loss.
The GAAP net loss attributable to common stockholders from continuing operations was $221.0 million, equivalent to a loss of $0.76 per share. Including the subsidiary’s discontinued Ekso-related operations, total GAAP net loss attributable to common stockholders was $237.1 million, or $0.82 per share. The company’s adjusted net loss was just $4.1 million, or $0.01 per diluted share. Reported SG&A expense climbed to $114.7 million, interest expense to $77.4 million, and the quarter included fair-value losses relating to derivatives and investments. These items help explain why operating progress did not translate into GAAP profitability.
Expectations vs. Actual Results
Consensus comparisons require an accounting label. Earnings-data providers do not use a single revenue or EPS definition for this quarter, creating contradictory headlines about whether APLD beat or missed. The figures below retain the individual vendor’s basis rather than mixing its adjusted estimate with another provider’s GAAP result.
- ✅ Revenue beat, vendor-reported GAAP comparison: actual consolidated revenue of $341.9 million versus the $116.29 million expectation displayed by TipRanks, a reported positive difference of approximately $225.6 million. However, the vendor’s expectation cannot independently be reconciled to the company’s consolidated-versus-adjusted revenue boundary, so the size of this particular surprise should be interpreted cautiously.
- ✅ Adjusted revenue beat, more directly comparable series: actual adjusted revenue of $300.4 million versus the $126.47 million estimate on Benzinga’s earnings history, a positive difference of $173.9 million, or about 137.5% above that provider’s estimate. This is not the $341.9 million GAAP revenue number.
- ✅ Adjusted EPS beat: the company’s non-GAAP loss of $0.01 per share versus Benzinga’s non-GAAP consensus loss of $0.29, an improvement of $0.28 per share.
- ❌ GAAP EPS miss on a separate reported basis: actual consolidated GAAP loss of $0.82 per share versus the $0.29 loss consensus shown by TipRanks, or $0.53 worse than that vendor’s estimate. The continuing-operations figure was a $0.76 loss per share. A reported GAAP loss must not be described as an adjusted-EPS beat.
- ⚠️ Operating margin: actual GAAP margin was negative 18.2%, while company-defined adjusted operating margin was 13%. A methodologically comparable, publicly verifiable analyst consensus for operating margin was not identified, so neither a margin beat nor a margin miss can be stated reliably.
- ⚠️ Fiscal Q2 2027 guidance: the October 7 release and conference call did not provide a numerical company forecast for next-quarter revenue, EPS or operating margin. Therefore, there is no verifiable company-issued Q2 financial guidance to compare with consensus.
The genuine operating surprise was a combination of a much larger tenant fit-out workload and the onset of HPC rental revenue. The reported year-over-year revenue increase was not driven solely by recurring leases: higher tenant fit-out services were a central contributor, with ChronoScale also adding consolidated revenue. Similarly, the adjusted EPS beat reflects the company’s exclusions and adjustments, whereas GAAP results include substantial SG&A, financing expenses and mark-to-market effects.
For investors, the market is likely to assign more weight to commissioned megawatts, rental NOI, new binding leases, project financing costs and demonstrable cash conversion than to transitory fit-out revenue alone. Management discussed an expectation of more than 600 MW of additional capacity entering service over the next 12 months, approximately 250 MW of possible expansion leases by calendar year-end at higher rates, and potential revenue contribution from its Louisiana and Alabama projects in the first half of calendar 2027. These are execution milestones and commercial intentions, not numerical Q2 earnings guidance or already signed contracts.
The stock reaction also demands precision. APLD closed at $23.81 on October 7 before the after-market earnings release, after already declining 6.04% in that regular session. It initially rallied in extended trading, but October 8’s regular-session close was only $23.85, up 0.17% from the pre-release close. By the October 13 U.S. close, it had fallen to $22.44, down approximately 5.8% from October 7, based on verified historical closing prices. The October 7 intraday decline cannot be attributed to results published after that day’s close.
This disconnect is more informative than calling the move a simple sell-the-news event. The combination of low-margin recognized revenue, substantial GAAP losses, heavy capital requirements and a valuation premised on successful future delivery plausibly constrained the stock’s sustained response. Share-based compensation and preferred-stock conversions also matter to per-share returns. The available evidence does not establish that a new dilutive acquisition, a specific management remark or any one of these factors independently caused the decline.
Earnings Call Highlights
The following five points paraphrase verifiable remarks by CEO Wes Cummins and CFO Saidal Mohmand during the October 7, 2026 call. Interpretations are independent analysis, not additional company statements.
CEO Wes Cummins: Applied Digital expects to place more than 600 MW into service over the next 12 months, versus 250 MW brought into service over the preceding 12 months.
💡 Reading Between the Lines: Management is shifting the investor scorecard from megawatts contracted to megawatts delivered and monetized. Construction timing, tenant acceptance and the speed of base-rent recognition should increasingly drive revisions to valuation models.
CEO Wes Cummins: The company is prioritizing investment-grade hyperscalers and take-or-pay lease terms of at least 15 years, while designing facilities for a useful life extending beyond a single generation of GPUs.
💡 Reading Between the Lines: Customer credit quality is an underwriting input, not just a marketing claim: it can improve debt availability and reduce the need to fund projects entirely with common equity. Flexible liquid-cooling, electrical and high-density designs could protect residual value, although a 30-plus-year design aspiration is not proof of 30-plus years of economic life.
CEO Wes Cummins: Management aims to execute roughly 250 MW of additional expansion leases by the end of calendar 2026 and is seeking lease-rate increases north of 15%, potentially alongside longer lease durations.
💡 Reading Between the Lines: Scarce powered sites and already established campuses may give Applied Digital greater negotiating leverage than a new, unpermitted development. The proposed volume and pricing remain prospective rather than contracted and should not be added to the $36 billion signed lease base as if already secured.
CFO Saidal Mohmand: The $1.59 billion June financing for Polaris Forge 1 carried a 7% coupon, compared with 9.25% on an earlier Polaris Forge 1 note tranche; the company has funded the 400 MW CoreWeave campus and 200 MW at Polaris Forge 2.
💡 Reading Between the Lines: A lower coupon on a newly issued project tranche supports the thesis that delivered assets and credit enhancement can reduce incremental funding costs. It does not reprice existing 9.25% debt, and the next three campuses still require financing, making future project-level terms central to equity value.
CEO Wes Cummins: The company is pursuing dedicated future electricity supply through Base Electron and treats its agreement for up to 1 GW of potential capacity in Finland as a measured international option, while near-term execution remains U.S.-focused.
💡 Reading Between the Lines: Securing land, power access, permitting and community support before competitors can replicate them is the intended competitive moat. The North Dakota power plant is still under development and the Finnish capacity is only potential; neither should be valued like an operating, rent-producing campus.
The official Investor Relations site provides the October 7 conference webcast, while a readable third-party call transcript was used to cross-check the discussion. Applied Digital’s IR site does not label a written transcript as an official company publication; the original earnings release and Form 10-Q govern the reported financial figures.
2. Deep Business Insights
Hidden Metrics That Matter
The first overlooked metric is the composition and incremental profitability of the revenue surge. Tenant fit-out services accounted for approximately 53.7% of all GAAP revenue ($183.518 million divided by $341.875 million), while recurring HPC base rent was only approximately 19.2% ($65.8 million divided by $341.875 million), calculated from company-reported figures. Tenant fit-out increased by $157.2 million from $26.3 million a year ago, accounting for approximately 60.3% of the $260.9 million increase in total consolidated revenue: ($183.518 million − $26.296 million) ÷ ($341.875 million − $80.934 million). These figures are calculated from company-reported figures, not separately disclosed company percentages.
The 10-Q assigns approximately $176.1 million of direct services cost to the $183.5 million of HPC fit-out services, leaving roughly $7.4 million of gross profit. That is an implied fit-out gross margin of approximately 4.0%: ($183.518 million − $176.100 million) ÷ $183.518 million, calculated from company-reported figures before segment SG&A. Construction and technical fit-out execution may help win or serve valuable long leases, but its transaction-like revenue deserves a different valuation multiple from long-duration base rent. The quarterly HPC NOI margin of 89% is a company-defined property-level metric and must not be confused with the margin on the whole HPC segment or the consolidated business.
The second overlooked metric is the conversion rate of leased power into operating power. At August 31, 175 MW was live versus approximately 1,410 MW of contracted critical IT load, or about 12.4% (175 ÷ 1,410). After the 75 MW delivery on October 1, the corresponding ratio increased to about 17.7% (250 ÷ 1,410), using the August 31 signed-load denominator for the post-quarter comparison. Both percentages are calculated from company-reported figures; they are not company-published utilization ratios. They measure a delivery gap, not low occupancy of the facilities already in service. The $36 billion base-term contracted revenue figure is consequently a long-horizon contractual opportunity rather than money already earned, free cash flow in hand, or proof that all leased megawatts are operating.
Why do customers choose Applied Digital? Its proposition combines large contiguous power positions, a repeatable purpose-built facility design, liquid-cooling and high-density capability, fiber access, contracted construction delivery, and established relationships with local communities and utilities. Long-lived facilities that can support successive compute generations reduce migration friction for hyperscalers. For the landlord, this may strengthen renewal economics and residual asset value; for the tenant, it reduces the operational uncertainty of finding another approved and powered campus. None of these advantages removes customer concentration, permitting, counterparty or technological-obsolescence risk.
Industry Chain Reactions
- ✅ Potential beneficiary — CoreWeave (NASDAQ: CRWV): It is Applied Digital’s identified tenant at Polaris Forge 1, where two buildings totaling 250 MW became ready for service by October 1. Timely infrastructure delivery can enable CoreWeave to deploy computing capacity without bearing the full site-development process itself. This is an operational enabler, not a guarantee of CoreWeave earnings upside: the tenant still bears compute-hardware investment and contractual rent obligations.
- ❌ Potential competitive pressure — Core Scientific (NASDAQ: CORZ): Core Scientific also competes in AI and high-density colocation, including a substantial separately contracted CoreWeave relationship. Applied Digital’s ability to deliver hyperscaler-ready campuses and seek higher expansion rents could raise the bar for rival providers bidding on future deployments. No evidence in APLD’s results establishes a lost CORZ contract or measurable damage to CORZ margins; the pressure is a scenario for future customer and site competition, not an observed financial impact. Core Scientific’s own quarterly filing documents its high-density colocation strategy and CoreWeave exposure.
These two exposures illustrate different positions in the same AI infrastructure chain. APLD primarily monetizes buildings and powered infrastructure; its hyperscaler customers monetize compute, while other landlords compete on time to power, reliability, funding costs and rental economics. APLD’s stronger execution can be good for compute users without necessarily being bad for every competing infrastructure provider in a supply-constrained market.
Valuation Framework and Key Risks
APLD closed at $22.44 on October 13, 2026. Using approximately 302.39 million shares outstanding, the equity market capitalization was about $6.79 billion. Against approximately $872.25 million in trailing-12-month consolidated revenue, the stock traded at a simple trailing price-to-sales multiple of roughly 7.8 times: $6.79 billion ÷ $0.87225 billion, calculated from the quoted share price, share count and trailing revenue shown by Stock Analysis. This is a backward-looking, equity-only comparison, not a target price, and the sales denominator includes low-margin fit-outs and consolidated ChronoScale revenue.
At August 31, Applied Digital held about $2.95 billion in cash and cash equivalents plus approximately $0.73 billion of restricted cash, against roughly $6.38 billion of debt. Restricted cash should not automatically be treated as freely available for new developments. The quarter also recorded $63.9 million of net cash provided by operations and $2.075 billion of purchases of property, equipment and other assets, implying an approximate $2.011 billion gap before other investing activities and external financing: $63.9 million − $2,074.7 million = negative $2,010.8 million. This simplified measure is calculated from company-reported figures; it is not presented as the company’s standardized free-cash-flow metric.
The valuation should therefore be organized around two distinct components: cash-generating campuses already ready for service, which can be analyzed through rent and property-level NOI; and contracted or prospective campuses still under construction, which require completion financing and carry schedule, cost and delivery risk. Management’s approximately $36 billion of initial-term signed revenue supports long-term visibility but is not equivalent to enterprise value, near-term annual recurring revenue or current net profit. Optional renewals, land positions, the up-to-1-GW Finnish agreement and future Base Electron generation need separate probability and capital-cost assessments rather than automatic full credit.
The key downside risks are further debt issuance at unattractive terms; rising interest and construction costs; the need for preferred capital or equity-linked structures that impair common-share participation; customer concentration; delayed readiness-for-service or billing; continued corporate overhead and stock compensation; GPU-density and cooling redesign requirements; and regulatory or grid-access setbacks. The weighted-average basic share count increased to 291.6 million from 255.9 million a year ago, so per-share dilution is not hypothetical. Management also noted that the remaining Polaris Forge 3, Delta Forge 1 and Delta Forge 2 campuses require project financing.
A constructive investment case requires observed growth in delivered MW and base rent, sustained HPC NOI, signed expansion leases at attractive economics, and refinancing that reduces rather than merely relocates the cost of capital. A cautious case focuses on the distance between 250 MW delivered as of October 1 and approximately 1.41 GW signed, alongside spending that still materially exceeds operating cash generation. At this share price, neither a simplistic multiple of the $36 billion contracted figure nor a conventional P/E ratio offers a reliable standalone valuation shortcut.
3. Key FAQs
What were APLD Q1 2027 earnings revenue and EPS on a GAAP versus adjusted basis?
For the fiscal quarter ended August 31, 2026, reported October 7, Applied Digital recorded $341.9 million of GAAP revenue and $300.4 million of adjusted revenue excluding ChronoScale. GAAP EPS was a loss of $0.76 from continuing operations, or $0.82 including discontinued operations. Company-defined adjusted EPS was a loss of $0.01. Analysts and publishers may report different surprise results because the definitions are not interchangeable.
Why did APLD stock fall after its Q1 2027 revenue and adjusted EPS beat?
The shares initially advanced after the October 7 release and closed October 8 slightly above their pre-release level, but fell to $22.44 by October 13. Plausible fundamental concerns include the heavy fit-out mix behind headline sales, a large GAAP loss, debt-financed construction spending, dilution risk, and a valuation dependent on timely future campus deliveries. None of those explanations has been verified as the sole cause of the subsequent share-price decline.
Did Applied Digital issue Q2 2027 guidance, and how much of its $36 billion contracted revenue is live?
No quantified company-issued guidance for fiscal Q2 2027 revenue, EPS or operating margin appeared in the October 7 release or call. Management did discuss delivery and expansion objectives, which are not earnings guidance. As of August 31, approximately 1.41 GW had been leased, but only 175 MW had been delivered; live capacity reached 250 MW after an additional October 1 completion. The roughly $36 billion figure represents contracted revenue across the initial lease terms, not recognized quarterly revenue, currently operating capacity or cash already collected.
Sources: Applied Digital’s official Q1 FY2027 earnings release, official Form 10-Q, Investor Relations financial results and webcast access, October 7 earnings call transcript, Benzinga consensus data, TipRanks GAAP earnings comparison, and APLD historical stock prices, reviewed as of October 14, 2026.
Disclaimer: This article/chart is for educational and informational purposes only and does not constitute investment advice of any kind. Past performance is not indicative of future results. Investors should independently evaluate their own risks.