Key Takeaways
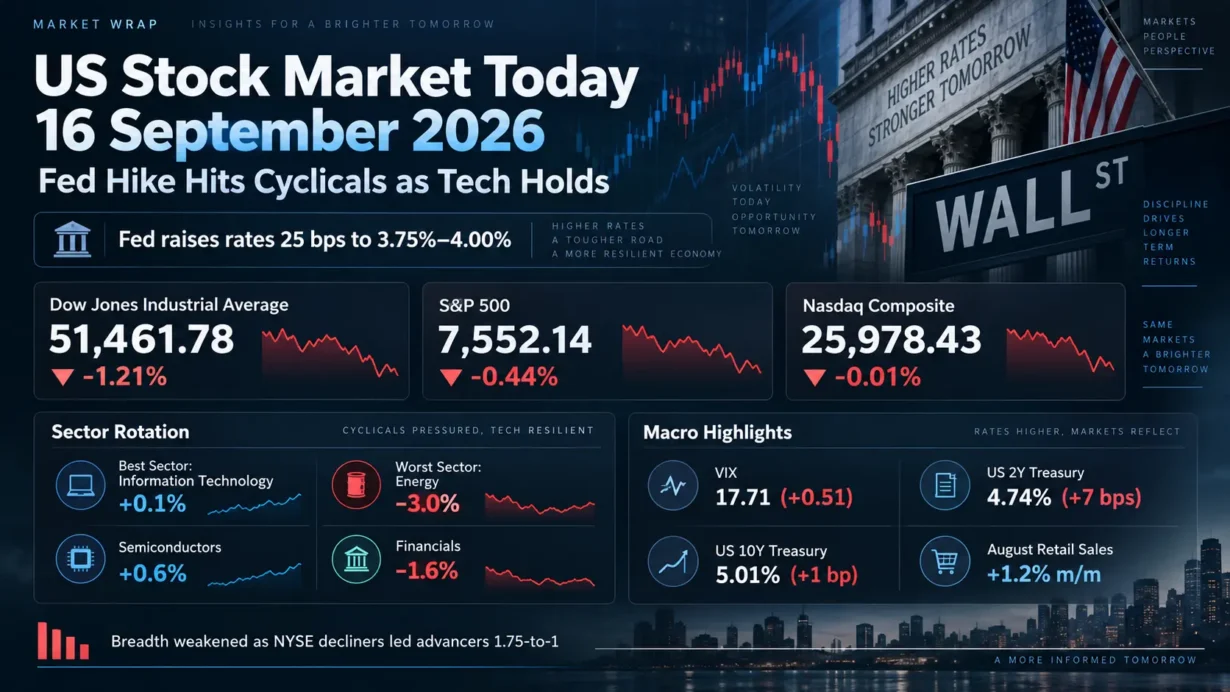
- The Dow Jones Industrial Average fell 1.21% to 51,461.78, the S&P 500 lost 0.44% to 7,552.14, and the Nasdaq Composite slipped just 0.01% to 25,978.43 after the Federal Reserve raised rates for the first time in more than three years.
- The FOMC voted unanimously to lift the federal funds target range by 25 basis points to 3.75%-4.00%. August retail sales rose 1.2% month over month, reinforcing the combination of resilient demand and still-elevated inflation pressure.
- Information Technology was the strongest S&P 500 sector at about +0.1%, supported by a 0.6% semiconductor gain, while Energy fell 3.0% as WTI crude settled 3.2% lower and Brent declined 2.7%.
- The Cboe VIX finished at 17.71, up 0.51 point or 2.97%. On the U.S. Treasury’s official daily par curve, the 2-year yield rose 7 basis points to 4.74% and the 10-year yield rose 1 basis point to 5.01%.
- Market breadth was weaker than the nearly flat Nasdaq suggested: NYSE decliners outnumbered advancers 1.75-to-1, Nasdaq decliners led 1.48-to-1, and U.S. exchange volume reached 18.42 billion shares versus a 20-day average of 15.33 billion.
1. Market Capital Flows and Sector Rotation
Wednesday’s tape was less a uniform risk-off event than a sharp repricing across factor exposures. Information Technology finished as the best-performing S&P 500 sector at roughly +0.1%, while Energy was the clear laggard at -3.0%. Financials also underperformed at roughly -1.6%, while Health Care and Utilities ended around flat. The semiconductor index rose 0.6%, helping the growth-heavy Nasdaq finish essentially unchanged even as the Dow fell 1.21%. Small caps did not provide a diversification offset: the Russell 2000 declined about 0.4%, broadly in line with the S&P 500.
The relative pattern favored secular growth and earnings-visibility exposures over commodity-sensitive and economically cyclical groups. Energy’s decline was directly linked to the reversal in crude, while the combination of a higher policy rate and a flatter 2s10s curve weighed on Financials. Defensive sectors held up better than the broad market but did not lead decisively, consistent with a session driven by policy repricing rather than a wholesale flight into low-beta assets.
Breadth confirms that headline resilience in the Nasdaq overstated the strength of the underlying market. Decliners led advancers by 1.75-to-1 on the NYSE and 1.48-to-1 on Nasdaq, while trading volume ran about 20% above the recent 20-session average. The S&P 500 logged 10 new 52-week highs versus 20 new lows, and the Nasdaq recorded 51 new highs versus 257 new lows. That combination points to broad de-risking beneath the surface even though a narrow pocket of semiconductor strength cushioned the cap-weighted indexes.
Institutional Flow Insight: A plausible institutional interpretation, rather than a confirmed flow read, is that investors reduced commodity beta, financial cyclicality, and other exposures vulnerable to a higher front-end discount rate while retaining selected technology positions with stronger earnings visibility. The official Treasury curve flattened as the 2-year yield rose more than the 10-year yield, which raises the near-term hurdle rate for risk assets without necessarily invalidating long-duration growth franchises whose cash-flow expectations remain intact. Because September 16 was neither month-start nor quarter-start, there is less basis for attributing the move to calendar rebalancing; event-driven risk-budget adjustments around the Fed decision offer a cleaner explanation. Valuation sensitivity remains important, however, because sustained yields near 5% increase the opportunity cost of holding richly priced equities.
2. Decoding the Biggest Market Movers:
Boeing (BA)
Boeing shares fell 3.7% after Chief Executive Kelly Ortberg said at the company’s September 16 investor conference appearance that stabilizing 737 MAX production at 47 aircraft per month was taking longer than expected. Management indicated that internal wing-production constraints were part of the issue and that the company needs to stabilize the current rate and bring the Everett North Line into production before moving toward the next rate step. The latest official Q2 2026 Boeing earnings release, dated July 28, reported revenue of $24.6 billion, a GAAP loss of $0.67 per share, a 0.6% GAAP operating margin, a 0.0% core operating margin, and $0.6 billion of free cash flow. Boeing Commercial Airplanes reported a -2.7% operating margin and 171 deliveries in the quarter. The official Q2 earnings-call materials and transcript are available through Boeing Investor Relations.
The investment read-through is execution duration rather than an immediate demand shock. A slower stabilization of 737 output can delay working-capital normalization and cash conversion for Boeing while also shifting the timing of revenue recognition for aerospace suppliers tied to production cadence. For the broader industrial complex, the message is that backlog strength and end-demand visibility can coexist with manufacturing bottlenecks that keep near-term margin and free-cash-flow expectations sensitive to operational milestones.
Robinhood Markets (HOOD)
Robinhood fell 5.5% after the U.S. Senate failed to advance cryptocurrency legislation and the U.S. Department of Justice charged two former Robinhood engineers in a separate case involving alleged misuse of confidential information. The Senate cloture vote on the motion to proceed to H.R. 3633 failed 49-50, short of the required threshold. The DOJ charges are allegations, not findings of guilt. Robinhood’s latest official Q2 2026 earnings release showed record net revenue of $1.31 billion, up 32% year over year, and diluted EPS of $0.62, up 48%. Its official Q2 earnings transcript is published on the company’s Investor Relations site. Robinhood’s subsequently released August operating data showed total platform assets of $383.7 billion, up 26% year over year, while event-contract volume was 4.7 billion contracts and crypto notional trading volume was $17.5 billion.
The broader market implication is a higher policy-risk discount for crypto-linked brokers and trading platforms rather than evidence of an abrupt deterioration in Robinhood’s reported operating momentum. Legislative uncertainty can affect the valuation investors assign to future digital-asset and event-contract revenue streams even when current customer assets and activity remain strong. That distinction matters for peers: regulatory headlines can compress multiples across the group before they have a measurable impact on near-term revenue or earnings.
3. Macro Indicators and Market Outlook
The Cboe VIX closed at 17.71, up 0.51 point or 2.97%, after trading as high as 18.94. The rise in implied volatility was directionally consistent with the S&P 500 decline and weaker breadth, but the index remained below 20, which is more consistent with a moderate increase in hedging demand and event-risk pricing than with disorderly stress. The post-Fed reversal therefore looked like a controlled repricing of rates and sector exposures rather than a volatility shock.
On the U.S. Treasury’s official daily par yield curve, the 2-year yield rose to 4.74% from 4.67%, while the 10-year yield moved to 5.01% from 5.00%. The 2s10s spread consequently narrowed to roughly +27 basis points from +33 basis points. The concentration of the move at the front end is consistent with investors assigning greater weight to near-term policy restraint after the Fed hike, while the still-elevated 10-year yield reflects a broader mix of inflation, growth, fiscal and term-premium risk. A single day’s yield move should not be treated as a definitive forecast of the next Fed decision.
The macro backdrop remained unusually two-sided. The FOMC raised its target range by 25 basis points to 3.75%-4.00% in a unanimous vote, while its September Summary of Economic Projections showed a median 4.1% federal funds rate at year-end 2026. That median is consistent with one additional quarter-point move from the current target-range midpoint, but the projection is not a policy commitment. At the same time, August retail sales rose 1.2% month over month, underscoring resilient nominal demand. Crude moved in the opposite direction on the day, with WTI down 3.2% and Brent down 2.7%; that helped explain Energy’s sharp underperformance and provided a modest offset to inflation concerns, although oil remained elevated after its recent surge.
Upcoming Economic Data & Catalysts:
- New Residential Construction for August 2026 (Release date: September 17, 2026, 8:30 a.m. ET): Census Bureau housing starts and building permits will offer a timely read on one of the economy’s most rate-sensitive sectors. With the 10-year Treasury yield around 5%, investors will focus on whether financing costs are translating into weaker construction activity, with implications for homebuilders, materials and housing-linked lenders.
- Job Openings and Labor Turnover Survey for August 2026 (Release date: September 29, 2026, 10:00 a.m. ET): The BLS report will update job openings, hires and quits. Those measures will help investors assess labor-demand tightness and wage-pressure risk, both of which are relevant to the Fed’s inflation and growth trade-off.
Market Insights:
The session was broad enough to qualify as genuine risk reduction, but the cap-weighted indexes were cushioned by a concentrated pocket of technology strength. The Nasdaq’s 0.01% decline should therefore not be read as evidence of broad risk appetite when Nasdaq decliners outnumbered advancers 1.48-to-1. A reversal of the current pattern could come from several directions: another sharp rise in Treasury yields, deterioration in semiconductor leadership, downward earnings revisions, renewed policy surprises, or a sustained breakout in volatility. Conversely, stabilization in front-end yields and improving breadth would reduce the pressure on rate-sensitive and cyclical exposures.
Trading & Investment Strategy:
Risk management should take precedence over directional conviction after a policy-regime shift. Investors can consider smaller position sizes, staggered entries rather than single-price deployment, and a preference for companies with visible cash flow, balance-sheet flexibility and earnings resilience. Sector exposure should be sized with rate sensitivity in mind: technology leadership is constructive but vulnerable to valuation compression if yields rise further, while the one-day energy selloff should not automatically be treated as a durable trend reversal. Predefined stop-loss or volatility-based risk limits can help contain event risk, and chasing large post-news moves is generally less attractive than waiting for price discovery and breadth confirmation.
4. Key FAQs About the US Stock Market Today
Why did the US stock market move on September 16, 2026?
Stocks reversed lower after the Federal Reserve raised the federal funds target range by 25 basis points to 3.75%-4.00% and the Treasury curve repriced higher, especially at the 2-year maturity. Strong August retail sales reinforced the view that demand remained resilient even as inflation stayed elevated. Falling crude oil prices hit Energy shares, while semiconductor strength helped Technology and kept the Nasdaq close to flat.
Which sectors performed best and worst in the US stock market on September 16, 2026?
Information Technology was the strongest S&P 500 sector at roughly +0.1%, aided by a 0.6% gain in semiconductors. Energy was the weakest sector at -3.0% as WTI and Brent crude fell sharply. Financials also lagged at roughly -1.6%, while Health Care and Utilities finished near flat, reflecting a rotation away from commodity and rate-sensitive cyclicality rather than a uniform exit from equities.
What should investors watch after the US stock market close on September 16, 2026?
The immediate macro focus is the September 17 New Residential Construction report, followed by the August JOLTS report on September 29. Market-based signals deserve equal attention: the 2-year Treasury yield at 4.74%, the 10-year yield near 5.01%, the VIX at 17.71, and whether weak advance-decline breadth persists. At the company level, Boeing’s production stabilization and crypto-sector regulatory developments remain relevant catalysts, but investors should distinguish confirmed operational data from headline-driven expectations.
Disclaimer: This article is intended solely for the exchange of investment ideas and does not constitute investment advice of any kind.