

Key Takeaways
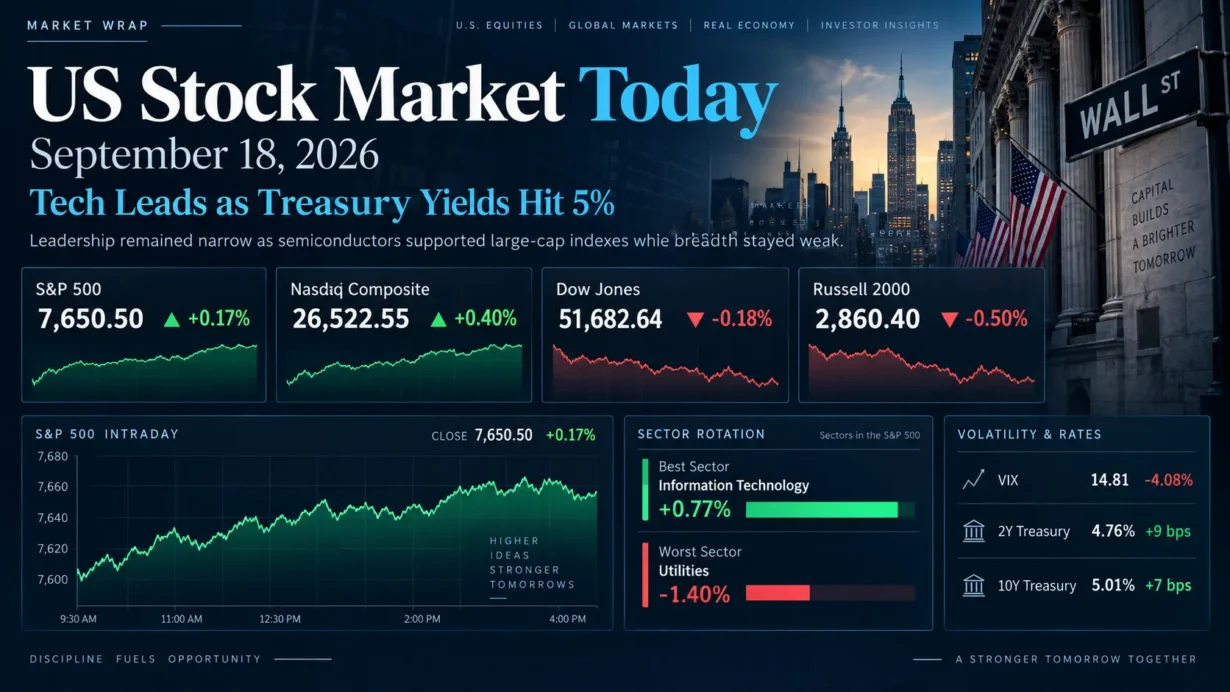
- The S&P 500 rose 0.17% to 7,650.50 and the Nasdaq Composite gained 0.40% to 26,522.55, while the Dow Jones Industrial Average fell 0.18% to 51,682.64 and the Russell 2000 declined 0.50% to 2,860.40. Semiconductor strength kept the cap-weighted indexes positive despite weak market breadth.
- Information Technology was the best-performing S&P 500 sector, up 0.77%, while Utilities was the worst, down 1.40%. The combination of tech leadership and small-cap weakness pointed to selective large-cap growth exposure rather than a broad risk-on rotation.
- The U.S. Treasury’s official daily par yield curve showed the 2-year yield at 4.76%, up 9 basis points, and the 10-year yield at 5.01%, up 7 basis points. The move followed the Federal Reserve’s September 16 decision to raise the federal funds target range by 25 basis points to 3.75%-4.00%.
- The Cboe VIX closed at 14.81, down 0.63 point or 4.08%, even as declining stocks outnumbered advancers on both the NYSE and Nasdaq. That divergence suggests index-level option hedging demand eased while participation underneath the major averages remained fragile.
- U.S. exchange volume reached 25.29 billion shares versus a 20-session average of 16.19 billion. Because September 18 was a quarterly triple-witching session, the unusually heavy turnover should not be read as pure directional institutional conviction.
1. Market Capital Flows and Sector Rotation
The closing tape was stronger at the index level than beneath the surface. The S&P 500 Information Technology sector gained 0.77%, the best result among the 11 major sectors, while Utilities fell 1.40%, the weakest. A semiconductor rally helped the Nasdaq and S&P 500 finish higher, but the Russell 2000’s 0.50% decline showed that smaller companies did not participate. Rate-sensitive defensives were not a safe haven: Utilities lagged as Treasury yields moved higher, while Real Estate was also under pressure during the session. Cyclicals were mixed rather than uniformly strong, with Industrial stocks finding support but Materials weakened by sharp declines in major steel producers. Growth-heavy indexes outperformed blue-chip benchmarks, a useful proxy for growth leadership, although it should not be treated as a formal growth-versus-value factor return.
Market breadth reinforced the concentration signal. Declining issues outnumbered advancers by 1.78-to-1 on the NYSE and 1.42-to-1 on Nasdaq. The S&P 500 recorded five new 52-week highs against 30 new lows, while Nasdaq recorded 45 new highs and 162 new lows. Total U.S. exchange volume of 25.29 billion shares was far above the 16.19 billion 20-day average, but quarterly options and futures expiration materially boosted turnover, limiting how much directional information should be inferred from volume alone.
Institutional Flow Insight: The session is consistent with institutions favoring earnings visibility, liquidity and secular semiconductor exposure while reducing risk in areas more exposed to financing costs or near-term earnings uncertainty. That is an interpretation rather than confirmed flow data. With the 10-year Treasury par yield back above 5%, utilities and other bond-proxy equities face a higher discount-rate hurdle, while small caps remain more sensitive to refinancing conditions. At the same time, the resilience of large-cap technology despite higher yields suggests that investors were willing to pay for company-specific earnings durability and AI-related demand. Triple-witching activity and late-quarter risk management may also have amplified individual moves, so one session should not be treated as proof of a lasting factor rotation.
2. Decoding the Biggest Market Movers
Xenon Pharmaceuticals (XENE)
Xenon Pharmaceuticals closed at $39.75, down 30.69%. The catalyst was the company’s September 17 update on azetukalner. Xenon said it had submitted a New Drug Application to the FDA for focal seizures, but it also voluntarily paused enrollment of new patients in ongoing major depressive disorder and bipolar depression studies after an analysis of neuropsychiatric adverse events. Patients already enrolled remain on study, and the pause does not affect the ongoing epilepsy studies. Xenon said the action was precautionary, taken in consultation with its Data Safety Monitoring Board, while it evaluates potential dosing modifications. The company also said X-NOVA2 enrollment had reached roughly 360 patients, or about 80% of its original 450-patient target, with topline data now expected in the first quarter of 2027.
The market reaction was fundamentally about the value assigned to psychiatric optionality rather than the epilepsy filing alone. On Xenon’s August 6 Q2 earnings call, management had described neuropsychiatry as a major expansion opportunity for azetukalner while preparing the focal-seizure NDA. The latest official Q2 results showed no quarterly revenue, a net loss of $110.7 million, diluted loss per share of $1.11, and $1.2451 billion of cash, cash equivalents and marketable securities, which the company said should fund operations into 2029. That financial profile makes the equity especially sensitive to changes in perceived clinical probability and addressable-market breadth. The 30.69% decline therefore represents a sharp repricing of pipeline risk, but it should not be generalized into a sector-wide healthcare signal because the event was highly company-specific.
Nucor (NUE)
Nucor closed at $248.38, down 6.32%, after issuing third-quarter guidance after the prior session’s close. The company expects Q3 2026 earnings of $5.55-$5.65 per diluted share, versus Q2 GAAP EPS of $5.04, adjusted EPS of $4.84 and Q3 2025 EPS of $2.63. Nucor expects steel-mill and steel-products earnings to rise sequentially, supported by higher selling prices and stable or higher volumes, while raw-materials earnings are expected to decline on lower pricing and shipments. Importantly, Q2 steel-mill results benefited from $130 million of cash refunds tied to prior-period raw-material procurement costs, a benefit management does not expect to recur in Q3; Q2 also included a $61 million pre-tax non-cash benefit tied to the valuation of Nucor’s Helion investment.
The latest official Q2 release reported $10.40 billion of net sales, $1.16 billion of net earnings attributable to Nucor stockholders, GAAP EPS of $5.04, adjusted EPS of $4.84 and EBITDA of $2.02 billion. On the Q2 earnings call, management said 2026 shipment growth was tracking closer to the high end of its previously indicated 5%-10% range, citing robust demand across energy, advanced manufacturing, data centers and infrastructure. Friday’s selloff therefore did not reflect an outright collapse in demand; it reflected a gap between still-strong absolute earnings and the earnings quality and trajectory investors had already discounted. That distinction matters for the Materials sector: when expectations are elevated, non-recurring benefits, raw-material profitability and incremental margin conversion can matter as much as headline year-over-year EPS growth. Peer weakness in steel reinforced the sector-level pressure.
3. Macro Indicators and Market Outlook
The Cboe VIX closed at 14.81, down 0.63 point or 4.08%. On its face, the decline in implied volatility was consistent with the S&P 500 and Nasdaq closing higher, but it was less consistent with the day’s weak breadth and small-cap decline. The more useful interpretation is that demand for near-term S&P 500 index protection eased into the close even though internal equity participation remained narrow. Because the session coincided with quarterly derivatives expiration, option-positioning and dealer-hedging flows may have contributed to the VIX move; the low close should not be treated as evidence that event risk has disappeared.
On the U.S. Treasury’s official daily par curve, the 2-year yield rose to 4.76% from 4.67%, a 9-basis-point increase, while the 10-year yield rose to 5.01% from 4.94%, a 7-basis-point increase. The 2s10s spread remained positive at 25 basis points but flattened modestly from 27 basis points a day earlier as the front end rose slightly faster. The larger move in the 2-year maturity is consistent with renewed sensitivity to the near-term policy path after the Federal Reserve raised its target range by 25 basis points to 3.75%-4.00% on September 16 and said inflation remains elevated. The rise in the 10-year yield is also consistent with investors demanding compensation for inflation and duration risk, but a one-day move cannot cleanly separate expected policy rates from growth expectations or term premium.
Oil remained an important cross-asset input because of its inflation implications. West Texas Intermediate settled at $100.30 per barrel, down 1.58%, while Brent settled at $103.87, down 0.91%. The daily decline provided some relief, but both benchmarks remained above $100, keeping energy-related inflation risk relevant for bond yields, corporate margins and consumer purchasing power.
Upcoming Economic Data & Catalysts:
- New Residential Sales, August 2026 (Release date: September 24, 2026): The Census Bureau’s report will show whether higher borrowing costs are materially restraining new-home demand. A meaningful surprise could affect homebuilders, rate-sensitive equities and the market’s assessment of growth resilience.
- Advance Report on Durable Goods, August 2026 (Release date: September 25, 2026): Investors will focus on the breadth of manufacturing orders and business investment. The report can influence growth expectations, cyclical earnings assumptions and Treasury yields, particularly if core capital-goods demand diverges from the current narrative of resilient investment.
Market Insights:
The day’s gain was not a broad-based risk-on move. Positive returns in the S&P 500 and Nasdaq were disproportionately supported by technology and semiconductors, while negative breadth, a weaker Russell 2000 and a lower Dow showed that participation was uneven. The key risk to continued index resilience is a further rise in yields without a corresponding improvement in earnings expectations. Additional warning signs would include persistent deterioration in advance-decline statistics, downward earnings revisions, renewed oil acceleration, a reversal higher in the VIX, or valuation compression in the technology leaders currently carrying a disproportionate share of index performance.
Trading & Investment Strategy:
A risk-managed approach favors selective exposure over chasing index strength. Position size should reflect the higher rate backdrop and the possibility that narrow leadership can reverse quickly. Staging entries can reduce timing risk, while sector selection should emphasize balance-sheet resilience, earnings visibility and pricing power rather than simply following one-day momentum. For tactical positions, predefined exit levels and disciplined stop-loss rules are preferable to adding mechanically into adverse moves. Investors should also distinguish between company-specific dislocations, such as Xenon’s clinical-event repricing, and broader macro trades, and avoid assuming that heavy triple-witching volume confirms a durable trend.
4. Key FAQs About the US Stock Market Today
Why did the US stock market move on September 18, 2026?
U.S. stocks finished mixed because a semiconductor-led technology rally offset rising Treasury yields, oil-driven inflation concerns and weak internal breadth. The S&P 500 and Nasdaq closed higher, but the Dow and Russell 2000 fell. The move came two days after the Federal Reserve raised rates by 25 basis points, leaving investors focused on how persistent inflation and higher borrowing costs will affect valuations and earnings.
Which sectors performed best and worst in the US stock market on September 18, 2026?
Information Technology was the best-performing S&P 500 sector, gaining 0.77%, while Utilities was the worst, falling 1.40%. Technology benefited from semiconductor strength, whereas utilities faced renewed pressure from rising Treasury yields and their bond-like rate sensitivity. The split supports the view that capital was rotating selectively rather than moving uniformly into either cyclical or defensive equities.
What should investors watch after the US stock market close on September 18, 2026?
The next checkpoints are the September 24 New Residential Sales report and the September 25 Advance Durable Goods report, alongside the behavior of the 10-year Treasury yield around 5%. Investors should also monitor whether market breadth improves enough to validate the major indexes’ resilience. A sustained rise in yields, renewed oil strength, weaker earnings revisions or a VIX rebound would raise the risk that narrow technology leadership becomes harder to sustain.
Selected Primary Sources
Disclaimer: This article is intended solely for the exchange of investment ideas and does not constitute investment advice of any kind.