



Key Takeaways
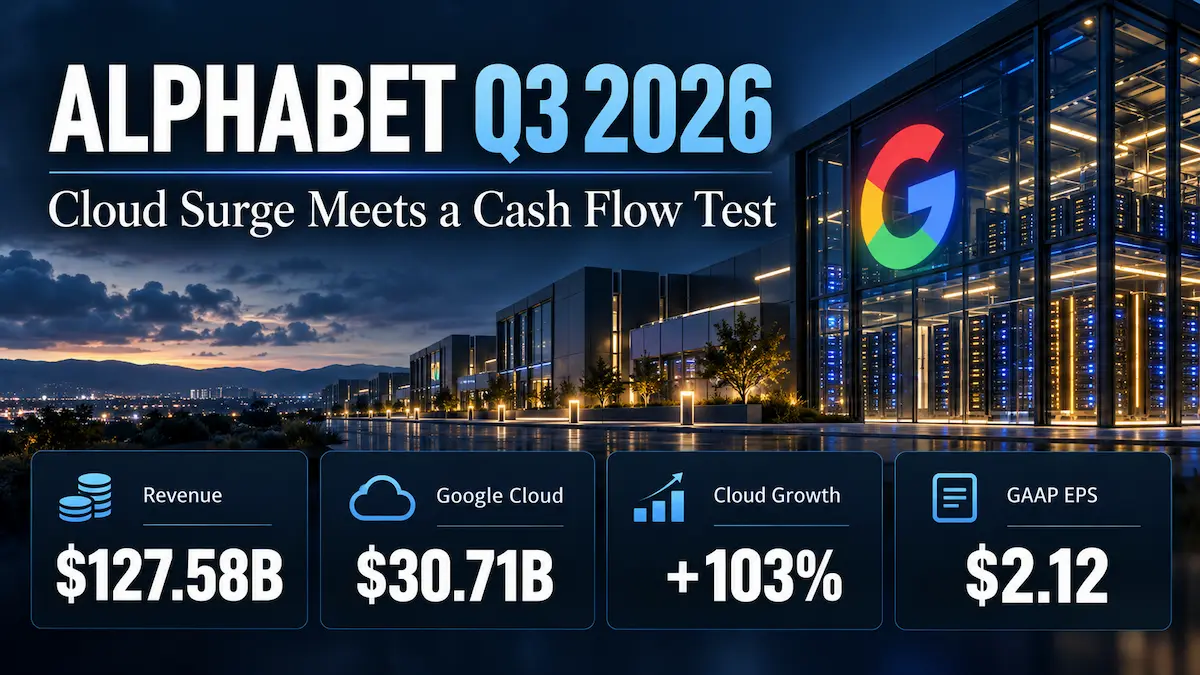
- Alphabet reported $127.577 billion in revenue, up 25% year over year, and GAAP diluted EPS of $2.12; both were below the FactSet expectations cited by the Associated Press.
- Google Cloud revenue rose 103% to $30.709 billion, but the segment’s near-term margin faces pressure as Alphabet rents third-party capacity.
- Operating cash flow of $42.290 billion did not cover $51.355 billion of capital spending, producing negative $9.065 billion of company-defined free cash flow.
- Alphabet maintained 2026 capital expenditure guidance of $195 billion–$205 billion and expects a significant increase in 2027; it did not provide a numerical Q4 revenue or EPS outlook.
- GOOGL fell 9.97% in after-hours trading to $292.50 at 7:59 p.m. ET on October 28, as investors weighed slower Search growth, cash demands and a large investment loss against the Cloud expansion.
This GOOGL Q3 2026 earnings analysis examines the gap between surging Cloud demand and the cash needed to build AI capacity, alongside Search monetization, management’s outlook and valuation risks.
Core Earnings Breakdown
Revenue and Profitability Analysis
Alphabet’s third quarter ended September 30, 2026, produced $127.577 billion of revenue, up from $102.346 billion a year earlier. Operating income increased to $40.576 billion from $31.228 billion, while the operating margin expanded to 31.8%. Net income available to common shareholders fell to $26.170 billion from $34.979 billion, and diluted GAAP EPS declined to $2.12 from $2.87. Revenue and operating profit grew even as below-the-line investment losses reduced reported earnings. The underlying figures come from Alphabet’s official earnings release.
- Google Services: $96.302 billion, up 11%, represented approximately 75.5% of total revenue, calculated from company-reported figures: $96.302 billion ÷ $127.577 billion. Search and other advertising contributed $63.350 billion, up approximately 12%; YouTube advertising added $11.207 billion, up approximately 9%; and subscriptions, platforms and devices generated $14.290 billion, up approximately 11%. Investment reading: Search still finances much of Alphabet’s investment cycle, so a slowdown in monetization matters even when AI usage is rising.
- Google Cloud: $30.709 billion, up 103%, represented approximately 24.1% of revenue, calculated from company-reported figures: $30.709 billion ÷ $127.577 billion. Segment operating income increased to $11.121 billion from $3.594 billion. Investment reading: the growth demonstrates that AI infrastructure demand is becoming material revenue, but TPU system sales and the mix of rented capacity make the durability of the current margin an open question.
- Other Bets: $372 million, up approximately 8% from $344 million, represented approximately 0.3% of consolidated revenue, calculated from company-reported figures: $0.372 billion ÷ $127.577 billion. Its operating loss widened to $2.047 billion from $1.426 billion. Investment reading: Waymo and other ventures offer optionality, but present losses must be funded before their potential value can be realized. An additional $194 million of hedging gains reconciles reported segment revenue to the consolidated total.
Expectations vs. Actual Results
The following comparisons distinguish independently collected analyst estimates from company-reported results. Estimates can differ by provider and accounting treatment.
- Revenue: $127.577 billion actual versus $127.97 billion expected by the FactSet survey cited by the Associated Press — ❌ below expectations by approximately $393 million.
- GAAP diluted EPS: $2.12 actual versus approximately $3.01 expected in the same AP report — ❌ below the cited estimate. The report does not establish that every analyst treated investment gains and losses identically, so the comparison is not a clean operating earnings bridge.
- Operating margin: 31.8% actual. A reliable directly reported consensus margin was not verified, so a beat or miss cannot be established. As a historical comparison, the prior-year margin was approximately 30.5%, calculated from company-reported figures: $31.228 billion ÷ $102.346 billion.
- Next-quarter outlook: management did not give a numerical Q4 revenue, EPS or consolidated operating-margin range. On the call, it described a somewhat larger foreign-exchange headwind, tougher Search comparisons and near-term Cloud margin pressure. Full-year 2026 capex guidance remained $195 billion–$205 billion; management expects a significant increase in 2027 without providing a numerical 2027 range.
The source of the miss was not simply weak demand. Cloud more than doubled, but AP reported that Search and YouTube advertising increases fell short of some expectations. Meanwhile, Alphabet’s release shows an $8.664 billion net loss on equity securities; its after-tax effect reduced diluted EPS by $0.55. That is a disclosed component of the GAAP result, not an officially adjusted EPS figure and not a complete explanation of the gap to consensus.
The market’s immediate focus appeared to be the interaction of Search monetization, the pace of AI investment and future cash conversion. GOOGL closed at $324.89 on October 28 and traded at $292.50 at 7:59 p.m. ET, down 9.97% after hours, according to Stock Analysis. That reaction was weaker than the 25% revenue growth might suggest. The explanations above are an assessment of the evidence, not a verified breakdown of individual investors’ trades; after-hours prices can move materially.
Earnings Call Highlights
The CEO’s comments below are grounded in Google’s official edited transcript of Sundar Pichai’s remarks. CFO commentary is attributed to a third-party full-call transcript; Alphabet’s official call recording is also available. An official full written transcript was not verified.
Pichai said AI investments are driving Search query growth, including commercial queries, at the fastest year-over-year rate in five years.
💡 Reading Between the Lines: More queries can protect distribution and create future ad inventory, but query growth does not itself prove that revenue per query or advertising margins will rise.
Pichai identified AI infrastructure and AI solutions as major drivers of Google Cloud’s 103% revenue growth.
💡 Reading Between the Lines: Alphabet is increasingly selling both hosted compute and complete TPU systems. Investors should distinguish recurring cloud consumption from hardware sales, whose margins and cash cycles may differ.
CFO Anat Ashkenazi said third-party compute capacity would ramp in Q4 and create near-term Cloud margin headwinds.
💡 Reading Between the Lines: Renting capacity can protect customer relationships and accelerate delivery while Alphabet builds its own infrastructure, but near-term revenue conversion may come at a lower incremental margin.
Ashkenazi maintained the 2026 capital-spending range and said spending is expected to rise significantly in 2027.
💡 Reading Between the Lines: The investment horizon now extends beyond a single budget year. A valuation model needs to account for depreciation, financing and the time between capacity deployment and cash receipts.
Management said Google Cloud backlog reached $561 billion, with just over 55% expected to be recognized over the next 24 months.
💡 Reading Between the Lines: Contracted demand supports visibility, but backlog is neither recognized revenue nor cash in hand. Execution, customer consumption and delivery capacity determine how much ultimately converts.
Deep Business Insights
Hidden Metrics That Matter
First, Google Cloud generated approximately 61.6% of Alphabet’s year-over-year revenue increase, calculated from company-reported figures: ($30.709 billion − $15.157 billion) ÷ ($127.577 billion − $102.346 billion). This is a calculation of incremental revenue, not a company-disclosed contribution metric. It shows why investors must judge Cloud as a material growth engine even though Google Services remains the larger business.
Second, quarterly free cash flow was negative $9.065 billion, calculated from company-reported figures: $42.290 billion of operating cash flow − $51.355 billion of purchases of property and equipment. Alphabet also reports this figure as its non-GAAP free cash flow. Operating cash flow included the effect of TPU inventory buildup and a $5.2 billion payment relating to an EU fine, according to the call; neither should be confused with capital expenditure. The inventory build matters because cash leaves before customers are billed for systems.
Customers can choose Alphabet for a combination of custom TPUs, its global infrastructure, AI models, security tools and established enterprise software. That combination can simplify deployment across training, inference and existing workflows, but it is not exclusive: rival clouds and independent model providers give buyers alternatives, and third-party capacity costs can erode the advantage.
Industry Chain Reactions
- ✅ Potential beneficiary — Broadcom (AVGO): A Broadcom filing describes agreements to develop and supply Google TPUs and networking components. Alphabet’s expanding TPU activity could support demand for these suppliers; this is an industry inference, not proof of a new Broadcom order or a forecast of its revenue.
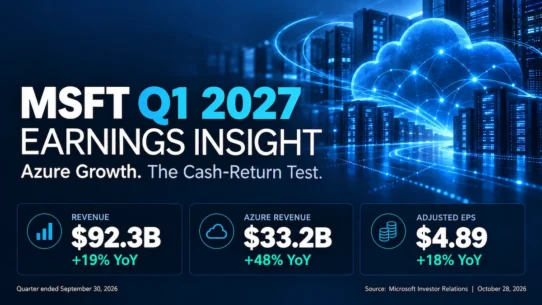
- ❌ Potential pressure — Microsoft (MSFT): Google Cloud’s acceleration and integrated AI infrastructure could intensify competition for enterprise cloud and AI workloads. Google’s gain does not establish that Azure lost revenue or market share in the quarter.
Valuation Framework and Key Risks
At the October 28 regular-session close of $324.89, GOOGL carried a substantial valuation before the post-earnings decline; the $292.50 after-hours quote is a separate, time-stamped indication, not a subsequent official closing price. A useful framework separates three streams: the mature Search and YouTube advertising franchise; Cloud’s growth and operating margin; and the cost of shared AI research, infrastructure, financing and Other Bets.
The main risk is that higher utilization and Cloud revenue arrive more slowly than depreciation, energy costs and capital spending. Slower Search monetization, competition, regulation, hardware mix and capacity purchased from third parties can also change the margin trajectory. Alphabet reported $265.098 billion of cash, cash equivalents and marketable securities at quarter-end, but management said that included $90.4 billion of marketable equity securities; the entire amount should not be treated as cash. The company also issued shares through its at-the-market program, making future dilution another factor to monitor.
Key FAQs
Why did Alphabet stock fall after Q3 2026 earnings despite Google Cloud growth?
Revenue and EPS were below the FactSet figures cited by AP, while some Search and YouTube advertising results disappointed investors. Negative free cash flow and management’s expectation of higher 2027 spending added to the debate about returns on AI infrastructure. The exact contribution of each factor to the share-price move cannot be isolated.
Did Alphabet provide Q4 2026 revenue or EPS guidance?
Management did not provide a numerical Q4 revenue or EPS range on the call. It described foreign-exchange and Search-comparison headwinds and near-term Cloud margin pressure, while maintaining its full-year 2026 capex range of $195 billion–$205 billion.
How much of Alphabet’s Q3 2026 EPS decline came from investment losses?
Alphabet disclosed that the net loss on equity securities reduced diluted EPS by $0.55 after tax. That is a reported effect on GAAP EPS, not a company-issued adjusted EPS measure; other operating, tax and financing items also affect the comparison with the prior year and analyst estimates.
Sources: Alphabet Investor Relations Q3 2026 earnings release; Google’s official edited CEO call remarks; official earnings-call recording; third-party full-call transcript and price snapshot; and Associated Press results and FactSet estimates.
Disclaimer: This article/chart is for educational and informational purposes only and does not constitute investment advice of any kind. Past performance is not indicative of future results. Investors should independently evaluate their own risks.