



Key Takeaways
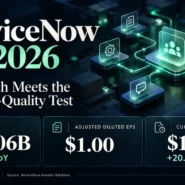
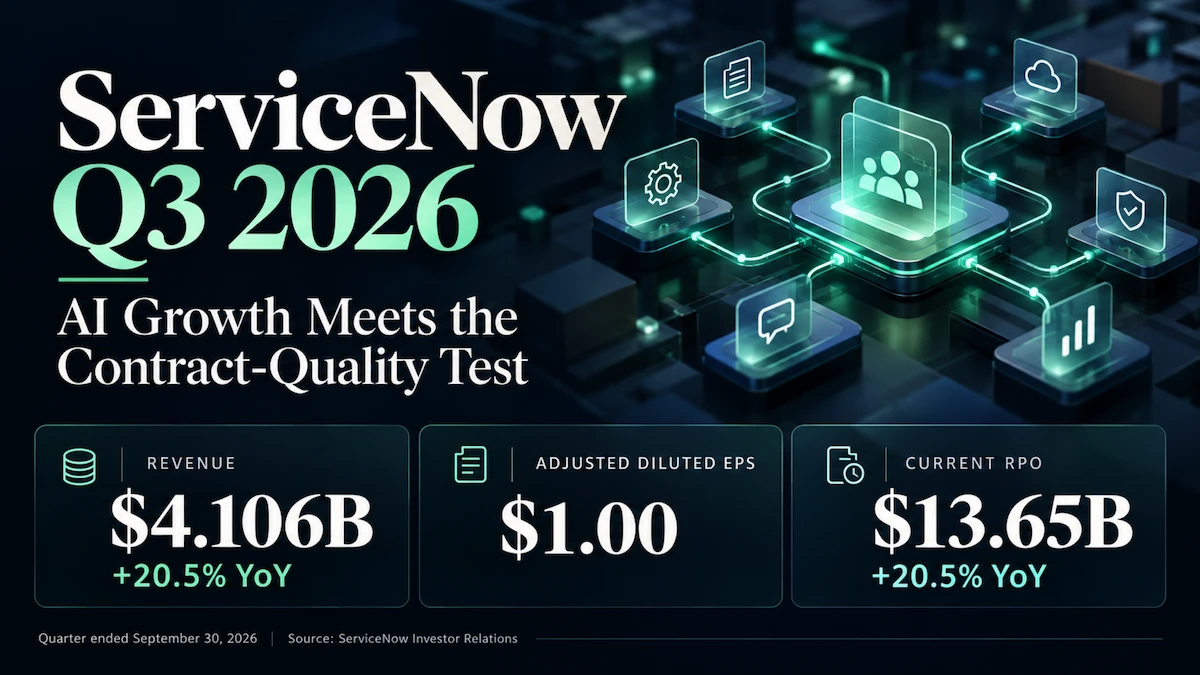
- ServiceNow generated $4.106 billion in revenue, up 20.5%, but adjusted diluted EPS of $1.00 missed the $1.02 analyst consensus.
- Management raised its year-end AI annual contract value target to $1.7 billion. This is a contract metric and a target, not recognized AI revenue.
- Q4 current remaining performance obligation growth guidance of 18.5% demands scrutiny of renewal timing, acquisition contributions and accounting exclusions.
- The investment debate centers on converting AI usage into durable subscription economics while protecting margins and cash generation.
ServiceNow’s October 28 earnings release presents a familiar premium-software dilemma: strong customer activity can coexist with a less convincing forward growth profile. This NOW Q3 2026 earnings analysis separates the reported results from management’s targets and examines what must improve for AI adoption to support shareholder returns.
1. Core Earnings Breakdown
Revenue and Profitability Analysis
For the quarter ended September 30, 2026, total revenue reached $4.106 billion, increasing 20.5% as reported and 20% in constant currency. The company reports one operating segment; its revenue categories should not be confused with separately disclosed ITSM, security or CRM segment sales. Financial figures below are drawn from the Q3 2026 Form 10-Q and the official earnings release.
- Subscription revenue: $3.988 billion, up 21% reported and 20.5% in constant currency. Its revenue share was 97.1% ($3.988 billion ÷ $4.106 billion, calculated from company-reported figures). The recurring base remains the economic engine; the key question is whether AI expands spending per customer sufficiently to offset pressure on traditional seat growth.
- Professional services and other revenue: $118 million, up 10% reported and 9% in constant currency. Its share was 2.9% ($118 million ÷ $4,106 million, calculated from company-reported figures). Deployment assistance can accelerate subscription adoption, but delivery labor must ultimately produce repeatable software consumption rather than a permanently heavier services model.
Profitability requires two lenses. GAAP operating income was $385 million with a company-rounded 9.5% margin, versus 17% a year earlier. Adjusted operating income was $1.338 billion with a 32.5% margin, versus 33.5%. Adjusted subscription gross margin also declined to 80% from 83%, so margin pressure extends beyond acquisition amortization excluded from adjusted earnings.
GAAP diluted EPS was $0.27; adjusted diluted EPS was $1.00 versus a restated $0.95 a year earlier. Historical GAAP and adjusted EPS reflect the five-for-one stock split effective December 17, 2025. Prior adjusted EPS also reflects the exclusion of strategic-investment gains and losses. Comparisons with old, pre-split EPS would be misleading.
Expectations vs. Actual Results
The distinction between beating company guidance and beating Wall Street is material. Reuters, citing LSEG analyst estimates, reported the following consensus comparisons:
- ✅ Revenue beat: $4.106 billion actual versus $4.09 billion consensus across 36 analysts.
- ❌ Adjusted diluted EPS miss: $1.00 actual versus $1.02 consensus across 37 analysts.
- ✅ Operating margin exceeded company guidance: 32.5% adjusted actual, 150 basis points above its prior outlook, according to the CFO. An independent analyst-consensus operating margin was not verified; this comparison is to management’s guidance.
The revenue beat was modest in dollar terms. Strong subscription execution did not translate into an EPS beat. A relevant earnings headwind was the swing in net interest: ($69 million interest income − $81 million interest expense) − ($115 million − $6 million) = a $121 million year-over-year pretax deterioration, calculated from company-reported figures. This helps explain slower earnings growth, but does not establish the exact cause of the consensus miss without analysts’ underlying models. Acquisition amortization and severance are excluded from adjusted EPS and therefore cannot mechanically explain that miss.
For Q4, management guided subscription revenue to $4.245–$4.255 billion, representing 22.5%–23% reported growth and 21.5% constant-currency growth. It projected cRPO growth of 18.5% on both bases and adjusted operating margin of 32%. These are company forecasts, not actual results. The release does not supply a standalone Q4 EPS target. Full-year subscription guidance increased to $15.780–$15.790 billion, while adjusted free-cash-flow margin guidance rose to 36%.
The market reaction sharply diverged from the upbeat AI narrative. At 9:44 a.m. EDT on October 29, Stock Analysis showed NOW at $115.35, down 23.17% from that vendor’s $150.13 previous close. This is a dated intraday observation, not the completed session’s return.
The most defensible interpretation is a reassessment of forward growth quality and earnings conversion. Investors in a recurring-revenue platform tend to place more weight on subscription guidance, cRPO and margin durability than on an isolated revenue beat. Q4 cRPO growth guidance trails Q3’s 21% constant-currency result, while acquisition contributions complicate the organic growth assessment. This interpretation fits the disclosed financial tensions; it is not proof that any single factor caused the price decline.
Earnings Call Highlights
The following are accurate strategic paraphrases, not verbatim quotations. Call-specific details use the public third-party earnings call transcript, cross-checked where available against the official investor presentation. ServiceNow’s official webcast requires registration; its public IR materials did not provide an official written transcript.
Management is retaining subscription commitments while expanding consumption-based monetization.
💡 Reading Between the Lines: Predictable commitments protect the revenue base while usage creates expansion potential. Investors need evidence that paid consumption exceeds any reduction in seat demand and associated inference costs.
Deployment expertise is being bundled into selected large AI contracts.
💡 Reading Between the Lines: Management is investing in implementation to accelerate later usage. The services allocation reduces near-term subscription growth, but recovery remains contingent on customers renewing.
The CFO attributed about half of Q3’s cRPO guidance beat to early renewals pulled forward from Q4.
💡 Reading Between the Lines: Some apparent quarterly strength reflects timing rather than incremental demand. A clean assessment should follow multiple quarters of bookings and revenue conversion.
The raised 36% full-year adjusted free-cash-flow margin outlook benefits from lower capital expenditure.
💡 Reading Between the Lines: Capital efficiency supports cash generation, but lower investment and stronger customer cash collection are different economic drivers. The sustainability of both deserves separate scrutiny.
Control Tower aims to govern AI agents across enterprise systems and model providers.
💡 Reading Between the Lines: ServiceNow is positioning workflow permissions and operational context as the control point for enterprise AI. That position becomes valuable only if customers retain it alongside competing cloud and application platforms.
2. Deep Business Insights
Hidden Metrics That Matter
The first is the accounting composition of forward demand. cRPO reached $13.65 billion, up 20.5% reported, while total RPO reached $29.7 billion, up 22%. Longer contract duration can lift total backlog without an equivalent improvement in near-term revenue conversion.
The official presentation adds three qualifications to Q4’s 18.5% constant-currency cRPO growth outlook. Armis contributes approximately 175 basis points. Termination-for-convenience contract provisions inherited through acquisitions exclude backlog equivalent to approximately 50 basis points of year-over-year subscription backlog growth at year-end. Separately, deployment services shift approximately 50 basis points of Q4 subscription revenue growth into professional services, after approximately 25 basis points in Q3. The CFO also cited a 25-basis-point cRPO headwind from on-premises mix on the call.
These adjustments measure different things. They should not be mechanically added or subtracted to manufacture an “organic cRPO” growth rate. Management’s explanation reduces the case for treating all deceleration as weaker demand, but acquisition contributions also prevent the headline from serving as clean evidence of organic acceleration. Excluded termination-for-convenience contracts contribute future revenue only while they remain in effect; that exclusion also highlights cancellation risk.
The second is cash-flow definition. Operating cash flow less capital expenditure was $839 million − $91 million = $748 million, or 18.2% of revenue ($748 million ÷ $4,106 million), calculated from company-reported figures. ServiceNow’s reported adjusted free cash flow was $822 million, or 20%, after adding back $74 million of business-combination and related cash costs. Those costs still consume cash. The full-year 36% adjusted margin outlook likewise includes an approximately two-percentage-point acquisition-related addback in the guidance reconciliation.
Customers choose ServiceNow because workflows require permissions, routing, records and accountability across existing systems. Its installed operational context can reduce the work required to move an agent from an answer to an authorized action. The commercial test is whether faster deployment leads to recurring paid usage without persistent delivery subsidies or deteriorating subscription gross margin.
Industry Chain Reactions
- ✅ Potential beneficiary — Accenture (ACN): its official joint engineering program with ServiceNow places implementation teams inside customer environments. More production deployments can create integration and change-management work. The risk is that bundled vendor support and automated implementation compress billable effort per deployment.
- ❌ Potential competitive pressure — Salesforce (CRM): ServiceNow’s customer-service expansion overlaps with Salesforce’s Agentforce Contact Center. Enterprise buyers may allocate automation budgets toward whichever platform can complete work across systems with less integration friction. This is a competitive exposure, not evidence of verified Salesforce customer losses.
These are business-model implications rather than forecasts of either stock’s performance. Partner revenue capture and competitive displacement require subsequent evidence.
Valuation Framework and Key Risks
At the cited $115.35 price, a simple earnings sensitivity is $115.35 ÷ ($1.00 quarterly adjusted diluted EPS × 4) = approximately 28.8 times annualized Q3 adjusted EPS, calculated using the cited market price and company-reported EPS. This is a run-rate illustration, not a trailing P/E, a consensus forward multiple or management’s annual EPS guidance. It ignores seasonality and future changes in profitability.
Even after a sharp decline, that framework requires confidence in recurring expansion and earnings conversion. A higher multiple becomes easier to defend if consumption converts into subscription revenue, the Q4 accounting effects unwind as described and gross margins stabilize. It becomes harder to defend if deployment support remains structurally necessary or acquired growth conceals a weaker core.
- AI monetization risk: the $1.7 billion AI ACV target is not revenue, and consumption growth does not disclose incremental gross profit.
- Integration and financing risk: acquired products must earn returns sufficient to cover integration effort and the higher financing burden.
- Margin and ownership risk: the gap between GAAP and adjusted profitability matters, particularly when recurring stock-based compensation is excluded.
- Platform competition: model providers, hyperscalers and application incumbents can compete for the governance and customer-service control points.
The next decisive evidence is conversion: sustained renewal economics, revenue delivery against the Q4 range, cash flow before acquisition-cost addbacks and subscription gross profit. Those measures can distinguish a temporary accounting transition from a lasting deterioration in economics.
3. Key FAQs
Why did ServiceNow stock fall after its Q3 2026 earnings report?
The company beat revenue consensus but missed adjusted EPS consensus, and its Q4 cRPO growth outlook was slower than Q3’s result. Renewal timing and accounting mix explain part of the change, while acquisitions complicate organic comparisons. Together these provide a more useful framework for the observed repricing than attributing it to a generic “sell the news” reaction.
Did ServiceNow generate $1.7 billion of AI revenue in Q3 2026?
No. Management’s $1.7 billion figure is a year-end AI annual contract value target. ACV measures annualized contract value; it is neither quarterly recognized revenue nor proof that the targeted contracts have already been achieved.
What should investors monitor in ServiceNow’s Q4 2026 results?
Track subscription revenue against $4.245–$4.255 billion, the composition of cRPO growth, subscription gross margin and cash generation before acquisition-related addbacks. Then assess whether deployment support produces paid consumption and renewal expansion rather than simply shifting revenue categories.
Sources: ServiceNow Q3 2026 earnings release, official investor presentation, official Form 10-Q and the explicitly identified third-party call transcript. Financial results and guidance are as of October 28, 2026; the market-price observation is timestamped October 29, 2026.
Disclaimer: This article/chart is for educational and informational purposes only and does not constitute investment advice of any kind. Past performance is not indicative of future results. Investors should independently evaluate their own risks.