




Key Takeaways
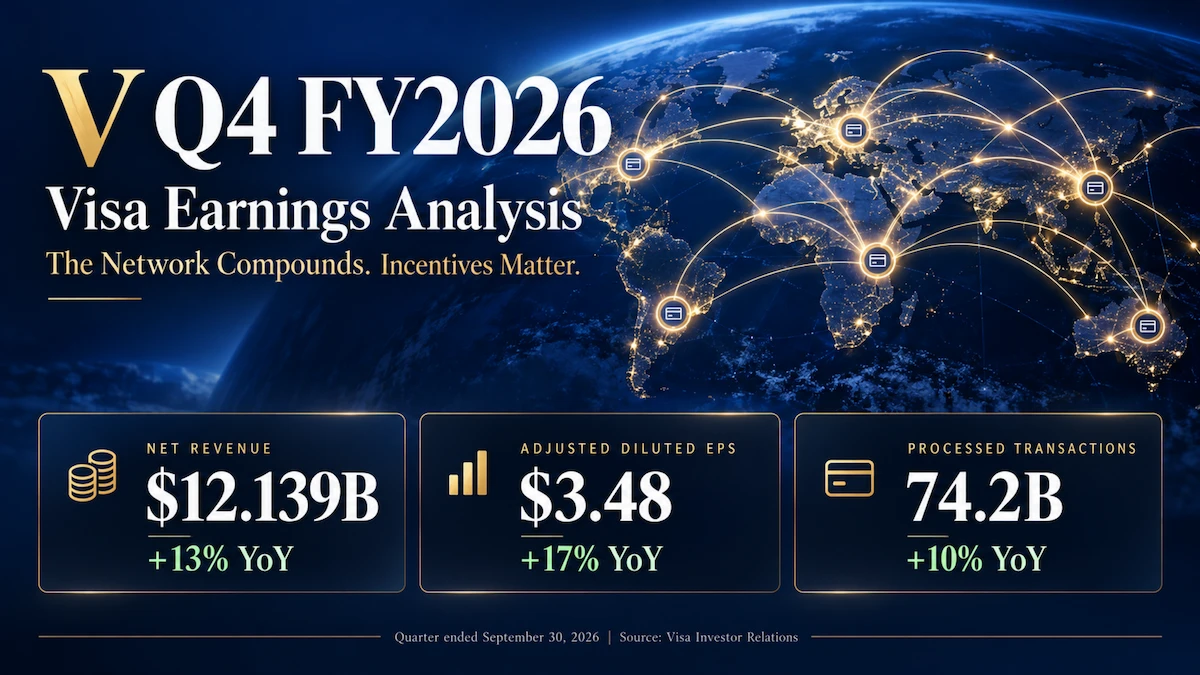
- Visa reported $12.139 billion of quarterly net revenue, up 13%, and adjusted diluted EPS of $3.48, up 17%; both modestly exceeded analyst estimates.
- Payment activity remained resilient, with processed transactions rising 10% and cross-border volume excluding intra-Europe increasing 14% in constant dollars.
- Management expects approximately 25% of payments volume to come up for renewal in FY2027, making client incentives a central test of growth quality.
- Stablecoins and agentic commerce expand Visa’s strategic options, but settlement volume and product adoption should not be confused with near-term earnings.
Visa’s October 27 results reinforced the durability of its payments franchise. The investment question is how much of that economic value the network can retain as it renews large client relationships, expands services and invests in new payment infrastructure. This V Q4 FY2026 earnings analysis examines the difference between strong transaction growth and sustainable per-share compounding.
1. Core Earnings Breakdown
Revenue and Profitability Analysis
For the quarter ended September 30, 2026, Visa generated $12.139 billion in net revenue, increasing 13% on both a reported and constant-dollar basis. GAAP diluted Class A EPS was $3.19, up 22%; adjusted diluted EPS was $3.48, up 17%. The official earnings release supplies the financial results and reconciliations.
Visa discloses four revenue categories before client incentives, rather than four separately reported operating segments. Their combined amount was $5.255 billion + $6.245 billion + $4.115 billion + $1.647 billion = $17.262 billion. The following mix shares equal each category divided by that total and are calculated from company-reported figures; they describe revenue before incentives, not shares of net revenue.
- Service revenue: $5.255 billion, up 14%, representing 30.4% of the four-category total. Recognition primarily reflects the previous quarter’s payments volume, so current spending trends reach this category with a lag.
- Data processing revenue: $6.245 billion, up 16%, representing 36.2%. Growth above transaction growth suggests monetization extends beyond merely handling more payments, although pricing, mix and services must be assessed separately.
- International transaction revenue: $4.115 billion, up 8%, representing 23.8%. Its growth trailed cross-border volume, demonstrating that travel activity alone cannot explain the revenue outcome.
- Other revenue: $1.647 billion, up 40%, representing 9.5%. Its rapid expansion broadens the growth mix, but investors should distinguish recurring client demand from event-related engagements and acquisition effects.
Client incentives of $5.123 billion reduced those categories to net revenue and grew 21%. Meanwhile, payments volume increased 9% in constant dollars and processed transactions reached 74.2 billion, up 10%, according to the official operating data. Volume resilience is valuable, but it does not guarantee the same growth in retained economics.
GAAP operating margin was 59.8% ($7.262 billion operating income ÷ $12.139 billion net revenue). Adjusted operating margin was 66.6% (($12.139 billion − $4.051 billion adjusted operating expenses) ÷ $12.139 billion), versus 66.3% a year earlier (($10.724 billion − $3.611 billion) ÷ $10.724 billion). These margins are calculated from company-reported figures. The adjusted comparison shows modest operating leverage; the larger improvement in GAAP profitability also reflects differences in excluded charges.
Expectations vs. Actual Results
Investing.com’s earnings report provides the analyst estimates used below. The actual figures come from Visa’s release.
- ✅ Net revenue beat: $12.139 billion actual versus $12.09 billion consensus.
- ✅ Adjusted diluted EPS beat: $3.48 actual versus $3.44 consensus.
- Operating margin: 59.8% GAAP and 66.6% adjusted, calculated as above. An independent analyst-consensus margin was not verified, so a margin beat cannot be established.
The quality of the EPS outperformance matters more than its headline. On the call, CFO Chris Suh attributed performance above management’s earnings expectations primarily to a lower-than-expected tax rate. That does not quantify the precise bridge against every analyst’s model, but it cautions against treating the entire EPS beat as improved operating productivity. Pricing and services supported revenue; lower volatility and transaction mix restrained international revenue relative to cross-border volume.
The official presentation guides Q1 FY2027 net revenue and operating expense growth to the low double digits, with EPS growth at the low end of the mid-teens, on a non-GAAP adjusted constant-dollar basis excluding acquisition impacts. Full-year guidance on that same basis calls for low-double-digit net revenue and expense growth, and low-double-digit to low-teens EPS growth. These are management’s forecasts, not actual results or precise numeric ranges.
The distinction between guidance bases is important: the deck’s nominal Q1 revenue outlook is at the high end of the low double digits. It does not provide a standalone dollar revenue or EPS range, or an explicit operating-margin target. A model should retain these stated definitions instead of inventing a dollar forecast from qualitative language.
The initial stock reaction was less positive than the earnings beat. Investing.com reported a 2.3% after-hours decline on October 27 and linked it to the FY2027 outlook. By the October 28 close, however, Visa was down only 0.31% at $400.60. At 10:27 a.m. EDT on October 29, the stock traded at $411.00, up 2.60% from that close. The latter is an intraday snapshot, not a completed-session return.
The plausible valuation tension is forward growth rather than a deterioration in reported transaction activity. A premium network multiple leaves investors sensitive to renewal incentives, normalized tax expense and the pace of services growth. The recovery also shows why an initial after-hours move should not be presented as a lasting verdict on the report.
Earnings Call Highlights
The following are strategic paraphrases, not direct quotations, drawn from the public third-party call transcript. Financial figures are cross-checked against official materials. At the time of research, Visa’s official quarterly earnings page had not yet posted the FY2026 Q4 written transcript.
The CFO said a lower-than-expected tax rate was the primary source of earnings outperformance versus management’s expectations.
💡 Reading Between the Lines: Tax benefits can lift reported EPS without improving the economics of the next transaction. The valuation model should distinguish this benefit from repeatable operating leverage.
Approximately 25% of payments volume is expected to renew in FY2027, versus approximately 20% in FY2026.
💡 Reading Between the Lines: Winning renewals protects future volume but can raise the commercial cost of retention. Services cross-selling must justify the package’s total return, not merely secure a large headline contract.
Management expects value-added services growth in the low-to-mid-20s in FY2027, following 30% constant-dollar growth in FY2026.
💡 Reading Between the Lines: Services remain an important growth engine, but extrapolating the latest rate would overstate management’s outlook. Investors should track demand quality alongside pricing and acquisition contributions.
Stablecoin settlement exceeded a $25 billion annualized volume run rate.
💡 Reading Between the Lines: Visa is adapting its infrastructure to new settlement assets while preserving client access. This is payment flow, not Visa revenue, and does not disclose the associated fee yield.
The CEO described agentic commerce as very small relative to Visa’s business over the next four quarters.
💡 Reading Between the Lines: AI commerce currently supports strategic relevance more than the near-term earnings bridge. The stronger case requires incremental transactions and monetization, rather than simply moving existing purchases to a new interface.
2. Deep Business Insights
Hidden Metrics That Matter
The first metric is incentive intensity. Client incentives ÷ the four revenue categories before incentives = $5.123 billion ÷ $17.262 billion = 29.7%, calculated from company-reported figures. This is an analyst-calculated ratio, not Visa’s disclosed take rate or the share of each payment paid to clients.
Its importance is commercial: the network can grow transaction activity and gross monetization while transferring a larger portion of the benefit to issuers and other partners. Renewal wins therefore need to be judged against net revenue, contract duration and the resulting services relationship. The ratio alone cannot identify the lifetime profitability of a new contract.
The second metric is capital returns relative to free cash flow. For FY2026, operating cash flow of $23.728 billion less $1.671 billion of capital expenditure produced company-reported free cash flow of $22.057 billion. The deck records $20.515 billion of repurchases, including applicable taxes, plus $5.112 billion of dividends. Thus, ($20.515 billion + $5.112 billion) ÷ $22.057 billion = 116.2%, calculated from company-reported figures.
Returning more than one year’s free cash flow can support EPS, but cannot be extrapolated indefinitely without using balance-sheet capacity or improving cash generation. Litigation payment timing also affects annual operating cash flow, so one year’s coverage is not a complete assessment of normalized distribution capacity. Buybacks create the most value when their price and funding preserve attractive returns on retained capital.
Clients choose Visa for acceptance reach, authorization reliability, tokenization, fraud tools and a functioning dispute framework. These are complementary capabilities: a new payment interface still needs a trusted way to identify the buyer, authorize the transaction and resolve failure. The resulting advantage is strongest when clients obtain measurable approval or fraud improvements that exceed the cost of switching or assembling alternatives.
Industry Chain Reactions
- ✅ Potential beneficiary — Circle Internet Group (CRCL): Visa’s official U.S. USDC settlement announcement establishes a distribution route for Circle’s stablecoin within institutional payment workflows. Wider adoption may support USDC balances and utility, but settlement turnover is not automatically new reserve income. Visa supports multiple stablecoins, so its entire reported run rate should not be attributed to USDC.
- ❌ Potential competitive pressure — Mastercard (MA): Visa’s pending $2.4 billion BioCatch acquisition could strengthen its fraud-services bundle against products such as Mastercard Decision Intelligence, which can assess transactions across networks. This could intensify competition for issuer risk budgets. The acquisition remains subject to closing conditions and is expected by the end of Visa’s FY2027 Q2; this analysis does not establish Mastercard market-share losses.
These are conditional business implications, not predictions of either stock’s return. The most useful follow-up evidence is actual institutional adoption, retained balances, client economics and services contract wins.
Valuation Framework and Key Risks
Using the timestamped $411.00 share price and actual FY2026 diluted EPS, $411.00 ÷ $13.27 adjusted EPS = 31.0 times trailing adjusted earnings, while $411.00 ÷ $12.32 GAAP EPS = 33.4 times trailing GAAP earnings. These multiples are calculated using the cited market price and company-reported figures. They are not consensus forward P/E ratios.
That valuation places a meaningful burden on durable growth. The optimistic case rests on resilient spending, services attachment and new flows expanding earnings without proportionate infrastructure costs. The challenge is that incentives and reinvestment can absorb some of the incremental economic value before it reaches shareholders.
- Renewal economics: large clients can use competitive alternatives and contract scale to negotiate better terms.
- Cross-border mix: travel activity, foreign-exchange volatility and transaction mix affect monetization differently.
- Services execution: growth can moderate as event-related engagements normalize, while acquired businesses must earn adequate integration-adjusted returns.
- Legal and regulatory exposure: interchange litigation and challenges to payments practices can affect cash, pricing and network rules. Adjusted earnings exclusions do not eliminate the economic exposure.
- Technology monetization: stablecoins and AI agents may reinforce Visa’s distribution, but could also change routing, pricing and where value accrues.
The next report should be assessed against net revenue after incentives, expense discipline, services growth and cash generation. Those measures are more useful for underwriting the current multiple than assuming every new payment technology immediately expands earnings.
3. Key FAQs
Did Visa beat earnings expectations in Q4 FY2026?
Yes. Net revenue of $12.139 billion exceeded the cited $12.09 billion consensus, and adjusted diluted EPS of $3.48 exceeded $3.44. The CFO’s lower-tax explanation means the earnings beat should be assessed separately from operating performance.
Why are Visa’s FY2027 client renewals important for investors?
Management expects approximately 25% of payments volume to renew. Retaining that business supports the network, while incentives determine how much revenue Visa retains. Broader services relationships can improve contract value, but a renewal announcement alone does not establish attractive economics.
Does Visa’s $25 billion stablecoin figure represent revenue?
No. It is an annualized settlement-volume run rate disclosed on the call, not realized annual revenue or a revenue forecast. Visa’s economics depend on fees and related services, while some activity may replace existing settlement processes rather than create entirely new payment demand.
Sources: Visa’s official Q4 FY2026 earnings release, official financial presentation, official operating data and the explicitly identified third-party earnings call transcript. Results and guidance are dated October 27, 2026; the valuation price is the October 29, 2026, 10:27 a.m. EDT observation.
Disclaimer: This article/chart is for educational and informational purposes only and does not constitute investment advice of any kind. Past performance is not indicative of future results. Investors should independently evaluate their own risks.