




Key Takeaways
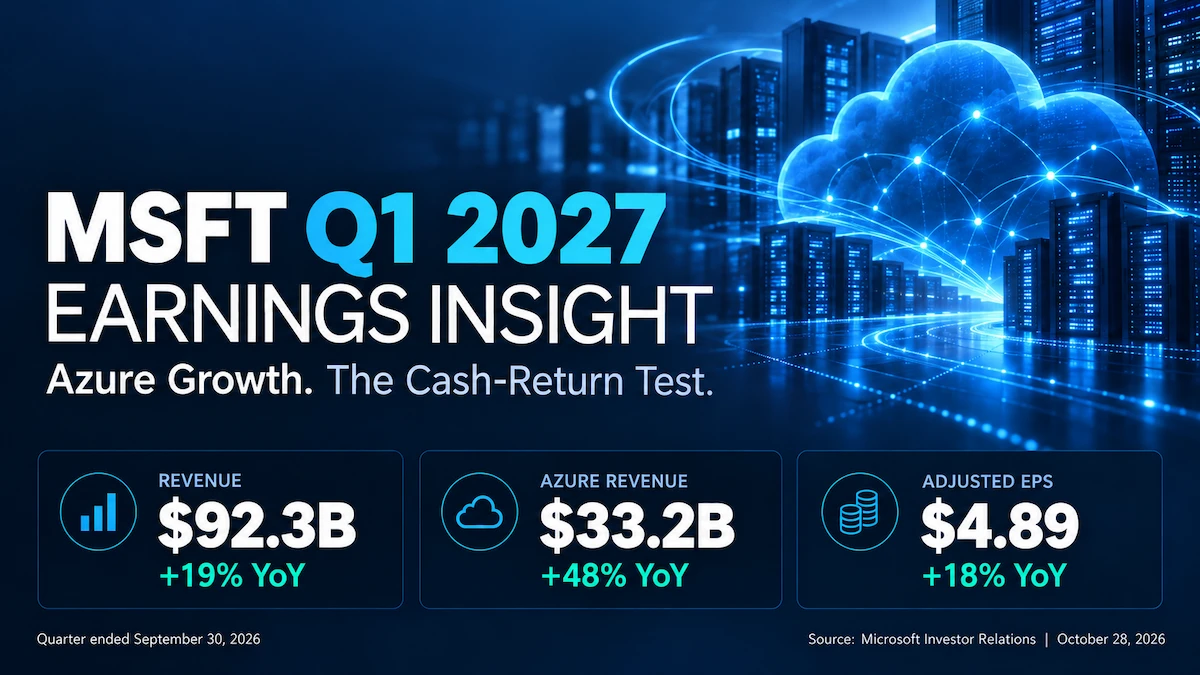
- Microsoft’s fiscal Q1 2027 revenue reached $92.279 billion, up 19%; adjusted EPS of $4.89 exceeded MarketBeat’s $4.71 consensus.
- Azure revenue grew 48%. Management’s next-quarter outlook calls for 49–50% growth in constant currency, supported partly by engineering efficiencies.
- Operating profitability remains strong, but capital investment makes cash conversion the more demanding test of AI economics.
- The $677 billion commercial backlog offers visibility; its recognition schedule matters more than the headline total.
- Copilot’s shift toward consumption creates upside beyond seats, while increasing the importance of customer usage, pricing and delivery costs.
Microsoft’s September-quarter results strengthen the argument that enterprise AI demand is becoming a commercial business. The investment question is how much of that demand can become durable cash earnings after the infrastructure bill. This MSFT Q1 2027 earnings analysis examines the results released on October 28, 2026, for the quarter ended September 30, 2026, using Microsoft’s official financial statements and full earnings call transcript.
Core Earnings Breakdown
Revenue and Profitability Analysis
Microsoft reported operating income of $45.915 billion and GAAP diluted EPS of $4.92. Adjusted EPS excludes the investment impact from OpenAI. The distinction matters: investment accounting can move headline earnings without changing operating execution. The source figures are in the official FY27 Q1 earnings release.
Microsoft changed its reporting structure for FY2027 and recast the comparative periods. Investors should use the new segments consistently rather than compare them directly with the former segment definitions.
- Agents and Infra: revenue of $76.795 billion, up 25%, represented 83.2% of sales. Its investment appeal lies in monetizing several layers of the same enterprise workload; its vulnerability is that infrastructure demand requires substantially more capital than traditional software subscriptions.
- Devices and Consumer: revenue of $15.484 billion, down 3%, represented 16.8% of sales. Search provides an offset, but this segment remains exposed to PC inventories and gaming release cycles rather than sharing uniformly in the AI acceleration.
The segment shares above are calculated from company-reported figures: $76.795B ÷ $92.279B and $15.484B ÷ $92.279B. Within the product disclosures, Azure generated $33.165 billion, while Microsoft 365 cloud generated $27.778 billion. These product categories sit within the reporting structure and should not be added to segment revenue.
The official investor metrics show Microsoft Cloud revenue of $63.9 billion, up 30%, and a 66% cloud gross margin, versus 68% a year earlier. Microsoft 365 commercial cloud grew 17% as reported; management’s normalized growth measure was 18%, removing a prior-year revenue-recognition benefit. Paid commercial seats increased 5%.
That combination points to monetization and product mix becoming more consequential than user expansion alone. Premium subscriptions and consumption can raise spending per customer, but seat growth and revenue growth have different scopes, so dividing one by the other would not produce a reliable disclosed ARPU figure.
Expectations vs. Actual Results
Consensus varies by provider. The comparisons below use the figures displayed on MarketBeat’s earnings report when checked on October 29, 2026; they are analyst estimates, clearly distinguished from company-reported results.
- Revenue: $92.279 billion actual versus $90.62 billion consensus. ✅ Beat by approximately $1.66 billion.
- Adjusted EPS: $4.89 actual versus $4.71 consensus. ✅ Beat by $0.18. GAAP EPS was $4.92 and is not the basis of this consensus comparison.
- Operating margin: 49.8% actual, calculated from company-reported figures as $45.915B ÷ $92.279B. A reliable comparable consensus margin was unavailable; no beat or miss is assigned.
The genuine source of upside was better monetization of available cloud capacity. CFO Amy Hood identified GPU efficiencies, previously underused CPU capacity and stronger revenue per token as contributors. That is more encouraging than an earnings beat driven solely by a below-the-line gain, but some of these benefits can vary with model mix and engineering delivery.
Investors should prioritize Azure growth and the forward cash requirements over the isolated EPS surprise. The earnings call linked incremental revenue to both better utilization and higher token pricing. The first improves infrastructure productivity; the second can reverse as model prices and customer workloads change.
For fiscal Q2 2027, management guided to total revenue of $96.0–$97.1 billion, Azure growth of 49–50% in constant currency, and Microsoft Cloud gross margin of approximately 65%. Capital expenditures are expected to exceed $50 billion. Microsoft did not provide a numerical EPS forecast. These are management’s forward-looking expectations, not realized results; see the official Q2 outlook.
At 8:20 a.m. Eastern on October 29, MarketBeat displayed MSFT at $535.79 in premarket trading, up 0.90% from the October 28 close of $531.01. The positive but restrained move alongside strong results is consistent with investors weighing the spending burden against growth, although a price move alone cannot establish causation. This is a timestamped premarket observation, not a completed October 29 session return.
Earnings Call Highlights
The following strategic points are paraphrases verified against Microsoft’s official earnings call transcript, rather than verbatim quotations.
Hood: Azure’s upside reflected efficiency, capacity monetization and token pricing; further efficiencies are needed as some supply slips into the fiscal second half.
💡 Reading Between the Lines: The growth outlook depends on operational execution as well as spending. A delivery delay can constrain sales even when demand is available, while a favorable pricing mix may be less durable than a structural cost improvement.
Nadella: Copilot combines subscriptions with consumption, opening access to business budgets beyond central IT.
💡 Reading Between the Lines: Microsoft is seeking a share of the economic value of completed work. That expands its revenue opportunity, but adoption outside software development requires customers to understand and control a less predictable bill.
Nadella: Model choice, enterprise context and agent governance form a connected platform.
💡 Reading Between the Lines: Microsoft can preserve its customer relationship even when the preferred model changes. The commercial objective is to make orchestration, data access and security indispensable across multiple models.
Hood: Lower first-quarter capital expenditure reflected delivery timing, with spending accelerating later.
💡 Reading Between the Lines: Investors should avoid capitalizing a temporary cash-flow benefit as permanent efficiency. Leasing and debt can preserve flexibility, but financing changes the payment schedule rather than removing the economic cost of infrastructure.
Hood: Microsoft did not disclose a new paid Copilot seat total this quarter.
💡 Reading Between the Lines: Usage momentum is informative, but it does not establish the size of the paying base or standalone product profitability. Valuation should demand evidence of recurring monetization rather than infer revenue from activity statistics.
Deep Business Insights
Hidden Metrics That Matter
The first is backlog maturity. Commercial remaining performance obligations rose 73% year over year to $677 billion, but the official metrics show $678 billion in the preceding quarter. That small sequential decline is calculated from company-reported figures as $677B − $678B = −$1B; the published totals are rounded. Commercial bookings fell 12%, with management citing large commitments in the comparison period.
The call adds the crucial detail: roughly 30% of RPO is expected to become revenue within twelve months, with that portion growing 29%, while the longer-dated portion grew 98%. A large backlog therefore supports visibility without implying equally rapid near-term revenue growth. The decision-useful test is whether the nearer-term portion keeps expanding as capacity becomes available.
The second is cash conversion after physical investment. Operating cash flow was $58.000 billion and cash additions to property and equipment were $39.367 billion. Free cash flow of $18.633 billion is calculated from company-reported figures as $58.000B − $39.367B, consistent with management’s rounded $18.6 billion figure.
That produces a 20.2% free-cash-flow margin, calculated from company-reported figures as $18.633B ÷ $92.279B. It is a different lens from the nearly 50% operating margin: depreciation spreads investment costs over time, while cash flow captures the immediate funding burden. Reported capex of $45.2 billion includes different timing and lease treatment from cash PP&E; subtracting it directly from operating cash flow would not reproduce Microsoft’s free cash flow measure.
Why do customers choose Microsoft despite that capital intensity? Its established work environment supplies identity, permissions, communications and business context, while Azure and its data services host the workload. Buying those layers together can reduce integration and governance work. This is an investment inference from the platform described on the call; it does not prove that every customer will consolidate vendors or accept higher prices.
The moat is strongest when customers embed agents in recurring workflows and data permissions. It is weaker when customers buy interchangeable computing capacity solely on price. Monitoring that mix helps distinguish an enterprise platform return from a commodity infrastructure return. For the broader franchise context, see our Microsoft business model and moat analysis.
Industry Chain Reactions
- ✅ Potential beneficiary — NVIDIA (NVDA): Microsoft’s capacity expansion supports demand for AI accelerators and associated systems. Its official NVIDIA GTC announcement establishes the infrastructure relationship. This is a directional inference, not a new order forecast; Microsoft’s own silicon and workload optimization can reduce accelerator spending per unit of output.
- ❌ Potential competitive pressure — Salesforce (CRM): Microsoft’s effort to bring sales tasks into its work environment can contest the agent budget and daily user interface. Its official Sales agent overview describes integration with Salesforce CRM. The pressure is an inference about spending and engagement, with an offset: integration can preserve Salesforce as the underlying system of record.
Valuation Framework and Key Risks
At the timestamped $535.79 premarket price, Microsoft traded at 27.4 times a simple annualized Q1 adjusted earnings run rate: $535.79 ÷ ($4.89 × 4). This is a calculation using a market quote and company-reported EPS, not a trailing P/E, consensus forward multiple or earnings forecast. It ignores seasonality and future changes in costs and revenue.
That reference level requires more than persistent demand. Investors need evidence that each increment of infrastructure produces enough recurring cash to sustain reinvestment and shareholder returns. A useful valuation process separates operating profit, cash investment, lease commitments and investment gains rather than relying on a single earnings multiple.
- Capacity risk: delayed deliveries can postpone revenue while execution still requires power, networking and deployment readiness.
- Pricing risk: higher token revenue helped Q1; competition and shifts toward cheaper models can change the relationship between usage and revenue.
- Margin risk: product-level efficiency can improve while a shift toward infrastructure reduces the aggregate cloud gross margin.
- Cash-flow risk: management’s expectation of positive FY2027 free cash flow does not specify how much cash will remain after the accelerated buildout.
- Disclosure risk: activity growth without a new paid-seat total limits precision in modeling Copilot. Financing flexibility should not be confused with an announced equity issuance or acquisition dilution.
The bullish case is a shared infrastructure pool that earns revenue across computing, data, applications and governance. The demanding test is whether that integration produces cash returns after the buildout matures. The next evidence to watch is backlog conversion, capital delivery timing and the durability of monetization gains alongside the Azure growth rate.
Key FAQs
Did Microsoft beat earnings expectations in fiscal Q1 2027?
Yes. Revenue and adjusted EPS exceeded the MarketBeat consensus cited above. A reliable comparable operating-margin estimate was unavailable, so the margin result is reported without assigning a consensus beat or miss.
What is Microsoft’s Azure growth guidance for fiscal Q2 2027?
Management expects 49–50% growth in constant currency. The outlook assumes further efficiency gains and reflects some third-party GPU capacity deliveries moving into the fiscal second half.
Why does Microsoft’s AI capital expenditure matter for MSFT valuation?
Capital spending affects cash available to shareholders before the full cost appears through depreciation. Investors should assess the revenue and cash generated by deployed assets, the timing of lease obligations and whether utilization remains strong as more capacity arrives.
Sources: Microsoft Investor Relations’ FY2027 Q1 earnings release, investor metrics, official earnings call transcript and Q2 outlook; consensus and the timestamped market quote from MarketBeat. Figures and links checked October 29, 2026.
Disclaimer: This article/chart is for educational and informational purposes only and does not constitute investment advice of any kind. Past performance is not indicative of future results. Investors should independently evaluate their own risks.