


Key Takeaways
- SLB beat revenue and adjusted EPS expectations, but acquisition effects make the headline growth rate an incomplete measure of underlying demand.
- Sequential profitability improved across its four principal divisions; year-over-year earnings power still needs rebuilding.
- The fourth-quarter outlook assumes no sequential Middle East revenue recovery, creating potential upside and meaningful geopolitical risk.
- Data Center Solutions adds a new growth avenue, but management explicitly cautioned that it does not currently lift the group’s overall margin.
- The investment case now depends on converting stronger activity and subsea orders into cash while funding expansion and the proposed Kelvion acquisition.
SLB’s latest earnings report gives investors reasons to raise their assessment of the recovery without treating the business as fully normalized. This SLB Q3 2026 earnings analysis examines the quarter ended September 30, released October 23, 2026, alongside management’s prepared remarks and full earnings-call Q&A. All financial amounts are in U.S. dollars. Market data are timestamped separately below.
The central question is how much value to assign to improving oilfield activity before that improvement becomes durable profit growth. A second question is whether the company’s expansion into AI infrastructure can earn an attractive return on capital. Revenue momentum alone cannot settle either question.
Core Earnings Breakdown
Revenue and Profitability Analysis
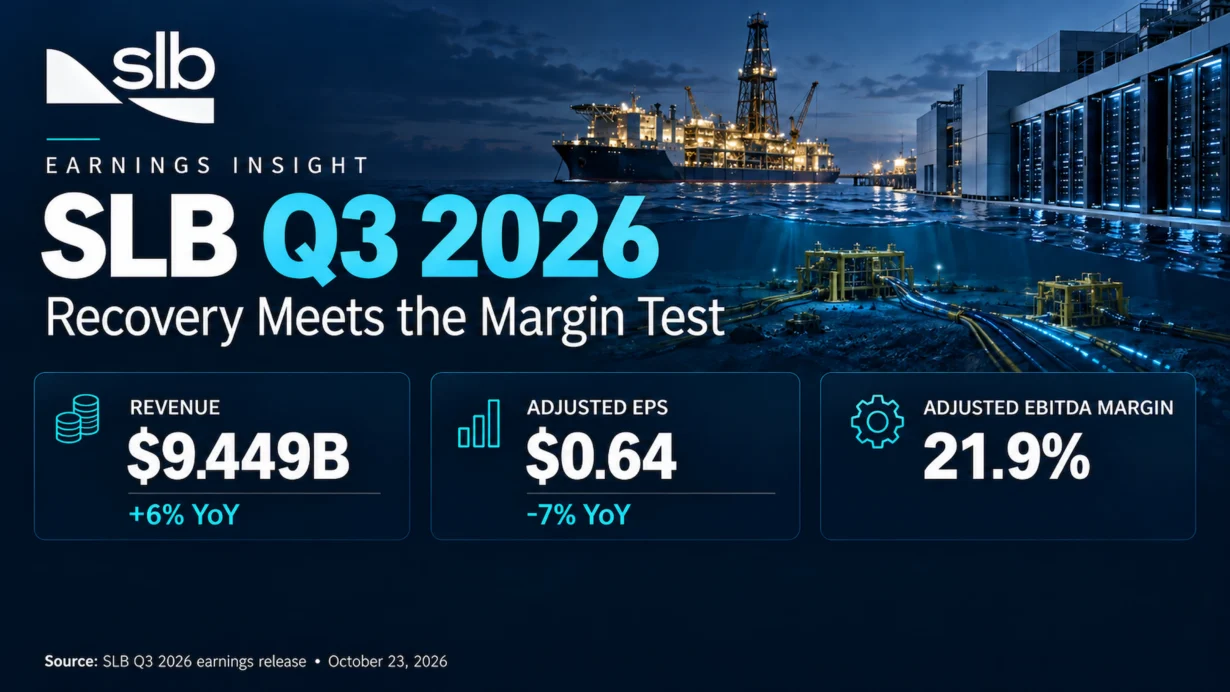
The official earnings release reports revenue of $9.449 billion, up 6% year over year and 5% sequentially. GAAP EPS was $0.49; EPS excluding charges and credits was $0.64, down 7% year over year. Adjusted EBITDA was $2.067 billion, with a 21.9% margin versus 23.1% a year earlier. GAAP net income attributable to SLB was $735 million.
The following division margins are non-GAAP pretax segment operating margins, also detailed in the CFO’s prepared remarks.
- Production Systems: revenue $4.000 billion, up 15% year over year; pretax segment operating margin 16.1%. Its production exposure provides a different demand profile from new-well drilling, but investors should test how much growth survives acquisition comparisons.
- Well Construction: revenue $2.888 billion, down 3%; margin 16.4%. Improving utilization can generate substantial incremental profit, while discounting on new tenders could limit that benefit.
- Reservoir Performance: revenue $1.634 billion, down 3%; margin 16.3%. Recovery and intervention spending may prove more defensible than discretionary exploration, although project timing still matters.
- Digital: revenue $693 million, up 5%; margin 28.0%. Its economics make adoption and recurring workflow integration more valuable than isolated large software sales.
Division shares of consolidated revenue are 42.3%, 30.6%, 17.3% and 7.3%, respectively, calculated from company-reported figures as each division’s revenue divided by $9.449 billion. These are not an additive portfolio pie: All Other and intersegment eliminations also enter consolidated revenue.
The investment distinction is between sequential repair and a completed earnings recovery. A business can improve utilization from a weak quarter while still earning less on each revenue dollar than it did last year. Investors should therefore reward sustained margin progression more heavily than a single quarter’s sales acceleration.
Expectations vs. Actual Results
MarketBeat’s earnings record provides the following consensus benchmarks. These are analyst expectations, not company guidance:
- Revenue: actual $9.449 billion versus approximately $9.27 billion expected. ✅ Beat, by approximately 1.9%, calculated using the rounded consensus figure.
- Adjusted EPS: actual $0.64 versus $0.6170 expected. ✅ Beat by $0.023 per share. GAAP EPS should not be compared with this adjusted benchmark.
- Operating profitability: SLB’s disclosed non-GAAP pretax segment operating margin was 16.7%, up 104 basis points sequentially but down 153 basis points year over year. A comparable, independently verifiable consensus margin was unavailable, so a margin beat or miss cannot be established. This measure is not consolidated GAAP operating margin.
The operating explanation for the stronger quarter is broader activity, production-related demand and better sequential cost absorption. The evidence does not support allocating a precise portion of the consensus beat to each division, because analysts’ underlying segment assumptions are not disclosed in these sources.
The GAAP-to-adjusted EPS bridge also matters: merger and integration charges contributed $0.03 per share and a noncash pension settlement contributed $0.12. These explain the difference between the two earnings measures; they do not explain away the year-over-year decline in adjusted EPS. That distinction prevents a misleading assessment of earnings quality.
In its official prepared remarks, management guided to approximately $10 billion of Q4 revenue, up 5%–7% sequentially, and 100–150 basis points of sequential adjusted EBITDA margin expansion. The outlook assumes Middle East revenue remains around $1.9 billion, flat sequentially. Applying the guided expansion to the rounded Q3 margin implies approximately 22.9%–23.4%; this range is calculated from company-reported figures and guidance, not a separately quoted company forecast. No numerical Q4 EPS guidance was provided in these remarks.
Historical trading data show SLB closed October 23 at $53.06, up 7.08% from $49.55. The positive reaction therefore coexisted with weaker year-over-year adjusted earnings. My interpretation is that investors placed greater weight on the direction of margins, the Q4 outlook and future order conversion than on trailing EPS alone. Price action cannot prove the contribution of any individual catalyst.
This quarter shifts attention to guidance and execution. Subsea orders influence revenue visibility, Digital influences profit mix, and Middle East utilization influences incremental margins. For 2027, management’s mid-single-digit growth commentary refers to the oilfield services and equipment market under specified geopolitical assumptions; it is not formal consolidated SLB revenue or EPS guidance.
Earnings Call Highlights
The following are accurate paraphrases of management’s official earnings-call transcript, not verbatim quotations.
CFO Stephane Biguet: SLB retained Middle East resources to preserve its ability to serve a recovery.
💡 Reading Between the Lines: Investors are paying for readiness through today’s cost base. The strategy creates operating leverage if demand returns, but prolonged disruption would extend the burden of underused capacity.
CFO Stephane Biguet: Rapid Data Center Solutions growth is not currently accretive to SLB’s overall margin.
💡 Reading Between the Lines: AI infrastructure deserves a growth option in the valuation model, with a separate return-on-capital test. Assigning software-like economics to industrial project revenue would overstate its present earnings quality.
CEO Olivier Le Peuch: OneSubsea expects to exceed its two-year $9 billion bookings target, with orders supporting later-year revenue.
💡 Reading Between the Lines: Longer visibility can reduce forecasting uncertainty. Investors still need to model delivery schedules, project costs and cash collection before converting bookings into equity value.
CEO Olivier Le Peuch: Data Center Solutions targets an annualized exit revenue rate above $2 billion in 2027.
💡 Reading Between the Lines: An exit rate describes the pace at year-end, not sales earned throughout the year. A slower ramp could leave the headline milestone intact while reducing cumulative revenue and cash generation.
Deep Business Insights
Hidden Metrics That Matter
The acquisition-adjusted growth gap is the first metric to watch. SLB reports only 2% year-over-year revenue growth excluding the ChampionX acquisition’s impact. Its supplemental pro forma comparison also implies growth of ($9.449 billion ÷ $9.229 billion − 1) × 100 = approximately 2.4%, calculated from company-reported figures. This pro forma calculation is a separate comparison and should not be relabeled as the company’s organic growth rate.
That gap changes the investment question from whether sales are growing to whether existing operations can compound without continuing acquisitions. A higher-quality recovery would combine comparable growth with better profitability and cash generation. Acquired revenue can be economically valuable, but the acquisition price and funding costs must earn their place in the analysis.
The second metric is ChampionX’s adjusted EBITDA margin: $239 million of adjusted EBITDA ÷ $956 million of acquired-business revenue = 25.0%, calculated from company-reported figures. That exceeds the consolidated adjusted EBITDA margin, although it compares a business contribution with a group result containing corporate costs. It is not a separately reported GAAP segment margin or a fully allocated standalone return.
This supports a more discriminating acquisition thesis: production chemistry and artificial lift can improve the earnings mix even while drilling-related businesses remain below earlier profitability levels. The next test is whether integration and international distribution create incremental returns after capital and integration costs.
Why choose SLB? My assessment is that customers can value the combination of subsurface knowledge, drilling workflows, production equipment and local execution. A coordinated solution can reduce handoffs among suppliers and improve accountability for field performance. That advantage must be demonstrated through customer economics; technical breadth by itself does not guarantee pricing power.
The same logic applies to data centers. SLB’s Kelvion transaction FAQ describes combining modular engineering and fabrication with thermal management. The commercial opportunity is to help customers bring capacity online with fewer integration problems. The financial question is whether that convenience produces durable margins rather than merely a larger volume of competitively priced construction work.
Industry Chain Reactions
These are conditional investment implications, not reported changes to the following companies’ earnings forecasts:
- ✅ Potential beneficiary — TechnipFMC (NYSE: FTI). SLB’s subsea commentary strengthens the case for a broad offshore investment cycle that could also support TechnipFMC’s order opportunities and execution utilization. TechnipFMC’s own results describe its subsea equipment and integrated project exposure. The transmission mechanism is shared customer spending, not an assumption that SLB will subcontract work to FTI; direct competition remains a counterweight.
- ❌ Potential competitive pressure — Vertiv (NYSE: VRT). If Kelvion closes and SLB successfully bundles cooling with modular infrastructure, customers could gain another credible integrated supplier. Vertiv’s modular liquid-cooling offering establishes the area of overlap. This creates a potential bidding and differentiation challenge, not evidence of lost market share; expanding AI infrastructure demand could support both companies.
Valuation Framework and Key Risks
The available price snapshot was $52.57 at 9:31 a.m. EDT on October 26, 2026, according to Stock Analysis. At that price, $52.57 ÷ ($0.64 × 4) = approximately 20.5 times annualized Q3 adjusted EPS. This is an analyst calculation using a market quote and company-reported earnings, not a trailing-twelve-month P/E, forward consensus multiple or earnings forecast. Seasonality makes a single-quarter annualization an imperfect anchor.
Even this deliberately simple check shows why the stock requires more than stabilization. A satisfactory investment outcome depends on a combination of earnings recovery, sustainable growth and the valuation investors will pay when that recovery arrives. A compelling business outlook can still produce a modest stock return if too much of the improvement is already capitalized.
A useful framework values the oilfield operations on normalized cash generation, assesses Digital’s profit contribution separately, and gives Data Center Solutions value only after allowing for ramp costs and capital needs. Company revenue should not receive two overlapping premiums for the same AI opportunity, and acquisition-related value should be assessed after the consideration paid.
- Geopolitical and utilization risk: renewed disruption could delay the very recovery for which SLB has retained resources. Watch activity and incremental margins together.
- Margin and pricing risk: revenue growth can disappoint shareholders if competitive tenders, inflation or a lower-margin mix absorb the benefit.
- Capital allocation risk: the announced Kelvion terms involve approximately $3.4 billion in cash plus $0.7 billion of assumed debt, with closing expected in the first half of 2027 subject to conditions. The relevant risks are financing, integration and returns; an announced stock-issuance dilution story would misdescribe those terms.
- Execution and valuation risk: subsea delivery delays, a slower data-center ramp or weak cash collection could leave improving reported sales without the expected increase in shareholder value.
The next report should answer three practical questions: does margin expansion accompany the guided sales increase, do acquired operations maintain their economics, and does growth translate into cash after investment? Those observations will provide stronger evidence for a lasting rerating than another isolated EPS beat.
Key FAQs
Did SLB beat Q3 2026 earnings estimates despite lower year-over-year EPS?
Yes. Adjusted EPS exceeded the consensus benchmark even though it declined from the prior year. A beat measures performance against expectations; year-over-year growth measures performance against an earlier reporting period. Both can be true.
What does SLB’s Q4 2026 guidance imply about Middle East recovery?
The outlook assumes flat sequential Middle East revenue. Recovery beyond that assumption could improve utilization and profitability, while further disruption could undermine the forecast. The assumption should be treated as a scenario boundary, not a guarantee.
Does SLB’s 2027 data-center target mean $2 billion of full-year revenue?
No. Management described an annualized exit revenue rate above that level. Full-year sales depend on the path of the ramp, and revenue growth must be assessed alongside margins, working capital and investment requirements.
Sources: Financial results were verified against SLB’s official Q3 2026 earnings release, prepared remarks and full earnings-call transcript hosted by SLB Investor Relations. Analyst expectations and dated market prices are linked where used; calculations and investment interpretations are identified separately.
Disclaimer: This article/chart is for educational and informational purposes only and does not constitute investment advice of any kind. Past performance is not indicative of future results. Investors should independently evaluate their own risks.