
Key Takeaways
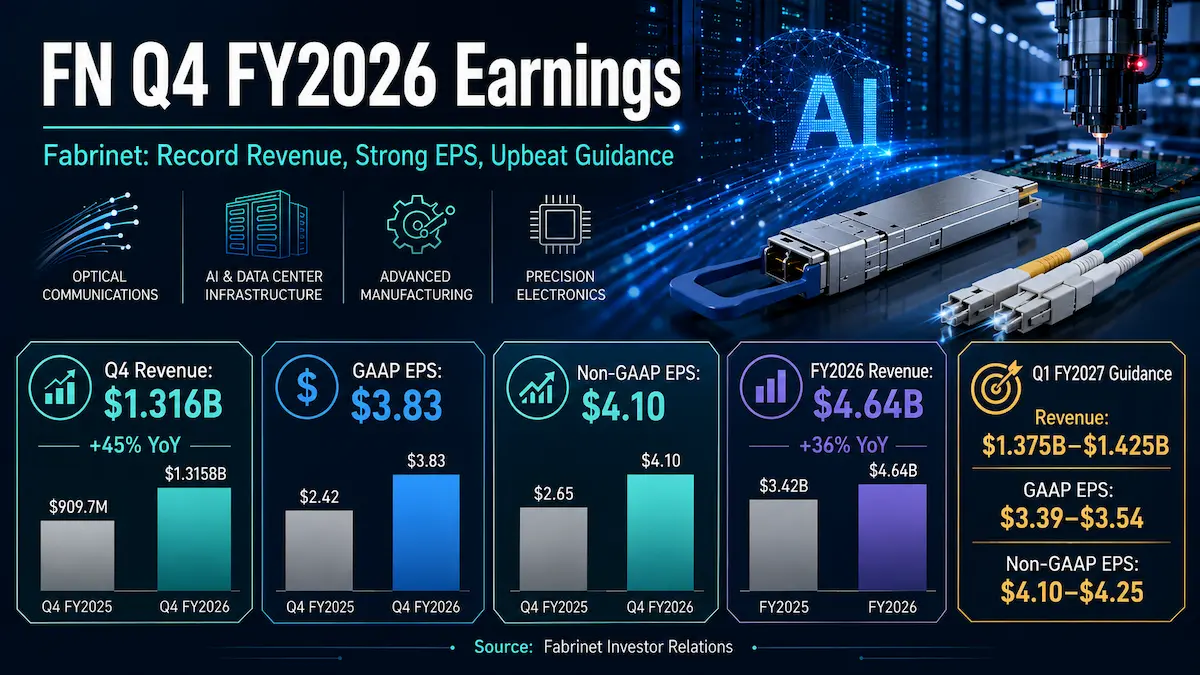
- Fabrinet reported fiscal Q4 2026 revenue of $1.3158 billion, up 45% year over year, with non-GAAP EPS of $4.10. Both exceeded Wall Street consensus and the company’s prior guidance range.
- Data-center revenue reached $669.3 million, or 51% of total sales, growing 68% year over year. DCI alone reached a quarterly level equivalent to more than a $1 billion annualized run rate.
- Q1 FY2027 guidance was materially above pre-earnings consensus: revenue of $1.375-$1.425 billion versus roughly $1.32 billion expected, and non-GAAP EPS of $4.10-$4.25 versus about $3.99 expected.
- The stock still fell roughly 7% after hours to about $556, suggesting investors were discounting the headline beat and focusing instead on valuation, a modest step-down in year-over-year growth at the Q1 midpoint, negative free cash flow, and the execution burden created by aggressive capacity expansion.
- The long-term thesis is increasingly tied to Fabrinet becoming a critical outsourced manufacturing platform for AI-era optics, DCI, HPC, NPO/CPO packaging and complete network systems rather than remaining a conventional low-margin electronics manufacturer.
1. Core Earnings Breakdown
Revenue and Profitability Analysis
Fabrinet delivered one of the strongest quarters in its history. Fiscal Q4 2026 revenue was $1.3158 billion, up 45% year over year and 8% sequentially on the company’s reported rounded growth rates, versus $909.7 million a year earlier and $1.2143 billion in Q3. GAAP net income rose to $139.3 million from $87.2 million, while GAAP diluted EPS increased to $3.83 from $2.42. On a non-GAAP basis, net income reached $149.1 million and diluted EPS reached $4.10, versus $95.6 million and $2.65 a year earlier.
Profitability was more nuanced than the EPS growth alone suggests. Non-GAAP gross margin was 12.2%, up 10 basis points sequentially but down 30 basis points from 12.5% a year earlier. Non-GAAP operating margin, however, increased to 10.9% from 10.7% in both Q3 FY2026 and Q4 FY2025. That divergence matters: Fabrinet is not expanding earnings through gross-margin inflation; it is extracting operating leverage from scale, with operating expenses representing only 1.3% of revenue in Q4. For a high-volume manufacturing model, that is a meaningful structural advantage.
Fabrinet also changed how it reports its revenue mix, moving toward end-market categories that better capture where customer products are ultimately deployed. The new presentation makes the AI infrastructure exposure much clearer.
- Data Center: $669.3 million, 51% of total revenue, up 68% year over year and 13% sequentially. This is now Fabrinet’s largest revenue category. The investment implication is that the company is no longer merely benefiting from a broad optical cycle; it is increasingly embedded in the physical connectivity layer of AI data centers, where bandwidth density and packaging complexity are rising together.
- Communications Infrastructure: $412.9 million, 31% of total revenue, up 40% year over year and 1% sequentially. Growth here was broad-based across telecom systems, satellite communications and components. This matters because it reduces the risk that the entire growth story rests on hyperscaler capex alone.
- Automotive, Industrial and Other: $233.6 million, 18% of total revenue, up 8% year over year and 9% sequentially. This segment is not the primary valuation driver, but it provides a useful stabilizer and demonstrates that Fabrinet can reuse precision-manufacturing capabilities across specialized end markets.
The historical product-category bridge is equally informative. Q4 optical communications revenue was $956.5 million. Within the legacy breakdown, telecom revenue was $698.5 million and DCI revenue was $255.9 million. DCI increased approximately 139% year over year and 30% sequentially, calculated from company-reported figures as $255.9 million / $107.0 million – 1 and $255.9 million / $196.9 million – 1, respectively. By contrast, legacy Datacom revenue was $258.0 million versus $276.9 million a year earlier and $260.4 million in Q3, showing that the DCI surge was not simply a broad Datacom recovery. The implication is important: the quarter’s optical acceleration was not a uniform recovery across every product family. It was disproportionately driven by DCI and other high-value data-center programs.
High-performance computing also remained a material growth vector. The investor presentation showed Q4 HPC revenue of $118.0 million, up from $106.7 million in Q3. Management said the business was running ahead of expectations and that next-generation silicon programs plus additional products were still ramping. HPC is now included inside the Data Center category, so investors should expect less granular disclosure going forward even as the economic importance of the program increases.
Expectations vs. Actual Results
- Revenue: $1.3158 billion actual versus approximately $1.27 billion consensus. ✅ Beat by roughly $45.8 million. The approximate 3.6% surprise is calculated from the reported actual and rounded consensus as $1.3158 billion / $1.27 billion – 1.
- Non-GAAP EPS: $4.10 actual versus approximately $3.81 consensus. ✅ Beat by $0.29. The approximate 7.6% surprise is calculated from the reported actual and consensus as $4.10 / $3.81 – 1.
- Non-GAAP operating margin: 10.9% actual. A reliable public pre-earnings Street consensus for operating margin was not available in the sources verified for this article, so no beat/miss label is assigned rather than inventing a benchmark. Relative to reported history, the margin expanded 20 basis points both sequentially and year over year.
- Q1 FY2027 revenue guidance: $1.375-$1.425 billion versus approximately $1.32 billion consensus. ✅ The $1.400 billion midpoint is about 6.1% above consensus, calculated as $1.400 billion / $1.32 billion – 1. Management said the midpoint implies roughly 43% year-over-year growth.
- Q1 FY2027 non-GAAP EPS guidance: $4.10-$4.25 versus approximately $3.99 consensus. ✅ The $4.175 midpoint is about 4.6% above consensus, calculated as $4.175 / $3.99 – 1. GAAP EPS guidance is $3.39-$3.54.
The real source of the Q4 beat was the composition of growth rather than a broad improvement across every legacy business. Data-center revenue increased by $77.3 million sequentially, while total company revenue increased by $101.5 million. In other words, approximately 76% of the sequential revenue increase came from Data Center, calculated from company-reported figures as ($669.3 million – $592.0 million) / ($1.3158 billion – $1.2143 billion). DCI alone added $59.0 million sequentially, equivalent to roughly 58% of the company’s total sequential revenue increase on the same basis. That is why investors should view DCI as the core incremental earnings engine of the quarter.
The EPS beat then amplified the revenue beat because Fabrinet’s operating-cost structure is unusually lean. Gross margin did not expand year over year, but operating margin did, demonstrating that incremental revenue is flowing through a relatively fixed operating-expense base. This is a more durable source of earnings leverage than relying on temporary pricing or mix benefits, although it also means future EPS upside will depend heavily on maintaining high factory utilization.
What does the market care about most now? Not the reported EPS number in isolation. At this stage of Fabrinet’s rerating, investors are likely to prioritize five variables: data-center and DCI growth, the ramp schedule for new transceiver and HPC programs, gross and operating margin durability, forward guidance, and evidence that the enormous capacity build is matched by durable customer demand. Pipeline quality and capacity utilization are increasingly more important for the valuation than a single quarter’s EPS surprise.
The share-price reaction makes that clear. Fabrinet rose 4.97% in the regular Aug. 17 session to $598.58 before the earnings release, then fell to roughly $556.27 by 7:59 p.m. ET, a decline of about 7.1% from the regular close. That after-hours level was also about 2.4% below the prior trading day’s $570.22 close. The earnings release therefore erased the entire pre-report rally despite better-than-expected revenue, EPS and Q1 guidance.
Calling the move simply “sell the news” would miss the more important signal. The most plausible interpretation is that expectations had become demanding enough that even a strong beat required evidence of further acceleration. Q1 guidance at the midpoint implies about 43% year-over-year revenue growth, slightly below Q4’s 45%. Management also disclosed Q4 free cash flow of negative $37 million as capex rose to $92 million, while non-GAAP gross margin remained below the year-ago level. None of these points invalidate the growth thesis, but they explain why investors may have focused on the cost of sustaining that growth rather than the headline beat.
The decline does not appear to be driven by acquisition dilution. Fabrinet did complete the acquisition of a new Navanakorn site and has an investment relationship with Raytek, but the call did not announce a large equity-funded acquisition that would mechanically dilute EPS. The stronger explanation is a valuation reset around growth durability, capital intensity and the gap between exceptionally strong demand commentary and a quarterly guidance cadence that still stops short of formal full-year FY2027 guidance.
Earnings Call Highlights
Management sees Data Center growth being driven simultaneously by DCI, transceivers and HPC, with customer visibility extending through fiscal 2027 and beyond.
💡 Reading Between the Lines: Fabrinet is trying to shift the investor narrative from dependence on one large optical program toward a multi-engine AI infrastructure platform. The valuation case becomes more defensible if merchant transceivers, hyperscaler-direct wins and HPC can grow at the same time, but visibility is not the same as committed backlog.
Management outlined a path from an exit-Q4 annualized revenue run rate of roughly $5.3 billion to $12.5-$14 billion of potential capacity over the coming years.
💡 Reading Between the Lines: Capital allocation is being optimized for growth rather than near-term free cash flow or buybacks. The upside is that Fabrinet can accept large new programs without a capacity bottleneck; the downside is that the company is effectively underwriting a multi-year AI and optical demand cycle before customer forecasts become firm orders.
Management believes Near-Packaged Optics may become a more immediate opportunity than Co-Packaged Optics, with Raytek helping bring critical packaging capabilities into Fabrinet’s Thailand ecosystem.
💡 Reading Between the Lines: Fabrinet is positioning itself to remain relevant as optical interconnect architectures move closer to the compute package. If successful, this could raise manufacturing complexity, switching costs and revenue density, but management explicitly said it is too early to quantify revenue or margin contribution.
Fabrinet is expanding beyond components into PCBAs, subsystems and complete network systems, including meaningful business with Cisco and Nokia.
💡 Reading Between the Lines: Moving up the manufacturing stack can increase content per customer platform and make relationships stickier because Fabrinet becomes harder to replace. It may also increase working-capital needs and deepen exposure to a smaller number of very large customers, so the quality of execution matters as much as the size of the opportunity.
Management said another year of accelerating revenue growth in FY2027 is possible based on the current demand picture, while stopping short of issuing formal full-year guidance.
💡 Reading Between the Lines: This is one of the most bullish comments from the call, but investors should treat it as directional confidence rather than a forecast. The stock’s multiple will likely remain sensitive to whether quarterly results actually validate this acceleration thesis, especially once year-over-year comparisons become more difficult.
2. Deep Business Insights
Hidden Metrics That Matter
First, the headline 51% Data Center mix understates how concentrated incremental growth has become. Data Center generated approximately 66.7% of Fabrinet’s absolute year-over-year revenue increase, calculated from company-reported figures as ($669.3 million – $398.5 million) / ($1.3158 billion – $909.7 million) = approximately 66.7%. This is not a company-reported percentage; it is calculated from company-reported figures. The implication is that the company is still diversified by customer and product, but the marginal dollar of growth is increasingly tied to AI-era data-center infrastructure.
Second, the capacity plan is far larger than the current earnings base. Management described an exit-Q4 annualized run rate of about $5.3 billion and a longer-term potential capacity range of $12.5-$14.0 billion. The implied expansion is approximately 136% to 164%, calculated from company-reported management figures as $12.5 billion / $5.3 billion – 1 and $14.0 billion / $5.3 billion – 1. This is a strategically important number because it shows management is not planning for a normal cyclical expansion; it is preparing the manufacturing footprint for a potential step-change in outsourced optical and AI hardware production.
The cost of that strategy is already visible in cash flow. Q4 capex of $92 million equaled about 61.7% of non-GAAP net income, calculated from company-reported figures as $92 million / $149.1 million. Operating cash flow was $55 million, so free cash flow was negative $37 million. Full-year FY2026 free cash flow was only $4 million despite $510.9 million of non-GAAP net income. Investors should not read that as weak demand or poor reported profitability; it is primarily a signal that Fabrinet is consuming cash to build capacity ahead of revenue. But at a premium valuation, the market will eventually demand evidence that those assets generate attractive incremental returns.
Why do customers choose Fabrinet? The company has built a distinctive operating model around high-complexity, high-mix optical and electro-mechanical manufacturing, using Silicon Valley operations as an NPI on-ramp and Thailand as a scaled, lower-cost production base. Management repeatedly emphasized that the company starts with difficult components and can move up through PCBAs and subsystems to complete network systems. That combination of optical packaging expertise, process engineering, high-volume yield management, supply-chain coordination and low-cost scale is difficult to replicate quickly.
The growing importance of revenue per square foot is another clue to the moat. Management said DCI products are physically small but revenue-dense, while more complex programs are allowing Fabrinet to increase output per unit of factory space. This means the capacity story is not only about constructing more buildings; it is also about improving the economic productivity of the installed footprint. If revenue density keeps rising, Fabrinet may be able to support faster sales growth without a proportional increase in fixed infrastructure.
Industry Chain Reactions
- ✅ Benefit — Cisco Systems (NASDAQ: CSCO): Cisco represented 20% of Fabrinet’s FY2026 revenue, making it Fabrinet’s largest customer. Fabrinet also cited significant Cisco complete-network-system business, while DCI was the largest contributor to Data Center growth. Strong outsourced manufacturing capacity and improving revenue density can help customers such as Cisco convert AI networking demand into shipments without building equivalent internal manufacturing infrastructure. The read-through is constructive for the physical networking and interconnect layer of AI spending.
- ❌ Face Pressure — Celestica (NYSE: CLS): This is an industry inference rather than a disclosed customer loss. Fabrinet’s plan to more than double potential capacity, deepen hyperscaler-direct transceiver relationships, expand HPC manufacturing, and move further into complete systems and advanced optical packaging increases competitive intensity for high-complexity outsourced AI and networking manufacturing awards. Celestica operates in overlapping high-value data-center and communications manufacturing markets, so Fabrinet’s expanding footprint could make future program wins more contested.
Valuation Framework and Key Risks
At approximately $556 after hours on Aug. 17, Fabrinet was still trading at a premium multiple even after the earnings-driven decline. Using company-reported FY2026 GAAP EPS of $13.05, the trailing GAAP P/E is approximately 42.6x, calculated as $556.27 / $13.05. Using FY2026 non-GAAP EPS of $14.09, the trailing adjusted P/E is approximately 39.5x.
A pre-earnings consensus estimate of roughly $17.23 in FY2027 non-GAAP EPS implies an after-hours forward P/E of approximately 32.3x at $556.27. That estimate may prove temporarily stale because Q1 guidance exceeded consensus and analysts may revise FY2027 numbers upward after the call. Even so, the current valuation still embeds a strong assumption that Fabrinet can sustain unusually high revenue growth while protecting operating leverage.
The valuation debate therefore should not be framed as “Is 32x expensive?” in isolation. A better framework is to ask what growth and return profile is required to justify it. If Fabrinet can deliver another year of 30%-plus revenue growth, sustain double-digit operating margin, convert the new capacity into high utilization, and eventually normalize free cash flow, the multiple can compress through earnings growth rather than through a lower share price. If growth slows toward the company’s pre-AI historical trend before the capacity build is absorbed, the downside risk becomes much larger because both earnings estimates and the valuation multiple could contract at the same time.
Key risks include:
- Customer concentration: Cisco, Nvidia, Nokia and Amazon represented 20%, 16%, 11% and 11% of FY2026 revenue, respectively. Together that equals 58% of annual revenue, calculated from company-reported customer percentages. Diversification has improved, but the absolute concentration remains high.
- Capacity and free-cash-flow risk: Q4 free cash flow was negative $37 million and full-year free cash flow was only $4 million because Fabrinet is investing aggressively in Building 10, Navanakorn and other facilities. The strategy works only if demand fills the new footprint at attractive returns.
- Gross-margin sensitivity: Q4 non-GAAP gross margin of 12.2% was 30 basis points below the prior year. Fabrinet’s business model can still generate operating leverage, but a structurally low gross margin leaves less room for execution errors, supply shocks or adverse mix.
- Supply constraints: Management said demand for some components exceeds available supply and that potential supply gaps are already incorporated into guidance. Strong end demand cannot become revenue if critical lasers, memory, ASICs or other components are unavailable.
- Technology transition risk: Fabrinet is active in pluggables, NPO and CPO, but customer architecture choices can shift rapidly. A manufacturing winner in one optical architecture is not automatically guaranteed the same economics in the next generation.
- Order-visibility risk: Management has visibility into fiscal 2027 and beyond, but it explicitly cautioned that longer-term customer forecasts are not order commitments. Investors should distinguish demand indications from backlog.
- Tax uncertainty: The company recorded a $57.4 million provision related to Thailand’s top-up tax regime under the OECD global minimum tax framework. Management said Thailand’s implementation environment remains in transition, so future tax expense and related benefits may vary.
The investment conclusion is therefore balanced. Operationally, Q4 strengthened the bull case: growth broadened, DCI became a billion-dollar-plus run-rate business, Data Center surpassed half of revenue, new transceiver programs are entering production, HPC remains strong, and the company is building a manufacturing footprint capable of supporting much larger revenue. Valuation, however, already assumes that Fabrinet converts these opportunities into sustained growth with little execution slippage. The after-hours decline is best interpreted as a reminder that the market is no longer asking whether Fabrinet is a good company; it is asking how much of an exceptional future is already embedded in the share price.
3. Key FAQs
What drove the FN Q4 2026 earnings beat?
The main driver was Data Center, particularly DCI. Data-center revenue rose 68% year over year to $669.3 million, while DCI reached $255.9 million and an annualized run rate above $1 billion. The revenue upside then translated efficiently into earnings because non-GAAP operating expenses were only 1.3% of sales, allowing non-GAAP operating margin to reach 10.9% and EPS to beat consensus by about 7.6%.
Why did Fabrinet stock fall after Q4 2026 earnings despite beating estimates?
FN fell roughly 7% after hours even though revenue, EPS and Q1 guidance all exceeded consensus. The reaction likely reflected a high starting valuation, Q1 midpoint revenue growth of about 43% versus 45% in Q4, negative Q4 free cash flow caused by heavy capex, a year-over-year decline in gross margin, and the fact that management’s very bullish multi-year demand commentary was not accompanied by formal full-year FY2027 guidance. The move is more consistent with a recalibration of expectations than with a deterioration in the underlying business.
What is Fabrinet’s Q1 FY2027 guidance and is FN stock expensive after earnings?
Fabrinet guided Q1 FY2027 revenue to $1.375-$1.425 billion and non-GAAP EPS to $4.10-$4.25. Both ranges were above pre-earnings consensus. At about $556 after hours, the stock traded at roughly 39.5x FY2026 non-GAAP EPS and about 32.3x a pre-earnings FY2027 adjusted EPS consensus of $17.23. That valuation can be justified only if high data-center growth, operating leverage and capacity utilization remain strong; a meaningful slowdown would expose the stock to both earnings-estimate and multiple risk.
Primary company sources: Fabrinet’s official Q4 and fiscal 2026 earnings release, official Q4 FY2026 investor presentation, and official earnings-call webcast and replay page. Fabrinet’s official event page did not publish a first-party written transcript at the time of verification, so management wording was cross-checked against the official webcast and a contemporaneous transcript. Street-consensus figures were cross-checked against Investing.com’s same-day earnings transcript and consensus summary, StreetInsider’s earnings summary, and MarketWatch analyst estimates and after-hours quote data.
Disclaimer: This article/chart is for educational and informational purposes only and does not constitute investment advice of any kind. Past performance is not indicative of future results. Investors should independently evaluate their own risks.