

Key Takeaways
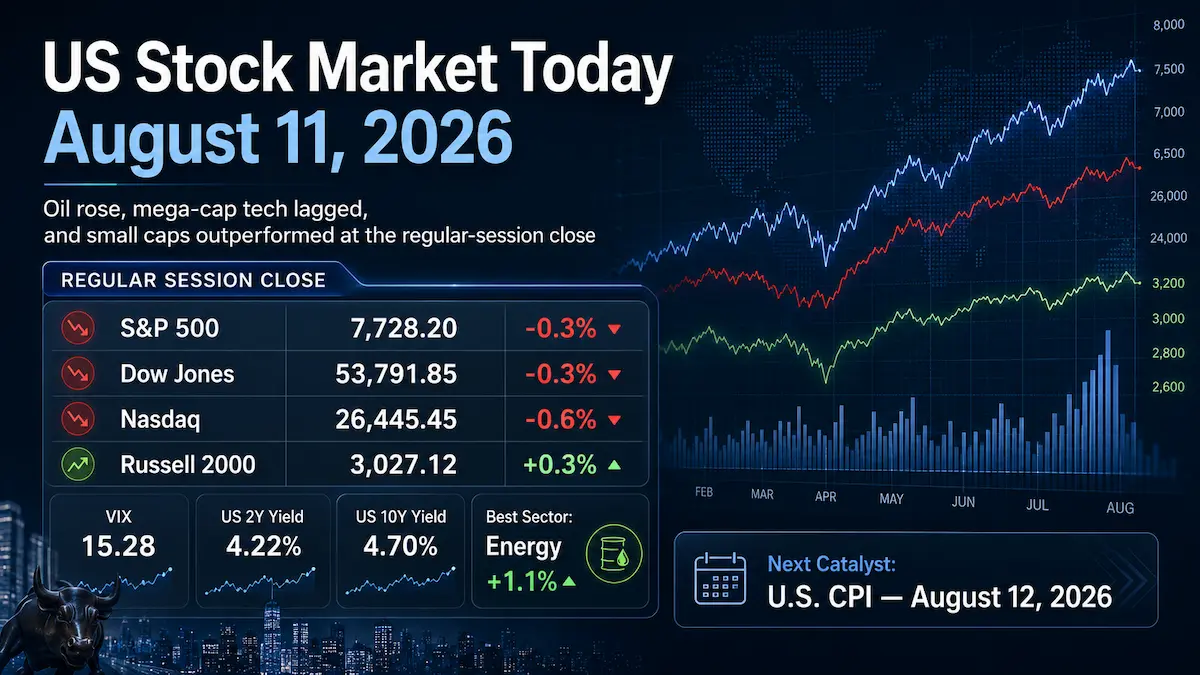
- The August 11 regular session ended lower for the major cap-weighted benchmarks: the S&P 500 fell 0.32% to 7,728.20, the Nasdaq Composite lost 0.60% to 26,445.45, and the Dow Jones Industrial Average declined 0.34% to 53,791.85. The Russell 2000 gained 0.3% to 3,027.12.
- The headline decline masked better underlying participation. S&P 500 advancers outnumbered decliners by 1.2-to-1, while Energy led the sector board with a 1.06% gain and Communication Services was the weakest sector, down about 2.0%.
- Mega-cap weakness was a key index drag: Alphabet fell 3.8% and Amazon lost 2.1%, while higher oil prices supported Energy and selected alternative asset managers rallied on the expanding AI-infrastructure financing theme.
- The U.S. Treasury 2-year yield fell 3 basis points to 4.22% and the 10-year yield eased 2 basis points to 4.70%. The VIX closed at 15.28, down 1.16%, indicating that the equity decline did not develop into a broad volatility shock.
- July CPI on August 12 and July PPI on August 13 are the next confirmed macro catalysts, with both releases scheduled for 8:30 a.m. ET.
1. Market Capital Flows and Sector Rotation:
Tuesday’s tape was better characterized as rotation than wholesale de-risking. The S&P 500 lost 0.32% and the growth-heavy Nasdaq fell 0.60%, but the Russell 2000 rose 0.3%. Energy was the strongest S&P 500 sector, up 1.06%, as Brent crude advanced 1.4% to $88.91 amid renewed uncertainty around a U.S.-Iran agreement and the Strait of Hormuz. Communication Services was the weakest sector, down roughly 2.0%, with Alphabet’s 3.8% decline contributing materially to the pressure. Only three of the 11 S&P 500 sectors finished higher, so the session was not broadly bullish; however, the relative strength in small caps and oil-sensitive cyclicals showed that capital was still being redeployed rather than simply withdrawn from equities.
Market breadth reinforced that distinction. Advancing S&P 500 constituents outnumbered decliners by 1.2-to-1 even as the index fell, and the benchmark recorded 22 new highs against only one new low. About 15.0 billion shares changed hands across U.S. exchanges, below the 20-session average of 17.6 billion. That combination—positive breadth, lighter volume and falling cap-weighted indexes—suggests that weakness was concentrated in influential large-cap names rather than driven by a market-wide liquidation.
Institutional Flow Insight: One plausible interpretation is that investors trimmed crowded, high-duration mega-cap exposures ahead of inflation data while retaining risk in smaller companies, Energy and selected financials. The decline in Treasury yields means the growth-stock weakness cannot be explained by a simple duration shock. Instead, the pattern is consistent with position concentration, valuation sensitivity and geopolitical hedging through oil-linked equities. There is no clear reason to attribute the move to month-start or quarter-start rebalancing on August 11, and any flow explanation should therefore be treated as an inference rather than confirmed institutional activity.
2. Decoding the Biggest Market Movers:
On Holding (ONON)
On Holding fell 20.29% in the regular session to $30.91 after its second-quarter report reset expectations for the pace of growth. The company’s official release showed Q2 net sales of CHF 850.3 million, up 13.5% year over year and 21.6% in constant currency. Gross margin rose to 65.4% from 61.5%, adjusted EBITDA margin improved to 19.8% from 18.2%, diluted Class A EPS was CHF 0.31, and adjusted diluted Class A EPS was CHF 0.35. The key valuation issue was the revenue trajectory: management moved full-year constant-currency sales growth guidance to the low-20% range from its Q1 guidance of at least 23%, citing deliberate management of wholesale sell-in. At the same time, it raised full-year gross-margin guidance to at least 65.0% and maintained adjusted EBITDA margin guidance at 19.5% to 20.0%. The market’s reaction therefore looked less like a rejection of the brand’s profitability and more like a sharp repricing of the growth premium attached to a high-multiple consumer name. For premium sportswear peers, the message is that margin expansion may not fully offset a slower top-line trajectory when expectations are elevated.
KKR & Co. (KKR)
KKR rose 6.88% in the regular session to $110.97 as investors focused on the firm’s role in NVIDIA’s newly announced AI-compute financing initiative. NVIDIA’s formal announcement named KKR alongside Apollo, BlackRock, Blackstone, Brookfield and Goldman Sachs in memorandums of understanding intended to establish independent financing platforms and mobilize more than $500 billion of third-party capital over time. That figure is a collective platform ambition, not a committed amount to KKR and not booked KKR revenue; the partnerships also remain subject to final agreements. The strategic fit is nevertheless significant. KKR’s latest Q2 release reported $796 billion of AUM, $1.2 billion of fee-related earnings, up 37% year over year, and GAAP diluted EPS of $0.70. In its official Q2 call transcript, management said KKR had committed and invested more than $75 billion across digital infrastructure and power and had launched Helix Digital Infrastructure with more than $10 billion of initial long-duration committed capital. The share move, alongside gains in Apollo and Blackstone, suggests the market is assigning incremental value to alternative managers that can turn AI infrastructure demand into scalable fee-bearing capital deployment.
The contrast between ONON and KKR captured the session’s broader allocation logic. Investors punished a high-expectation consumer growth story for moderating its sales trajectory while rewarding an asset manager tied to a potentially large new capital-formation channel. That divergence matters for sector valuation: earnings durability and identifiable deployment opportunities were rewarded more than headline growth alone.
3. Macro Indicators and Market Outlook
Cboe’s VIX closed at 15.28, down 0.18 point or 1.16% from 15.46. A falling VIX alongside lower equity indexes is notable because it suggests the decline was not accompanied by a broad rush for S&P 500 downside protection. That is consistent with the positive market breadth and small-cap outperformance. It does not mean event risk is absent: inflation data and Middle East developments can still reprice options rapidly, but the August 11 close did not show a generalized volatility shock.
U.S. Treasury data showed the 2-year yield at 4.22%, down 3 basis points from August 10, and the 10-year yield at 4.70%, down 2 basis points. The 2s10s curve was therefore about 48 basis points positive, roughly 1 basis point steeper on the day. The modest rally in Treasuries ahead of CPI can reflect a mix of event-risk caution and positioning, but it should not be interpreted as proof of a specific Federal Reserve decision. The front end remains highly sensitive to inflation and policy expectations, while the 10-year rate also embeds growth and term-premium risk. Importantly for equities, falling yields did not prevent mega-cap growth from underperforming, again pointing to stock-specific and positioning forces rather than rates alone.
Brent crude rose 1.4% to $88.91 as optimism around a U.S.-Iran agreement faded and uncertainty over the Strait of Hormuz persisted. Oil was therefore directly relevant to the equity rotation: it supported Energy while adding an inflation-sensitive geopolitical variable immediately before the CPI release.
Upcoming Economic Data & Catalysts:
- Consumer Price Index for July 2026 (Release date: August 12, 2026): The Bureau of Labor Statistics will release CPI at 8:30 a.m. ET. Investors will focus on the breadth and persistence of price pressures because the result can move front-end Treasury yields, equity duration and expectations for the Federal Reserve’s policy path.
- Producer Price Index for July 2026 (Release date: August 13, 2026): The BLS release is scheduled for 8:30 a.m. ET. Producer-price trends will help investors assess pipeline inflation and potential margin pressure, particularly for companies exposed to commodities, imports and labor-intensive supply chains.
Market Insights:
The August 11 decline was not a clean broad-risk-off signal. The cap-weighted indexes fell, but S&P 500 breadth was positive, the Russell 2000 advanced and the VIX declined. The more useful interpretation is a concentrated pullback in influential growth stocks alongside rotation into Energy, smaller companies and selected financials. The setup can reverse if inflation pushes Treasury yields sharply higher, breadth deteriorates, oil rises enough to revive inflation fears, corporate guidance weakens or the VIX expands materially from the mid-teens. Conversely, continued positive breadth would make a modest index decline less concerning than one accompanied by synchronized selling.
Trading & Investment Strategy:
Risk management should take priority around the inflation releases. Position sizes can be kept below maximum risk budgets until the rates response is visible, and new exposure can be staged rather than added at once. In growth equities, favor companies where earnings visibility can support valuation rather than chasing index-heavy names after large moves. In Energy, distinguish a durable cash-flow thesis from a short-lived geopolitical spike and avoid paying indiscriminately for an oil shock. Small-cap strength is constructive for breadth, but balance-sheet quality and refinancing sensitivity remain important with the 2-year yield above 4%. Use predefined loss limits, avoid leverage that depends on a single macro outcome, and resist chasing gap moves after catalysts.
4. Key FAQs About the US Stock Market Today
Why did the US stock market move on August 11, 2026?
The S&P 500, Nasdaq and Dow fell as large technology and communication-services names weakened and optimism around a U.S.-Iran agreement faded, lifting oil and Energy shares. The decline was partly offset by small-cap strength, positive S&P 500 breadth and lower Treasury yields, so the session looked more like rotation than broad capitulation.
Which sectors performed best and worst in the US stock market on August 11, 2026?
Energy was the best-performing S&P 500 sector, rising 1.06% as Brent crude gained 1.4%. Communication Services was the weakest, falling about 2.0%, with Alphabet’s 3.8% decline weighing heavily. The divergence reflected a shift toward oil-sensitive exposures and away from selected mega-cap growth positions.
What should investors watch after the US stock market close on August 11, 2026?
The immediate focus is July CPI on August 12, followed by July PPI on August 13. Investors should watch the reaction of the 2-year and 10-year Treasury yields, whether S&P 500 breadth remains positive, whether the VIX stays contained near the mid-teens, and whether oil-driven Energy leadership persists. A sharp yield increase, weaker breadth, renewed earnings downgrades or an escalation in geopolitical risk would raise the probability that the current rotation becomes a broader risk-off move.
Selected Primary Sources
Disclaimer: This article is intended solely for the exchange of investment ideas and does not constitute investment advice of any kind.