



Key Takeaways
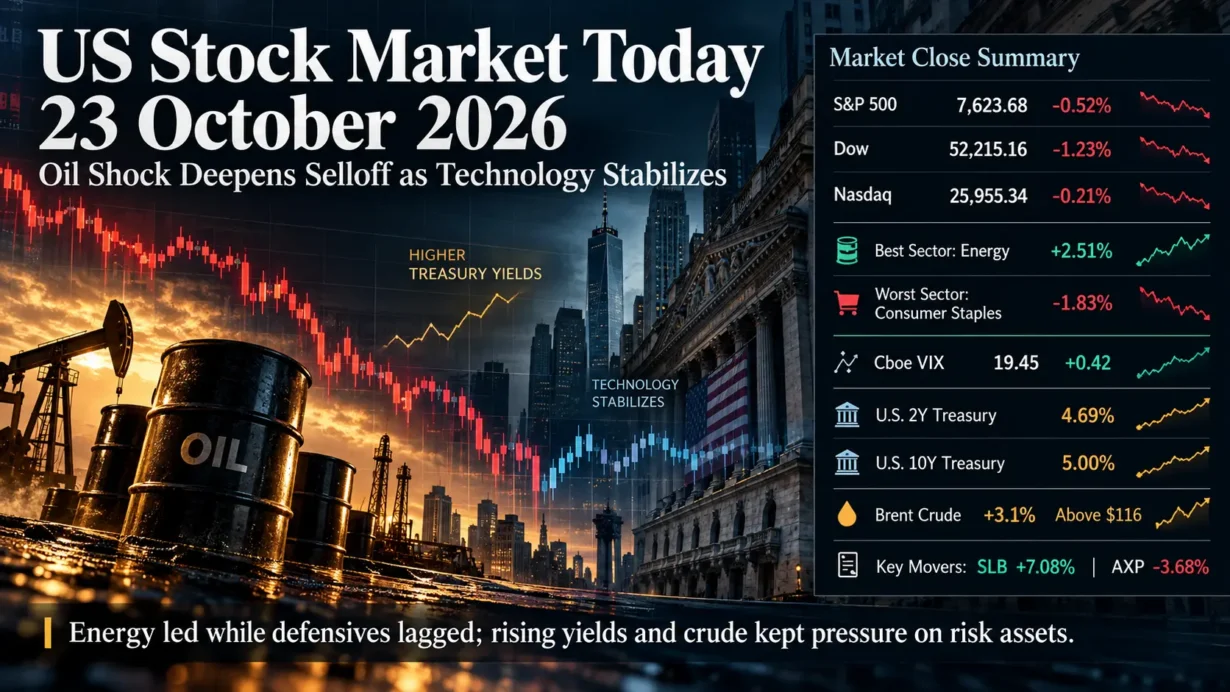
- The S&P 500 closed at 7,623.68 (−0.52%), the Dow at 52,215.16 (−1.23%), and the Nasdaq Composite at 25,955.34 (−0.21%) during Friday’s regular session.
- Energy led S&P 500 sectors (+2.51%), while consumer staples lagged (−1.83%). Technology advanced 0.35%, cushioning the Nasdaq after Thursday’s AI-led decline.
- Market participation remained weak: NYSE decliners outnumbered advancers 1.72 to 1. Brent crude rose 3.1% to above $116 a barrel amid renewed Middle East supply concerns.
- The Cboe VIX closed at 19.45 (+0.42); official Treasury two-year and 10-year yields each rose four basis points, to 4.69% and 5.00%, respectively.
- October’s final University of Michigan consumer sentiment index was 48.0, with one-year inflation expectations at 4.7%. SLB gained 7.08% after earnings; American Express lost 3.68% despite higher full-year guidance.
1. Market Capital Flows and Sector Rotation
The session was defined by a split between commodity-linked earnings exposure and businesses vulnerable to higher operating costs, financing rates or competitive pressure. S&P 500 energy gained 2.51%, the strongest sector, as oil prices rose following reported Houthi attacks in Saudi Arabia. Consumer staples fell 1.83%, the weakest sector, while financials and consumer discretionary also declined by more than 1%. Technology rose 0.35% as the most heavily scrutinized AI stocks steadied. These are S&P 500 sector moves, not sector-ETF returns. Sources: TipRanks sector recap and Reuters market close.
Style leadership was narrower than the headline suggested. The Russell 2000 closed at 2,775.90 (−0.29%), modestly outperforming the large-cap S&P 500 but still declining. On S&P Dow Jones Indices’ total-return measures, S&P 500 Growth lost 0.49% versus a 0.55% loss for Value on Friday; month to date, however, Growth was down 4.00% while Value was up 4.38%. Thus, Friday’s marginal growth resilience did not reverse October’s pronounced value leadership. Energy’s strength was cyclical and inflation-sensitive; staples’ weakness showed that defensive equities offered little immediate shelter. Sources: AP closing index data and S&P Dow Jones Indices.
Broader participation argued against a healthy, market-wide rebound: decliners led advancers by 1.72 to 1 on the NYSE and 1.57 to 1 on the Nasdaq. Consolidated U.S. exchange volume was 15.4 billion shares, below the 20-session average of 17.2 billion. The Nasdaq’s smaller decline therefore reflected relative resilience in selected large technology companies, not uniformly positive risk appetite. Source: Reuters breadth and volume data.
Institutional Flow Insight: The relative performance is consistent with investors potentially favoring near-term energy cash-flow sensitivity and more defensible large-cap earnings while reducing exposure to rising discount rates and uncertain AI infrastructure returns. Valuation discipline, sector risk limits and approaching month-end rebalancing could reinforce such positioning. These are interpretations of prices and breadth, not verified institutional transaction flows; energy shares rising does not establish net purchases by any investor class.
2. Decoding the Biggest Market Movers
SLB (SLB)
SLB closed at $53.06, up 7.08%. Its official third-quarter earnings release reported revenue of $9.449 billion, up 6% year over year, although growth excluding the ChampionX acquisition was 2%. GAAP diluted EPS was $0.49; adjusted EPS excluding charges and credits was $0.64, up 16% sequentially but down 7% year over year. Adjusted EBITDA margin improved 71 basis points quarter over quarter to 21.9%, yet remained 121 basis points below the year-earlier level; free cash flow totaled $828 million.
On the officially hosted earnings-call transcript, management outlined fourth-quarter revenue of approximately $10 billion and sequential adjusted EBITDA-margin expansion of 100–150 basis points, conditional on Middle East quarterly revenue remaining near $1.9 billion. Those figures are management guidance, not reported results. For oilfield-service peers, the real question is whether elevated crude prices ultimately translate into sustained offshore orders and margins despite regional disruption. The stock’s rally reflected a favorable earnings and oil-price combination, not proof of an industry-wide capital-spending acceleration.
American Express (AXP)
American Express finished at $313.22, down 3.68%. Its October 23 earnings release filed with the SEC reported $20.062 billion in third-quarter revenue net of interest expense, up 9% year over year; GAAP diluted EPS was $5.42, versus adjusted EPS of $4.68, up 13% from a year earlier. The GAAP result incorporated a $751 million after-tax gain on its Global Business Travel Group investment sale, while the adjusted measure excluded that gain net of a restructuring charge. Billed business rose 8% to $454 billion, and credit-loss provisions declined to $1.0 billion from $1.3 billion.
Management lifted 2026 guidance to $18.30–$18.60 in GAAP EPS and $17.60–$17.90 in adjusted EPS. On its official earnings webcast, executives also discussed a $336 million restructuring charge expected to eliminate approximately 5% of positions globally. Despite resilient premium-card spending and improved guidance, the share decline suggested scrutiny of recurring earnings quality, customer-reward economics, operating efficiency and regulatory costs. The move added pressure to the price-weighted Dow and illustrates why one-time gains and stronger guidance do not automatically support a higher valuation.
3. Macro Indicators and Market Outlook
The Cboe VIX spot index ended October 23 at 19.45, an increase of 0.42 points, or 2.21%. A rising volatility gauge alongside falling equities was directionally consistent with greater demand for downside protection or higher event-risk premiums, but the reading alone cannot identify actual options-hedging flows. It remained a sign of increased caution rather than evidence of disorderly market conditions.
The U.S. Treasury’s daily nominal par-yield series put the two-year yield at 4.69% and the 10-year at 5.00%, both up four basis points from October 22. The 10-year-minus-two-year spread therefore stood at +31 basis points, unchanged on the day. These are Treasury’s approximately 3:30 p.m. Eastern reference observations, not a claim about the final traded tick. Higher front-end yields were compatible with reduced confidence in near-term policy easing; longer yields also reflected possible inflation, supply and term-premium risks. Their individual contributions cannot be established from a single session.
Oil supplied the clearest cross-asset transmission channel: Brent rose 3.1% to above $116 a barrel, supporting producer economics while raising input-cost and inflation concerns elsewhere. The University of Michigan’s final October survey showed sentiment at 48.0 versus 48.1 in September and one-year inflation expectations increasing to 4.7% from 4.6%. This mix complicates the valuation outlook for rate-sensitive growth stocks and consumer-dependent businesses without mechanically determining the Federal Reserve’s next decision.
Upcoming Economic Data & Catalysts:
- Federal Open Market Committee policy decision (Release date: October 28, 2026, 2:00 p.m. ET): The rate decision, statement and 2:30 p.m. press conference will test expectations around inflation persistence, growth and the path of policy rates.
- BEA Personal Income and Outlays, September 2026 (Release date: October 29, 2026, 8:30 a.m. ET): The personal consumption expenditures inflation measures and spending data will inform real-rate assumptions, consumer earnings expectations and broader risk appetite.
Market Insights: Friday was a broad decline partially cushioned by large-cap technology, not a broad risk-on advance. A sustained oil-driven inflation premium, a sharp additional rise in Treasury yields, weaker participation, downward earnings revisions or disappointing AI capital-expenditure returns could overturn any stabilization. Conversely, improving breadth and easing rate pressure would strengthen the case for a more durable recovery; neither outcome is assured.
Trading & Investment Strategy: Keep position sizes consistent with volatility and liquidity limits, stagger entries rather than chase energy’s one-day strength, and favor companies with verifiable cash conversion and manageable financing exposure. Review sector concentration and predefine invalidation levels or stop-loss rules appropriate to each mandate. Ahead of the FOMC and inflation releases, reserve risk capacity for potential gaps, especially in expensive growth and consumer-sensitive shares.
4. Key FAQs About the US Stock Market Today
Why did the US stock market move on October 23, 2026?
Oil-supply concerns lifted crude prices and Treasury yields, while doubts over AI spending economics and weakness in consumer and financial shares pressured the broader market. Technology stabilized relative to Thursday, but disappointing market breadth outweighed that support.
Which sectors performed best and worst in the US stock market on October 23, 2026?
Energy was the strongest S&P 500 sector, up 2.51%, supported by higher oil prices; consumer staples was weakest, down 1.83%, as inflation and cost concerns outweighed its traditionally defensive profile.
What should investors watch after the US stock market close on October 23, 2026?
Monitor the October 28 Federal Reserve decision, the October 29 PCE inflation release, the direction of two- and 10-year Treasury yields, volatility and market breadth. The persistence of energy leadership versus broader earnings revisions is more informative than one day’s index-level rebound.
Disclaimer: This article is intended solely for the exchange of investment ideas and does not constitute investment advice of any kind.