


Key Takeaways
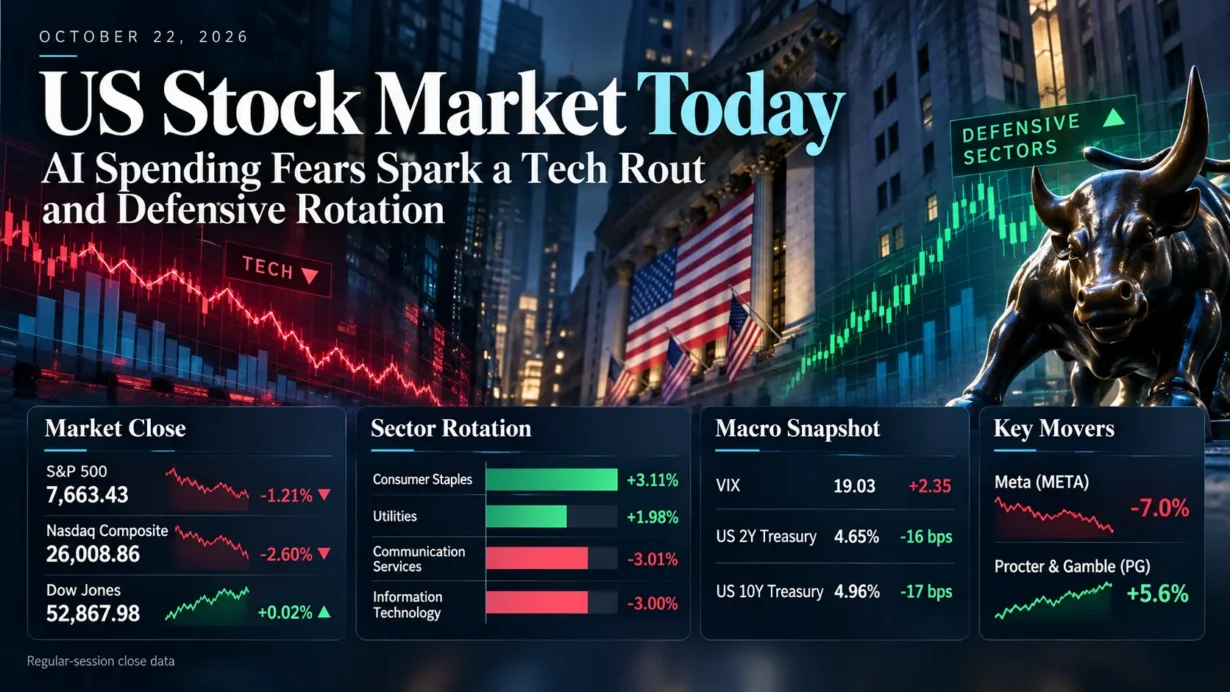
- The S&P 500 fell 1.21% to 7,663.43 and the Nasdaq Composite lost 2.60% to 26,008.86; the Dow edged up 0.02% to 52,867.98, while the Russell 2000 gained 0.11%.
- Consumer staples (+3.11%) and utilities (+1.98%) led the S&P 500’s sectors; communication services (-3.01%) and information technology (-3.00%) lagged, exposing a sharp split between defensives and AI-linked growth.
- Meta Platforms fell 7.0% after disclosing negative quarterly free cash flow and substantial AI investment commitments; Procter & Gamble rose 5.6% on reported sales growth and earnings.
- Initial jobless claims declined to 194,000, while official two- and 10-year Treasury yields fell to 4.65% and 4.96%, respectively. The Cboe VIX closed at 19.03, up 2.35 points.
1. Market Capital Flows and Sector Rotation
Thursday’s decline was concentrated in the market’s growth-heavy leadership, not a uniform retreat across U.S. equities. Six of the 11 S&P 500 sectors finished higher. Consumer staples gained 3.11% and utilities rose 1.98%, while communication services lost 3.01% and information technology fell 3.00%, according to the Xinhua closing market report. Semiconductor pressure was especially acute: the Philadelphia Semiconductor Index sank 6.7%, according to Reuters. Those are S&P 500 sector-index returns, not returns on sector ETFs.
Capitalization and style explain much of the divergence. The technology-heavy Nasdaq underperformed the blue-chip Dow, and the small-cap Russell 2000 finished modestly higher. Investors favored defensive earnings and cash generation over capital-intensive, long-duration growth. That relative performance resembles a rotation away from growth leadership, but is not a verified return comparison between formal growth and value indices. Cyclicals did not advance as one group, and even rate-sensitive utilities outperformed despite uncertainty over the inflation outlook.
Market breadth confirms the distinction. NYSE advancers narrowly exceeded decliners, 1.01 to 1, while Nasdaq decliners outnumbered advancers 2,766 to 2,022. Consolidated U.S. equity volume reached 18.79 billion shares versus a 20-session average of 17.19 billion, based on Reuters’ closing statistics. The mixed breadth and heavier volume signal intense repricing in selected exposures rather than confirmed marketwide capitulation.
Institutional Flow Insight: The price action is consistent with some portfolios reducing concentrated AI spending exposure and favoring businesses with more visible near-term cash conversion. Falling Treasury yields could also help duration-sensitive utilities. Valuation discipline, earnings visibility and tighter volatility-driven risk budgets offer plausible explanations; neither actual institutional net purchases nor a quarter-opening rebalancing program can be established from closing prices alone.
2. Decoding the Biggest Market Movers
Meta Platforms (META)
Meta fell 7.0% in the regular session. Its official third-quarter earnings release filed with the SEC showed revenue of $64.601 billion, up 26% year over year, and GAAP diluted EPS of $3.83. Reported operating margin was 20%, versus 40% a year earlier, but the comparison includes a $9.89 billion legal settlement charge. That distinction matters: the stronger advertising business and the GAAP margin contraction should not be treated as evidence of the same underlying operating trend.
The larger valuation issue was cash intensity. Meta disclosed $34.91 billion in quarterly capital expenditures including finance-lease principal payments, alongside negative free cash flow of $2.12 billion. Management’s published earnings-call transcript corroborates those figures. The company set its full-year 2026 capital expenditure guidance at $135 billion to $145 billion and outlined a new nonvoting Class C share class with a conditional stock dividend equivalent to a two-for-one split. The stock dividend itself is not a new operating cash expense; the potential future use of nonvoting shares for financing and the sustainability of AI investment returns are separate governance and valuation questions. Meta’s repricing weighed on communication services and reinforced scrutiny of AI infrastructure spending across large-cap technology.
Procter & Gamble (PG)
P&G gained 5.6% at the regular-session close, supporting consumer staples. In its official fiscal first-quarter 2027 release, the company reported net sales of $23.3 billion, up 4%, with organic sales growth of 4%, GAAP diluted EPS of $1.97 and non-GAAP core EPS of $2.00. Core gross margin nonetheless declined 150 basis points year over year. Management maintained fiscal-year organic sales growth guidance of 1% to 3% and core EPS guidance of $6.89 to $7.11, while citing an approximately $1.4 billion after-tax commodity cost headwind. These ranges are company guidance, not realized earnings. The market’s response suggests a preference for demonstrated volume and cash flow resilience, but higher input costs remain a material risk even for defensive franchises.
3. Macro Indicators and Market Outlook
The Cboe Volatility Index finished at 19.03 at 4:15 p.m. Eastern, up 2.35 points, or 14.09%, from 16.68. The increase was directionally consistent with the S&P 500’s decline and signals higher option-implied near-term volatility. It is consistent with greater demand for protection around earnings and policy risk, although the index does not independently verify that investors purchased more hedges.
The U.S. Treasury’s official constant-maturity par yield series put the two-year yield at 4.65%, down 16 basis points from 4.81%, and the 10-year yield at 4.96%, down 17 basis points from 5.13%. The two- to 10-year curve remained upward sloping by 31 basis points, compared with 32 basis points the previous session. A simultaneous equity selloff and Treasury rally can be consistent with a flight toward duration, but one day of yield changes cannot establish a new Federal Reserve policy path or isolate shifts in inflation expectations, growth expectations and term premium.
The Labor Department’s October 22 release reported seasonally adjusted initial jobless claims of 194,000 for the week ended October 17, down 6,000; continuing claims rose 25,000 to 1.728 million for the preceding reference week. Low initial claims indicate limited near-term layoff stress rather than a clear recession signal. Separately, rising crude prices amid renewed Middle East tensions added an inflation risk that complicates a straightforward lower-yields-means-easier-policy narrative.
Upcoming Economic Data & Catalysts:
- Federal Open Market Committee policy announcement (Release date: October 28, 2026): The October 27–28 meeting and scheduled press conference will focus attention on the policy stance, inflation risks and the outlook for financing conditions.
- BEA advance third-quarter GDP estimate and September Personal Income and Outlays (Release date: October 29, 2026): Both are scheduled for 8:30 a.m. ET. Growth, consumer spending and PCE inflation data may affect rate-sensitive valuations and earnings assumptions.
Market Insights: The session looks more like a capitalization-weighted AI and semiconductor de-rating than a broad liquidation: the Nasdaq fell sharply, but the Dow and Russell 2000 held their ground and most S&P sectors gained. A renewed rise in Treasury yields, weaker market breadth, downward earnings revisions, an adverse Fed surprise or another jump in the VIX could spread pressure beyond technology. Conversely, better evidence of AI investment returns would challenge the current repricing.
Trading & Investment Strategy: Size exposures to portfolio risk budgets rather than to the size of a single-day price move. Consider staged entries, diversified sector allocations and predefined exit or stop-loss levels appropriate to volatility and liquidity; stop orders do not guarantee execution at the intended price. Avoid chasing defensive winners after a sharp one-day rally or assuming that a steep decline in AI shares automatically creates value. Monitor cash-flow conversion, rate sensitivity and participation across the broader market before materially adding risk.
4. Key FAQs About the US Stock Market Today
Why did the US stock market move on October 22, 2026?
Meta’s negative free cash flow and heavy AI capital spending intensified scrutiny of technology valuations, pushing semiconductors and the Nasdaq lower. Falling Treasury yields, low initial jobless claims and higher oil-related inflation risks provided a mixed macro backdrop; P&G’s results helped defensive stocks outperform.
Which sectors performed best and worst in the US stock market on October 22, 2026?
Consumer staples (+3.11%) and utilities (+1.98%) led the S&P 500, while communication services (-3.01%) and information technology (-3.00%) were the weakest. The gap illustrates selective preference for earnings durability over AI-related investment risk, not a verified measure of institutional fund flows.
What should investors watch after the US stock market close on October 22, 2026?
Watch the October 28 FOMC decision, October 29 GDP and PCE-related releases, Treasury yield direction, semiconductor leadership, Nasdaq market breadth and corporate commentary on capital spending versus free cash flow. These are risk indicators, not guaranteed signals of the next market move.
Disclaimer: This article is intended solely for the exchange of investment ideas and does not constitute investment advice of any kind.